. 2025 Jun 1;110(6):1278-1291.
doi: 10.3324/haematol.2024.285616. Epub 2024 Dec 19.

Bleximenib, the novel menin-KMT2A inhibitor JNJ-75276617, impairs long-term proliferation and immune evasion in acute myeloid leukemia

Affiliations

Bleximenib, the novel menin-KMT2A inhibitor JNJ-75276617, impairs long-term proliferation and immune evasion in acute myeloid leukemia

Shanna M Hogeling et al. Haematologica. .

Abstract

Acute myeloid leukemia (AML) remains challenging to treat, which in part relates to genetic heterogeneity of the disease, to the protective tumor microenvironment driving resistance to therapy, and also to immune evasion characteristics of leukemic cells. Targeting epigenetic programs in AML provides an attractive opportunity to impair long-term proliferation and induce differentiation. The novel inhibitor JNJ-75276617 (bleximenib) targets the menin-KMT2A interaction and has shown preclinical efficacy in AML.1 Here, we provide mechanistic insights into how JNJ-75276617 impairs proliferation and drives differentiation of primary AML patient cells. A large-scale drug screen was set up in which genetic alterations and quantitative proteomics were compared with drug sensitivity in a preclinical setting, which revealed that granulocyte-macrophage progenitor (GMP)-like AML display the greatest sensitivity. Furthermore, we identified that NPM1c/DNMT3Amut AML are sensitive, and some NPM1wt AML subtypes without KMT2A-MLLT3 rearrangements benefit from menin-KMT2A inhibition. Genome-wide chromatin immunoprecipitation- sequencing studies revealed patient-specific epigenetic alterations upon JNJ-75276617 treatment, uncovering a striking upregulation of MHC class I and class II expression as a consequence of epigenetic changes upon menin-KMT2A inhibition, independent of MEIS1 loss but involving CIITA activation. Functionally, this results in enhanced sensitivity of leukemic blasts to T-cell-mediated cytotoxicity in allogeneic and autologous settings. Our data indicate that JNJ-75276617 provides a potential therapeutic approach whereby not only proliferation is impaired and differentiation is induced, but whereby therapeutic benefit might also be achieved by reactivating the antigen presentation machinery.


Figures

Figure 1.
Figure 1.
Heterogeneity in sensitivity to menin-KMT2A inhibition across the diverse genetic landscape of acute myeloid leukemia. (A) Area under the curve (AUC) values at day 7 and day 14 of the JNJ-75276617 inhibitor drug screen in primary acute myeloid leukemia (AML) patients’ samples with various mutations in liquid culture. AUC values were calculated to show the effect of the inhibitor on proliferation. AML samples are ordered based on high, late, early and low sensitivity. Gray tiles with a star (*) annotate not determined (ND) samples. Wild-type genes are annotated with a gray tile (WT) and mutated genes are annotated with a red tile (Mut). (B) AUC values of the JNJ-75276617 inhibitor drug screen in ten AML cell lines. Wild-type genes are annotated with a gray tile (WT) and mutated genes with a purple tile (Mut). (C) Dose-dependent effects on cell viability upon treatment of the cord blood KMT2A-AF9 model with JNJ-75276617 under liquid culture (LQ) conditions. (D) Paired analysis of AUC values calculated for the effect of JNJ-75276617 inhibitor treatment on LQ and MS5 co-cultured healthy CD34+ cells on day 7 (N=6, biological replicates). (E) Boxplots showing AUC values of DNMT3Amut versus DNMT3AWT in NPM1c primary AML patients’ samples on LQ day 7, 14 and MS5 day 14. Statistical analysis by the unpaired Student t test or paired for panel (D). DMSO: dimethylsufoxide; NS: not statistically significant. *P<0.05, **P<0.01, ***P<0.001.
Figure 2.
Figure 2.
Menin-KMT2A inhibition induces differentiation in leukemic blast cells. (A) Line plots showing the mean fluorescent intensity (MFI) of CD11b normalized to the dimethyloxidesulfoxide (DMSO) control for liquid culture (LQ) day 7 (N=19). Black curves represent samples in which JNJ-75276617 also blocked proliferation, red curves represent samples in which proliferation was less affected by JNJ-75276617 treatment. (B) Comparison between AUC and CD11b expression (normalized to DMSO control) identifying four groups: proliferation, differentiation and proliferation, differentiation only, and weak responders. Red dots represent samples in which proliferation was less affected by menin-KMT2A inhibition. (C) Absolute cell counts for gates drawn for blast-like and monocyte-like cell populations. showing the dose-dependent effect on proliferation of the JNJ-75276617 inhibitor on LQ day 7. (D) Flow cytometry plots of AML17 and AML13 on LQ day 7. CD45 expression and side scatter (SSC) are depicted for DMSO, 0.03, 0.3 and 3.0 µM JNJ-75276617 inhibitor. Gates are drawn for blast-like (B) and monocyte-like (M) cell populations. (E) Bar plots depicting the MFI of CD11b normalized to the DMSO control for AML17 and AML13 on LQ day 7. Statistical analysis by unpaired Student t test. *P<0.05, **P<0.01, ***P<0.001.
Figure 3.
Figure 3.
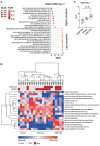
Quantitative proteome analyses link menin-KMT2A inhibitor sensitivity to more committed granulocyte-macrophage progenitor-type acute myeloid leukemias. (A) Dot plot of gene set enrichment analysis (GSEA) signatures enriched in sensitive and less sensitive primary acute myeloid leukemia (AML) samples at MS5 day 7. (B) Selection of single-sample GSEA terms from proteome dataset AML samples to identify maturation state. Hematopoietic stem cell (HSC)-like, granulocyte-macrophage progenitor (GMP)-like and mixed samples were identified. DNMT3A and NPM1c were annotated, with gray representing wildtype (WT) and red representing mutated (Mut). (C) Comparison between AUC values in GMP-like, mixed and HSC-like groups of MS5 day 7. Statistical analysis by the unpaired Student t test. NES: normalized enrichment score.
Figure 4.
Figure 4.
Chromatin immunoprecipitation sequencing reveals common and acute myeloid leukemia-specific targets upon menin-KMT2A inhibition. (A) Average plots showing genome-wide H3K27ac and H3K4me3 changes after menin-KMT2A inhibition for 4 days in AML2, AML22, AML5 and OCI-AML3 cells. (B) H3K27ac, H3K4me3 and H3K27me3 chromatin immunoprecipitation sequencing tracks of AML2, AML22, AML5 and OCI-AML3 cells treated with dimethylsulfoxide (DMSO) or 0.03 (AML22)/0.3 µM JNJ-75276617 inhibitor for 4 days showing MEIS1, IGF2BP2 and the HOXA cluster. (C) Venn diagrams showing overlap in genes with a fold change (FC) < -0.585 for H3K4me3 expression in menin-KMT2A inhibitor JNJ-75276617-treated versus DMSO-treated cells. RRPM: reference normalized reads per million mapped reads.
Figure 5.
Figure 5.
Menin-KMT2A inhibition drives HLA expression in a MEIS1-independent but CIITA-dependent manner in the case of MHC class II. (A) H3K27ac and H3K4me3 chromatin immunoprecipitation (ChIP) sequencing tracks of AML2, AML22, AML5 and OCI-AML3 cells treated with dimethylsulfoxide (DMSO) or 0.03 (AML22)/0.3 µM JNJ-75276617 inhibitor for 4 days showing HLA-A, HLA-DPA1/B1 and HLA-DRA loci. (B) Bar plots showing relative mRNA expression of HLA-A, HLA-DR and CIITA in 4-day JNJ-75276617 inhibitor-treated primary acute myeloid leukemia (AML) patients’ samples normalized to DMSO. Triangles annotate NPM1c samples. (C) Bar plot depicting mean fluorescent intensity (MFI) of HLA-DR in 4-day DMSO- or JNJ-75276617 inhibitor-treated primary AML patients’ samples normalized to DMSO. Triangles annotate NPM1c samples. (D) Bar plot showing ChIP quantitative polymerase chain reaction data of MOLM13 cells with empty vector (EV)-green fluorescent protein (GFP) and GFP-menin using antibodies against GFP. (E) Bar plot showing MFI of HLA-DR in MV4-11 scrambled (SCR), CIITA heterozygous knockout (CIITA+/-) and CIITA homozygous knockout (CIITA-/-) cells treated with DMSO, 0.03, 0.30 or 3.00 µM JNJ-75276617 inhibitor for 4 days (N=3). (F) MFI of HLA-DR in MV4-11 scrambled, CIITA+/- and CIITA-/- in control cells. (G) MFI of HLA-DR in MV4-11 scrambled, CIITA+/- and CIITA-/- cells treated with DMSO, 0.03, 0.30 or 3.00 µM JNJ-75276617 inhibitor for 4 days. Error bars represent mean ± standard error of the mean. Statistical analysis by the unpaired Student t test or simple linear regression. NS: not statistically significant. *P<0.05, **P<0.01, ***P<0.001.
Figure 6.
Figure 6.
Menin-KMT2A inhibition enhances T-cell cytotoxicity. (A) Bar plots depicting mean fluorescent intensity of HLA-DR in dimethylsulfoxide (DMSO) or 0.3 µM JNJ-75276617 inhibitor-treated MV4-11 and MOLM13 cells normalized to DMSO. (B) Bar and line plots showing viable acute myeloid leukemia (AML) counts (bar plot) determined by annexin-V and Zombie NIR™ of different effector:target (E:T) ratios in DMSO or JNJ-75276617 pre-treated MV4-11 and MOLM13 cells co-cultured with allogeneic T cells for 72 hours. MV4-11 cells were pre-treated with 0.1 µM JNJ-75276617 and MOLM13 cells with 0.3 µM. E:T ratios were normalized to 0:1 (line plot). (C) Line plots showing normalized viable cell counts, determined by annexin-V and Zombie NIR™, of different E:T ratios in eight primary AML samples, which were pre-treated with DMSO or 0.3 µM JNJ-75276617 and co-cultured with allogeneic T cells for 72 hours. E:T ratios were normalized to their DMSO control. (D) Tile plot depicting the mutational status of primary AML samples used in panel (C). Error bars represent mean ± standard error of the mean. Statistical analysis by the unpaired Student t test. *P<0.05, **P<0.01, ***P<0.001.
Figure 7.
Figure 7.
Menin-KMT2A inhibition enhances T-cell cytotoxicity. (A) Bar plot showing relative acute myeloid leukemia (AML) counts in primary AML samples (N=9) treated with dimethylsulfoxide (DMSO) or 0.3 µM JNJ-75276617 inhibitor cultured without T cells (depleted) or with T cells (enriched). (B) Paired comparison of JNJ-75276617-treated primary AML samples cultured without or with T cells. (C) Three examples of panel (B). (D) Paired comparison of MHC class I and MHC class II mean fluorescent intensities (MFI) of primary AML samples shown in (B) upon treatment with 0.3 µM JNJ-75276617 inhibitor. Expression is relative to the DMSO samples. (E) MHC class I and MHC class II expression of three primary AML samples shown in (D) treated with DMSO or 0.3 µM JNJ-75276617 inhibitor and MHC class II expression of MOLM13 and MV4-11 cells treated with DMSO or 0.3 µM JNJ-75276617 inhibitor. Error bars represent mean ± standard error of the mean. Statistical analysis by the unpaired Student t test. *P<0.05, **P<0.01, ***P<0.001.

References

    1. Kwon MC, Thuring JW, Querolle O, et al. . Preclinical efficacy of the potent, selective menin-KMT2A inhibitor JNJ-75276617 (bleximenib) in KMT2A- and NPM1-altered leukemias. Blood. 2024;144(11):1206-1220. - PMC - PubMed
    1. Miller CA, Wilson RK, Ley TJ. Genomic landscapes and clonality of de novo AML. N Engl J Med. 2013;369(15):1473. - PMC - PubMed
    1. de Boer B, Prick J, Pruis MG, et al. . Prospective isolation and characterization of genetically and functionally distinct AML subclones. Cancer Cell. 2018;34(4):674-689.e8. - PubMed
    1. Klco JM, Spencer DH, Miller CA, et al. . Functional heterogeneity of genetically defined subclones in acute myeloid leukemia. Cancer Cell. 2014;25(3):379-392. - PMC - PubMed
    1. Yang W, Ernst P. SET/MLL family proteins in hematopoiesis and leukemia. Int J Hematol. 2017;105(1):7-16. - PubMed

MeSH terms