. 2024 Dec 20;9(24):e182352.
doi: 10.1172/jci.insight.182352.

Transcriptomic profiling of thyroid eye disease orbital fat demonstrates differences in adipogenicity and IGF-1R pathway

Affiliations

Transcriptomic profiling of thyroid eye disease orbital fat demonstrates differences in adipogenicity and IGF-1R pathway

Dong Won Kim et al. JCI Insight. .

Abstract

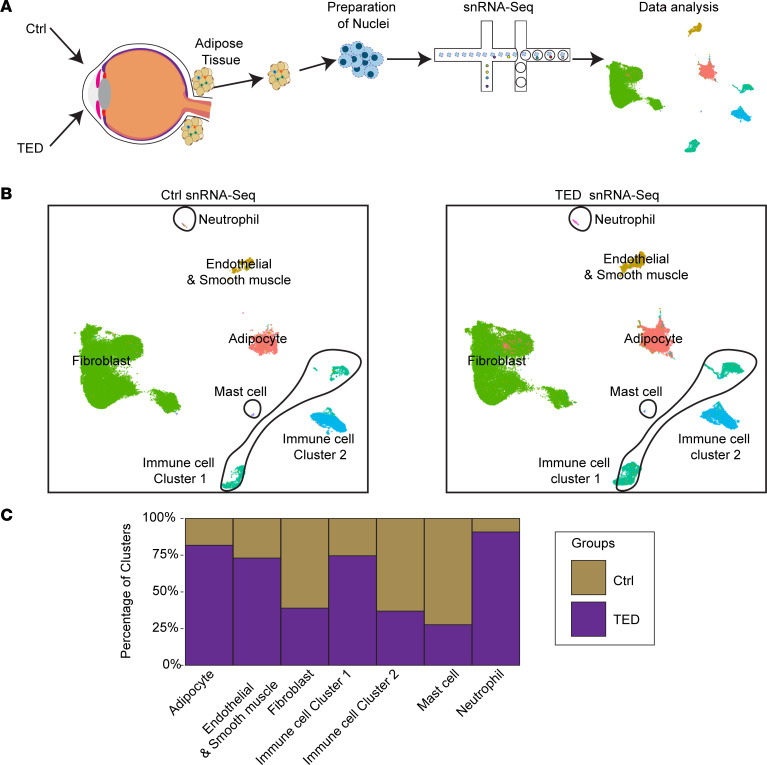
Despite recent advances in the treatment of thyroid eye disease thyroid-related eye disease (TED), marked gaps remain in our understanding of the underlying molecular mechanisms, particularly concerning the insulin-like growth factor-1 receptor (IGF-1R) pathway. To dissect the pathophysiology of TED, we used single-nucleus RNA-Seq to analyze orbital fat specimens from both patients with TED and matched individuals acting as controls. The analysis demonstrated a marked increase in the proportion of fibroblasts transitioning to adipogenesis in the orbital fat of patients with TED compared with that in control patients. This was associated with diverse alterations in immune cell composition. Significant alterations in the IGF-1R signaling pathway were noted between TED specimens and those from control patients, indicating a potential pathological mechanism driven by IGF-1R signaling abnormalities. Additionally, our data showed that linsitinib, a small-molecule inhibitor of IGF-1R, effectively reduced adipogenesis in TED orbital fibroblasts in vitro, suggesting its potential utility as a therapeutic agent. Our findings reveal that, beyond immune dysfunction, abnormal IGF-1R signaling leading to enhanced adipogenesis is a crucial pathogenic mechanism in TED.

Keywords: Adipose tissue; Inflammation; Ophthalmology; Thyroid disease.


Conflict of interest statement

Conflict of interest: FR has been a researcher at Immunovant, Roche, and Viridian and has been a consultant and advisor at Amgen and Acelyrin. SB has been a researcher at Genentech and Bayer. SB is a cofounder, shareholder, and scientific advisory board member of CDI Labs.

Figures

Figure 1
Figure 1. Overview of the experimental approach and cell-type distribution in the control and TED groups.
(A) Schematic of the experimental workflow. (B) UMAP plots illustrating the distribution of cell types in the control (left) and TED (right) groups. (C) Bar graphs comparing the distribution of cell clusters between the control and TED groups identified in snRNA-Seq.
Figure 2
Figure 2. Immune cell analysis and pathway enrichment in the control and TED groups.
(A) UMAP plot of immune cells in the control and TED groups. (B) GO pathway analysis of genes enriched in TED immune cells. (C) Heatmap displaying the expression of control- or TED-enriched genes in immune cells. (D) UMAP plot showing identified subclusters of immune cells across all samples. (E) Bar graphs comparing the distribution of immune cell clusters between the control and TED groups identified in snRNA-Seq.
Figure 3
Figure 3. Analysis of orbital fibroblast subtypes and adipogenic gene expression in the control and TED groups.
(A) Violin plots showing genes enriched in specific clusters across orbital fibroblast subtypes in all samples. (B) UMAP plot showing the distribution of orbital fibroblast subclusters in control (left) and TED (right) samples. (C) Bar graphs comparing the distribution of orbital fibroblast subclusters between the control and TED groups. (D) Heatmap displaying the expression of adipogenic and IGF-related genes across groups.
Figure 4
Figure 4. Characterization of orbital adipocyte subtypes and IGF-related gene expression.
(A) Violin plots showing genes enriched in specific clusters across orbital adipocyte subtypes in all samples. (B) UMAP plot showing the distribution of orbital adipocyte subclusters in control (left) and TED (right) groups. (C) Bar graphs comparing the distribution of orbital adipocyte subclusters between the control and TED groups. (D) Bar graphs showing the expression of ANXA1, PDZRN4, and CTH in undifferentiated control and TED fibroblasts. n = 3 cell lines each, performed in triplicate.*P < 0.001 by unpaired t test. (E) GO pathway analysis of genes enriched in control (left) and TED adipocytes (right). (F) Heatmap displaying the expression of IGF-related genes across groups.
Figure 5
Figure 5. Combined analysis of orbital fibroblasts and adipocytes in TED groups and pathway analysis.
(A) UMAP plot showing merged orbital fibroblasts and adipocytes in the TED group (top) and previously identified (see Figure 3B and Figure 4B) clusters (bottom). (B) UMAP plots showing the expression of cluster-specific/enriched genes. (C) Gene modules in TED fibroblast (left) and TED adipocytes (right). (D) GO pathway analysis of gene modules in TED fibroblasts (left) and TED adipocytes (right).
Figure 6
Figure 6. Effect of linsitinib on adipogenesis and IGF1R expression in orbital fibroblasts.
(AL) Oil Red O staining of orbital fibroblasts treated with adipogenic media (A, E, and I) and 0.1 μM (B, F, and J), 1 μM (C, G, and K), or 10 μM (D, H, and L) linsitinib on days 0 (AD), 5 (EH), and 9 (IL) after treatment. Arrows indicate Oil Red O+ adipocytes. Scale bar: 50 μm. (M) Bar plot showing the percentage of adipocytes after treatment with standard adipogenic medium and 0, 0.1, 1, or 10 μM linsitinib on days 0, 5, and 9. *P < 0.05; **P < 0.01; ****P < 0.0001 by Tukey’s multiple comparison test. (N) Bar plot showing the percentage of adipocytes after treatment with insulin-free adipogenic medium and 0, 0.1, 1, or 10 μM linsitinib on days 0, 5, and 9. *P < 0.05; **P < 0.01; ****P < 0.0001 by Tukey’s multiple comparison test. (O) Bar plot (top) and blots (bottom) showing the relative expression between phospho-IGF1R and total IGF1R after treatment with insulin-free adipogenic medium and 0, 0.1, 1, or 10 μM linsitinib on days 5 and 9. ****P < 0.0001 by Šidák’s multiple comparison test.

References

    1. Tanda ML, et al. Prevalence and natural history of Graves’ orbitopathy in a large series of patients with newly diagnosed graves’ hyperthyroidism seen at a single center. J Clin Endocrinol Metab. 2013;98(4):1443–1449. doi: 10.1210/jc.2012-3873. - DOI - PubMed
    1. Perros P, Kendall-Taylor P. Natural history of thyroid eye disease. Thyroid. 1998;8(5):423–425. doi: 10.1089/thy.1998.8.423. - DOI - PubMed
    1. Chin YH, et al. Prevalence of thyroid eye disease in Graves’ disease: a meta-analysis and systematic review. Clin Endocrinol (Oxf) 2020;93(4):363–374. doi: 10.1111/cen.14296. - DOI - PubMed
    1. Bartalena L, et al. Epidemiology, natural history, risk factors, and prevention of Graves’ orbitopathy. Front Endocrinol (Lausanne) 2020;11:615993. doi: 10.3389/fendo.2020.615993. - DOI - PMC - PubMed
    1. Bahn RS, et al. Thyrotropin receptor expression in Graves’ orbital adipose/connective tissues: potential autoantigen in Graves’ ophthalmopathy. J Clin Endocrinol Metab. 1998;83(3):998–1002. - PubMed

MeSH terms

LinkOut - more resources