Case Reports
. 2024 Dec 20;9(24):e173664.
doi: 10.1172/jci.insight.173664.

Talin1 dysfunction is genetically linked to systemic capillary leak syndrome

Affiliations
Case Reports

Talin1 dysfunction is genetically linked to systemic capillary leak syndrome

Naama Elefant et al. JCI Insight. .

Abstract

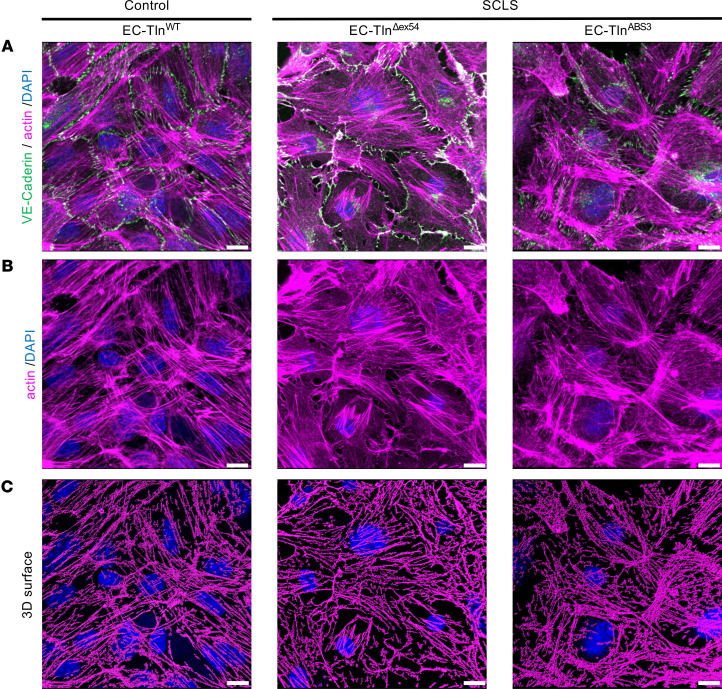
Systemic capillary leak syndrome (SCLS) is a rare life-threatening disorder due to profound vascular leak. The trigger and the cause of the disease are currently unknown and there is no specific treatment. Here, we identified a rare heterozygous splice-site variant in the TLN1 gene in a familial SCLS case, suggestive of autosomal dominant inheritance with incomplete penetrance. Talin1 has a key role in cell adhesion by activating and linking integrins to the actin cytoskeleton. This variant causes in-frame skipping of exon 54 and is predicted to affect talin's C-terminal actin-binding site (ABS3). Modeling the SCLS-TLN1 variant in TLN1-heterozygous endothelial cells (ECs) disturbed the endothelial barrier function. Similarly, mimicking the predicted actin-binding disruption in TLN1-heterozygous ECs resulted in disorganized endothelial adherens junctions. Mechanistically, we established that the SCLS-TLN1 variant, through the disruption of talin's ABS3, sequestrates talin's interacting partner, vinculin, at cell-extracellular matrix adhesions, leading to destabilization of the endothelial barrier. We propose that pathogenic variants in TLN1 underlie SCLS, providing insight into the molecular mechanism of the disease that can be explored for future therapeutic interventions.

Keywords: Cell biology; Cell migration/adhesion; Endothelial cells; Integrins; Vascular biology.


Figures

Figure 1
Figure 1. Pedigree of the familial case of SCLS and identification of an SCLS-TLN1 variant.
(A) Pedigree indicating affected individuals as black-filled shapes. Gray-filled shapes indicate individuals suspected to have been affected, where DNA was not available for testing. Diagonal black line indicates deceased (d. time of death). Black dots indicate nonsymptomatic individuals heterozygous for the SCLS variant. Numbers in diamond shapes indicate number of children. Inheritance was presumed to be autosomal dominant with incomplete penetrance. (B) Sanger sequencing at the DNA level, from 3 living patients (IV-3, III-6, and IV-11) showing heterozygous missense variant of splice site at exon 54 (c.7188+2T>C). (C) Quantitative real-time PCR analysis showing the fold difference in the mRNA expression of exon 54 between fibroblasts derived from the patient (IV-11) and the healthy relevant (III-17) normalized to the RPLP1 reference gene. Data shown are mean ± SEM, from 3 independent experiments. *P = 0.011 relative to WT values by unpaired, 2-tailed t test.
Figure 2
Figure 2. Structural analysis of the SCLS-TLN1 variant protein indicates a destabilized R13 domain.
(A) The domain structure of talin contains an N-terminal FERM domain and a large rod region consisting of 13 helical bundles, R1–R13, ending in a dimerization domain (DD). The 3 actin-binding sites (ABSs) are highlighted. The 11 vinculin-binding sites (VBSs) are shown in yellow. The R13 domain where the SCLS variant leads to deletion of 21 aa is highlighted. (B) The structure of WT R13 (left) and the predicted structural model of SCLS-R13 (right) connected by the DD. Sequence alignment of the WT (top) and SCLS (bottom) region of R13 containing the skipped exon (bottom). The KVK site (residues K2443/V2444/K2445) and the R2510 site that are required for actin binding are shown in orange and green, respectively. The 21 residues skipped in SCLS are shown in magenta. K2375 (red) and A2397 (blue) are the residues immediately before and after the skipped region. To highlight the distortion, the VBS helix at the back of the WT protein is shown in yellow; in SCLS, this helix is broken. (C and D) Circular dichroism (CD) analysis. (C) Far-UV spectral analysis (between 200 and 260 nm wavelengths) of 0.5 mg/mL WT-R12-R13-DD (blue) and SCLS-R12-R13-DD (red) at 20°C and at 90°C. (D) Melting curves at 222 nm for 0.5 mg/mL WT-R12-R13-DD (blue) and SCLS-R12-R13-DD (red), measuring thermal stability over increasing temperature from 20°C to 90°C.
Figure 3
Figure 3. Disruption of cell-cell junctions in SCLS-TLN1 mutant endothelial monolayers.
(A) Representative confocal 3D images of VE-cadherin (green) immunostained confluent monolayers of heterozygous-talin1 primary ECs transfected with full-length talin1 protein (EC-TlnWT) or SCLS-TLN1 mutant lacking the 21 aa of exon 54 (EC-TlnΔex54) or the talin1 ABS3 mutation, R2510A (EC-TlnABS3). Nuclei were stained with DAPI (blue). (B) Color scaling of VE-cadherin, whereby the red color is the highest continuous staining area (>70 μm2), decreasing to smaller areas marked by different colors until it reaches the lowest measurements, which are of blue-violet color (<30 μm2), analyzed by IMARIS. Scale bars: 10 μm. (C) Graph displays the quantification of the continuous junctional area, as represented by the percentage of staining surfaces greater than 30 μm2 versus the total staining area. Data represent the mean area per field of monolayer. n fields of view analyzed: EC-TlnWT = 27; EC-TlnΔex54 = 21; EC-TlnABS3 = 22. Red dots represent the mean ± SEM of 3 independent experiment. ****P < 0.0001 by 1-way ANOVA with Dunnett’s multiple-comparison test. (D) Graph displays the distribution of 3 different indexes of junctional fragments as a percentage of the total staining surfaces. Data represent the mean ± SEM of 3 independent experiments. n of field of views analyzed: EC-TlnWT = 25; EC-TlnΔex54 = 22; EC-TlnABS3 = 22.
Figure 4
Figure 4. Disruption of TJs in SCLS mutant endothelial monolayers.
(A) Representative confocal 3D images of ZO-1 (green) immunostained confluent monolayers of heterozygous-talin1 primary ECs transfected with full-length talin1 protein (EC-TlnWT) or SCLS-TLN1 mutant lacking the 21 aa of exon 54 (EC-TlnΔex54) or the talin1 ABS3 mutation, R2510A (EC-TlnABS3). Nuclei were stained with DAPI (blue). (B) Color scaling of the ZO-1 staining area, whereby the red color is the highest continuous staining area (>70 μm2), decreasing to smaller areas marked by different colors until it reaches the lowest measurements, which are of blue-violet color (<30 μm2), analyzed by IMARIS. Scale bars: 10 μm. (C) Graph displays the quantification of the continuous junctional area, as represented by the percentage of staining surfaces greater than 30 μm2 versus the total staining area. Data represent the mean area per field of view. n fields of view analyzed: EC-TlnWT = 13; EC-TlnΔex54 = 13, EC-TlnABS3 = 8. Red dots represent the mean ± SEM of 3 independent experiments. ***P = 0.0002, ****P < 0.0001 by 1-way ANOVA with Dunnett’s multiple-comparison test. (D) Graph displays the distribution of 3 different indexes of junctional fragments as a percentage of the total staining surfaces. Data represent the mean ± SEM of 3 independent experiments. n fields of view analyzed: EC-TlnWT = 14; EC-TlnΔex54 = 11, EC-TlnABS3 = 9.
Figure 5
Figure 5. Actin cytoskeleton is not severely affected in SCLS mutant endothelial monolayers.
(A) Representative confocal 3D images of VE-cadherin (green) and actin (magenta) immunostained confluent monolayers of heterozygous-talin1 primary ECs transfected with full-length talin1 protein (EC-TlnWT) or SCLS-TLN1 mutant lacking the 21 aa of exon 54 (EC-TlnΔex54) or the talin1 ABS3 mutation, R2510A (EC-TlnABS3). Nuclei were stained with DAPI (blue). (B) Single actin staining of the panels in A. (C) 3D surfaces of actin staining generated in IMARIS software. Scale bars: 10 μm. Representative images of 3 independent experiments performed with different primary EC populations.
Figure 6
Figure 6. SCLS-TLN1 mutation increases basal and agonist-induced endothelial permeability.
(A) Basal, (B) thrombin-induced, and (C) VEGF-induced leakage of FITC-dextran through full-length WT control talin1 (EC-TlnWT), SCLS-TLN1 mutant (EC-TlnΔex54), and talin1 ABS3 R2510A mutant (EC-TlnABS3) endothelial monolayers, as measured by the Transwell assay. (A) Scatter plots display the values of fluorescence intensity (arbitrary units) of at least 3 independent experiments. n EC-TlnWT = 4; n EC-TlnΔex54 = 4, n EC-TlnABS3 = 3. (B and C) Scatter plots display the fold increase over the basal permeability in each monolayer induced by (B) thrombin in at least 3 independent experiments or (C) VEGF in 2 independent experiments. *P = 0.0136; **P = 0.0034 (A); **P = 0.0043; **P = 0.0011 (B) by 1-way ANOVA with Dunnett’s multiple-comparison test. ns, no statistical significance (C). (DF) Representative confocal 3D images of VE-cadherin (green) immunostained confluent monolayers of heterozygous-talin1 primary ECs transfected with (D) EC-TlnWT or (E) EC-TlnΔex54 or (F) EC-TlnABS3. Nuclei were stained with DAPI (blue) Scale bars: 10 μm. (G) Graph displays the quantification of the continuous junctional VE-cadherin area, as represented by the percentage of staining surfaces greater than 30 μm2 versus the total staining area with and without VEGF stimulation. Data represent the mean area per monolayer. n = 6 fields of view analyzed. Red symbols represent the mean ± SEM of 2 independent experiments. *P < 0.02, **P < 0.002 by unpaired, 2-tailed t test.
Figure 7
Figure 7. Defective vinculin-dependent stabilization of AJs in SCLS-modeled endothelial monolayers.
(A) Representative confocal 3D images of VE-cadherin (green) and vinculin (magenta) immunostained confluent monolayers of heterozygous-talin1 ECs transfected with full-length talin 1 (EC-TlnWT), SCLS-TLN1 mutant lacking the 21 aa of exon 54 (EC-TlnΔex54), or the talin1 ABS3 mutation (EC-TlnABS3). Vinculin signal alone (magenta) and the colocalization signal of VE-cadherin/vinculin (white) are shown in the middle and bottom panels, respectively. Nuclei were stained with DAPI (blue). (B) Graph displays the quantification of the colocalization area of VE-cadherin and vinculin normalized to the number of nuclei present in each field of view. (C) Western blot analysis of total vinculin expression levels in control and SCLS-modeled ECs. HSC70 served as a loading control. (D) Graph displays the quantification of the percentage of vinculin colocalized with p-Y31-paxillin at dynamically remodeled adhesion sites. In all graphs, data represent the percentage mean colocalization area per image; n fields of view analyzed for B: EC-TlnWT = 21; EC-TlnABS3 = 11; EC-TlnΔex54 = 11 and for D: EC-TlnWT = 14; EC-TlnABS3 = 7; EC-TlnΔex54 = 7. Red symbols represent the mean ± SEM of 3 independent experiments for B and 2 independent experiments for D. ***P < 0.0003 (B) and *P = 0.0507; **P = 0.0085 (D) by 1-way ANOVA with Dunnett’s multiple-comparison test. Scale bars: 10 μm.
Figure 8
Figure 8. Schematic model of how the SCLS-TLN1 mutation affects endothelial barrier function.
In WT ECs, vinculin is dynamically distributed between both cell-ECM and cell-cell adhesions to regulate their dynamics. In SCLS-TLN1 mutant ECs with heterozygous disruption of talin1 R13 domain, the vinculin localization at adherens junctions is severely impaired, leading to defective endothelial barrier function. The disorganization of adherens junctions observed in the SCLS-TLN1 ECs is reproduced by a talin1 mutant with defective ABS3 binding to actin. Therefore, we propose that the SCLS-TLN1 mutant destabilizes endothelial adherens junctions by perturbing the force loading on talin. This in turn results in sequestering of vinculin at cell-ECM adhesions, depleting it from adherens junctions, which leads to defective remodeling of the cell-cell junctions.

References

    1. Clarkson B, et al. Cyclical edema and shock due to increased capillary permeability. Trans Assoc Am Physicians. 1960;73(2):272–282. - PubMed
    1. Marks J, Shuster S. Disorders of capillary permeability. Br J Dermatol. 1973;88(6):619–621. doi: 10.1111/j.1365-2133.1973.tb08029.x. - DOI - PubMed
    1. Amoura Z, et al. Systemic capillary leak syndrome: report on 13 patients with special focus on course and treatment. Am J Med. 1997;103(6):514–519. doi: 10.1016/S0002-9343(97)00272-6. - DOI - PubMed
    1. Eo TS, et al. Clinical presentation, management, and prognostic factors of idiopathic systemic capillary leak syndrome: a systematic review. J Allergy Clin Immunol Pract. 2018;6(2):609–618. doi: 10.1016/j.jaip.2017.07.021. - DOI - PubMed
    1. Xie Z, et al. High-dose intravenous immunoglobulin therapy for systemic capillary leak syndrome (Clarkson disease) Am J Med. 2015;128(1):91–95. doi: 10.1016/j.amjmed.2014.08.015. - DOI - PMC - PubMed

Publication types