. 2025 Jun 3;15(6):1180-1202.
doi: 10.1158/2159-8290.CD-24-1366.

Multimodal Spatial Profiling Reveals Immune Suppression and Microenvironment Remodeling in Fallopian Tube Precursors to High-Grade Serous Ovarian Carcinoma

Affiliations

Multimodal Spatial Profiling Reveals Immune Suppression and Microenvironment Remodeling in Fallopian Tube Precursors to High-Grade Serous Ovarian Carcinoma

Tanjina Kader et al. Cancer Discov. .

Abstract

High-grade serous ovarian cancer (HGSOC) originates from fallopian tube (FT) precursors. However, the molecular changes that occur as precancerous lesions progress to HGSOC are not well understood. To address this, we integrated high-plex imaging and spatial transcriptomics to analyze human tissue samples at different stages of HGSOC development, including p53 signatures, serous tubal intraepithelial carcinomas (STIC), and invasive HGSOC. Our findings reveal immune modulating mechanisms within precursor epithelium, characterized by chromosomal instability, persistent IFN signaling, and dysregulated innate and adaptive immunity. FT precursors display elevated expression of MHC class I, including HLA-E, and IFN-stimulated genes, typically linked to later-stage tumorigenesis. These molecular alterations coincide with progressive shifts in the tumor microenvironment, transitioning from immune surveillance in early STICs to immune suppression in advanced STICs and cancer. These insights identify potential biomarkers and therapeutic targets for HGSOC interception and clarify the molecular transitions from precancer to cancer.

Significance: This study maps the immune response in FT precursors of HGSOC, highlighting localized IFN signaling, chromosomal instability, and competing immune surveillance and suppression along the progression axis. It provides an explorable public spatial profiling atlas for investigating precancer mechanisms, biomarkers, and early detection and interception strategies. See related commentary by Recouvreux and Orsulic, p. 1093.


Conflict of interest statement

Y.-A. Chen is a consultant for RareCyte. J.R. Heath reports grants from the NCI, Andy Hill Care Fund, and the Paul Allen Foundation during the conduct of the study, as well as nonfinancial support from AtlasXomics outside the submitted work. C.W. Drescher reports grants from the Gray Foundation and Canary Foundation during the conduct of the study. P.K. Sorger reports grants and personal fees from RareCyte Inc., personal fees from Glencoe Inc., and personal fees from NanoString/Bruker during the conduct of the study, as well as personal fees from Merck and Montai Inc. outside the submitted work. R. Drapkin reports personal fees from Repare Therapeutics outside the submitted work. S. Santagata reports personal fees from Roche and Novartis and grants from Merck outside the submitted work. No disclosures were reported by the other authors.

Figures
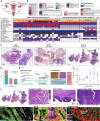
Figure 1.
Figure 1.
Overview of the patient cohort and experimental design. A, Schematic of the female reproductive tract highlighting the FT, its distal fimbriated end, and the ovary. It is now generally accepted that HGSOCs arise from secretory cells located at the distal fimbriated end of the FT. B, Summary of clinical annotations for the 43-patient cohort. A total of 44 specimens were analyzed by tissue CyCIF and 35 specimens by spatial transcriptomics (GeoMx; NanoString). The annotations include lesion types (histology), HGSOC stage, BRCA mutation status, ovarian involvement, metastasis, neoadjuvant chemotherapy, patient demographics, and whether lesions were lost in subsequent H&E sections (N/Av). Additional details are provided in Supplementary Table S1. C, Representative H&E images showing labeled examples from each subgroup: p53.I, STIC.I, and STIC.C. D, A stacked bar plot comparing the number of BRCA mutant (Mut) and WT cases between incidental and cancer-associated precancer lesions; **, P < 0.01, Fisher’s exact test. E, Experimental design illustrating the integration of multiplex tissue imaging (CyCIF) and spatial transcriptomics (GeoMx), from adjacent 5-μm sections, guided by histology. GeoMx ROIs were registered with CyCIF images using X/Y coordinates (see Supplementary Fig. S2 and “Methods”). The CyCIF panel included 31 antibodies, some of which (indicated with asterisks) were only used on a subset of the specimens (n = 26/44). High-resolution 3D CyCIF was performed for one STIC.C case (patient ID 9, case RD-23-002), shown in F. F, Example of STIC with concurrent HGSOC (case RD-23-002, patient ID 9, BRCA2 mutant, stage IC HGSOC). H&E images (top row) show the different histologies present: normal FT (FT.C), STIC.C, and invasive cancer. Selected CyCIF markers (bottom row) illustrate mutant p53 expression in epithelial cells (PanCK+) within the lesional regions. The adjacent stroma lacks PanCK expression (PanCK). G, Box plot comparing p53 intensity (in relative fluorescence units) measured by CyCIF in the epithelial compartment across various disease stages. The Y-axis is on a log10 scale. Sample sizes were as follows: FT.I (n = 13), Fim.I (n = 15), p53.I (n = 10), STIC.I (n = 9), STIC.C (n = 23), and cancer (n = 20). The median is indicated by a horizontal solid line, and whiskers extend to 1.5× the IQR. Outliers are shown as individual points. Black asterisks indicate significant differences from FT.I determined by LMMs with patient ID as a random effect (**, P < 0.01; ****, P < 0.0001) using the lme4 R package (version 4.3.3). PanCK, pan-cytokeratin, DAPI, 4’,6-diamidino-2-phenylindole. (A and E, Created with BioRender.com.)
Figure 2.
Figure 2.
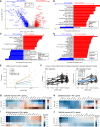
Molecular transitions during HGSOC development using spatial transcriptomics. A, We examined differential gene expression in epithelial compartments between p53.I (n = 39 ROIs) and STIC.I (n = 27 ROIs) using a LMM. The model included lesion type as a fixed effect and scan_ID (representing patient/slide ID) as a random intercept. Benjamini–Hochberg correction was applied using GeoMx DSP software (NanoString, version 3.1.0.221). The model formula was as follows: gene expression ∼ lesion_type + (1|scan_ID). Only a subset of differentially expressed genes is shown. B–D, GSEA was performed on differentially expressed genes in the epithelial compartment using GeoMx DSP software. Using MsigDB Cancer Hallmark gene sets, we identified pathways associated with disease progression in three comparisons: (B) p53.I (n = 39 ROIs) vs. STIC.I (n = 27 ROIs), showing enrichment of IFN and proliferative pathways; (C) STIC.I (n = 27 ROIs) vs. STIC.C (n = 96 ROIs), highlighting EMT, TGF-β, and hypoxia pathways; and (D) STIC.C (n = 96 ROIs) vs. invasive carcinoma (n = 105 ROIs), associated with angiogenesis and Hedgehog signaling. Pathway are ranked by adjusted P values <0.05. EJ, Because LMMs and GSEA are limited to pairwise comparisons, we applied Bayesian regression modeling to analyze the full progression from normal FT to cancer. Bayesian models are advantageous because they account for repeated sampling from the same patient. E, A synthetic example illustrates how repeated samples from a single patient (patient 1) can skew the mean effect if patient variability is not considered. LMMs address this by incorporating patient-level random effects. F, We further advanced the approach with Bayesian ordinal regression to model gene expression across multiple disease stages, using MCL1 as an example. In contrast to LMMs in GeoMx DSP software – which only support pairwise comparisons with a single random effect – Bayesian ordinal regression can handle multiple disease stages simultaneously. We used the “brms” R package and imposed a monotonic constraint (mo) to represent orderly lesion progression (44). GeoMx expression counts were Q3-normalized for sequencing depth (see “Methods”) and then log-transformed to stabilize variance. To standardize across genes (thus accounting for gene expression variability), we z-transformed these values to a mean of zero and variance of one. For each gene, we fitted the model: gene_expression ∼ mo(stage) + [1 + mo(stage)|patient_id]. Here, the monotonic constraint ensures ordered progression (44), and patient-specific effects are modeled through random intercepts and stage coefficients. For gene set analyses, additional random effects were included: gene_expression ∼ mo(stage) + [1 + mo(stage)|patient_id * gene] (see “Methods” for further details). G–J, To investigate IFN pathway changes from normal FT to STIC (incidental or cancer-associated) and then to carcinoma, we used the Bayesian ordinal regression model to identify IFN hallmark genes. This approach compares relative gene expression changes in both the epithelial and stromal compartments across disease stages relative to their matched FT. The heatmaps illustrate normalized gene expression in the epithelium for IFNα and IFNγ responses: (G) IFNα and (H) IFNγ in the incidental group vs. matched FT.I; (I) IFNα and (J) IFNγ in the cancer group vs. matched FT.C. The early upregulation of key IFNα– and IFNγ–induced genes such as STAT1, ISG15, IFITM1, IRF7, IRF9, and HLA-A at the p53.I stage, relative to matched FT.I, indicated early IFN pathway activation in HGSOC progression. In the heatmaps, columns represent individual genes and rows represent lesion types. Values show the median of the posterior distribution from the Bayesian analysis. Significance was determined based on the highest density interval relative to the region of practical equivalence (0.05 times the SD). Comparisons with >95% of the highest density interval outside the region of practical equivalence were significant (*), and >99% were very significant (**; ref. 111).
Figure 3.
Figure 3.
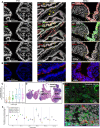
Multiplexed tissue imaging revealed spatially coordinated IFN in HGSOC progression. A, CyCIF images highlight markers indicating downstream IFN pathway activation, including of MHC class I (HLA-A and HLA-E) and phosphorylated STAT3 (p-STAT3), in both p53.I and STIC.I lesions. The representative STIC.I images are shown with the matched FT.I region from the same patient [case CD302.04(939), patient ID 40, BRCA WT], whereas the p53.I image is from a different patient [case C21-22 patient ID 28, BRCA1 mutant (Mut)]. Yellow arrows in the p53.I image indicate the epithelial cell layer exhibiting a “p53 signature.” B, CyCIF images show that phosphorylated TBK1 (p-TBK1) appears as cytosolic, punctate signals in the same regions in which HLA-A, HLA-E, and p-STAT3 are expressed. The FT.I, p53.I, and STIC.I areas are identical to those in A, with ROIs for p53.I and STIC.I indicated by yellow boxes in A. The coexpression of these markers suggests that p-TBK1 signaling may be an upstream event driving IFN pathway activation. C, A box plot illustrates the increasing percentage of epithelial cells expressing IFN activation–associated markers (p-TBK1+/p-STAT1+/HLA-E+/p-STAT3+) as disease progresses. The sample sizes per lesion type are as follows: FT.I (n = 13), Fim.I (n = 15), p53.I (n = 10), STIC.I (n = 9), STIC.C (n = 23), and cancer (n = 20). The median is represented by a solid line, with whiskers extending to 1.5 times the IQR. Statistically significant differences compared with FT.I are indicated by asterisks; **, P < 0.001; ****, P < 0.0001. Binomial generalized LMM with patient ID as random effect were used. The model formula was cbind(n_success, n_failure) ∼ stage + (1 + stage|patient_id) using the lme4 R package (version 4.3.3). Summary statistics are in Supplementary Tables S5 and S6. D, H&E image of a whole-slide specimen (case RD-23-002, patient ID 9, BRCA2 mutant, stage IC HGSOC) indicating the ROIs used in E. This specimen, also shown in Fig. 1F, contains all histologic elements described and was used in high-resolution 3D CyCIF performed on a thicker section from the same block. Figure 1F (H&E) and Figs. 3D and 4B (3D CyCIF H&E) show the same H&E-stained section to provide orientation in different imaging contexts. E, A 3D CyCIF reconstruction of a STIC with concurrent HGSOC (patient ID 9, ROIs from D). MX1, an IFN-induced gene, shows punctate expression and is coexpressed with PanCK and HLA-A, indicating IFN activation in both tumor and STIC.C epithelial cells. F, A plot showing the OR for coexpression of various protein pairs (p-STAT1+ HLA-E+ or p-STAT1+ p-TBK1+ or p-STAT1+ p-STAT3+ or p-TBK1+ HLA-E+) across different disease stages. OR > 1 indicates increased likelihood of coexpression, whereas an OR < 1 indicates decreased likelihood. The Y-axis is on a log10 scale. Single cells were classified as positive or negative for each marker, and contingency tables were constructed to compute ORs using generalized LMMs. All lesion types demonstrated significant marker coexpression (P < 0.001). Fisher exact tests yielded comparable ORs. See Supplementary Tables S5 and S6 for summary statistics. PanCK, pan-cytokeratin.
Figure 4.
Figure 4.
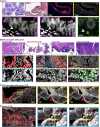
Tissue imaging reveals micronuclear rupture and cGAS recruitment in HGSOC progression. A, Top, An H&E image of a representative STIC.I case [CD302.03(706), patient ID 38, BRCA1 mutant (Mut)], with ROIs indicated. Within the STIC region outlined by a purple box, CyCIF imaging shows TP53-positive epithelial cells containing BAF staining. Bottom, Colocalization of BAF signal with DNA (DAPI) marks a ruptured micronucleus (MN; white arrowheads). A higher magnification view (outlined by a green box) confirms the colocalization of cGAS at BAF-positive MN, suggesting that cGAS binds to DNA from the ruptured MN. B, Top, H&E images of a representative STIC with concurrent HGSOC (case RD-23-002, patient ID 9, BRCA2 mutant, stage IC HGSOC), previously shown in Figs. 1F and 3D, highlighting ROIs representing different histologies. A cyan box on the STIC.C H&E and a green box on the invasive tumor H&E indicate ROIs for panels below. Bottom, CyCIF images from the STIC.C region (left column) reveal BAF-positive MN (red arrowheads). Corresponding CyCIF images from the invasive cancer region (right columns) demonstrate an increased number of in BAF+ cGAS+ or BAF+ γ-H2Ax+ MN (yellow arrowheads), indicating more frequent MN rupture events in invasive disease. C and D, The same specimen from B was imaged using 3D confocal multiplexed imaging to confirm both intact and ruptured MN. C, A 3D reconstruction and surface rendering of a 20-μm-thick section confirms colocalization of BAF+ and cGAS+ in MN, as well as BAF+ and γ-H2Ax+ in MN in STIC.C (red arrowheads, yellow box). D, In the invasive cancer region, 3D multiplexed imaging revealed BAF+ γ-H2Ax+ MN rupture events (yellow arrowheads, cyan box). The colocalization of cGAS with BAF-positive MN suggests that cGAS recognizes DNA from ruptured MN.
Figure 5.
Figure 5.
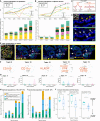
Immune composition analysis suggests active immune surveillance by activated antigen presenting cells at early HGSOC progression. A and B, Top, Line plots show changes in the proportions of major immune cell types across disease stages, based on single-cell CyCIF data. A, Epithelium and (B) adjacent stroma. The Y-axis shows Odds Ratios (ORs) relative to FT.I on a log scale, calculated using binomial GLMMs, with patient ID and observation-level random effects. P values are adjusted using the Benjamini–Hochberg procedure. Bottom, Stacked bar plots represent the average proportion of major immune cell types disease stages in the epithelium (A) and adjacent stroma (B). Asterisks on bars indicate significant differences vs. FT.I; asterisks between bars (dashed lines) indicate significant inter-stage differences. *, P < 0.05; **, P < 0.01. Average proportions were rounded up to the next whole number when applicable and shown for each cell type across lesion types. Sample sizes: FT.I (n = 13), Fim.I (n = 15), p53.I (n = 10), STIC.I (n = 9), STIC.C (n = 23), and cancer (n = 20). C, Schematic illustrating subsets of CD11c+ cells identified by CyCIF, including cDC1, and other APCs. Activated APCs are characterized by HLA-DR+ expression (MHC class II), marking an initial step of APC activation. D, CyCIF image from a representative p53.I case [also shown in Fig. 3A; case C21-22 patient ID 28, BRCA1 mutant (Mut)] highlights an epithelial region with “p53 signature” (green box). This region contains activated APCs, including cDC1 (yellow arrows) and other DCs (white arrows), identified by CD40+ CD11c+ staining. E, CyCIF image from a STIC.I case [CD302.03(706), patient ID 38, BRCA1 mutant (Mut)]. The yellow box marks an area of activated APCs, including cDC1 (yellow arrow) and other DCs (white arrows) in the stroma adjacent to the STIC.I epithelium. Pan-cytokeratin (PanCK) and TP53 staining highlight the epithelial cells. F, LDA neighborhood analysis applied to multiplex tissue imaging. Frequencies from all incidental and cancer samples were pooled to train the LDA model. Each “topic” represents a cellular neighborhood defined by distinct immune cell types and states. Font size reflects prevalence in LDA components. Detailed topic descriptions are in Supplementary Table S5. G, Box plots depicting the percentage of cells in each LDA topic across STIC.I, STIC.C, and cancer stages. The number of specimens for each lesion is as follows: STIC.I (n = 9), STIC.C (n = 23), and cancer (n = 20). Significant differences are indicated by asterisks; **, P < 0.01; ****, P < 0.0001 using generalized LMMs with patient ID as a random effect. H, Stacked bar plot of the average proportion of HLA-DR+ APC subsets within the total CD11c+ population in the epithelium across lesion types. I, Similar plot for the adjacent stroma. H and I, Proportions are rounded to the nearest whole number where applicable. Number of specimens per group as follows: FT.I (n = 13), Fim.I (n = 15), p53.I (n = 10), STIC.I (n = 9), STIC.C (n = 23), and cancer (n = 20). Asterisks indicate significant differences from FT.I or between groups. *, P < 0.05; ****, P < 0.0001, using binomial generalized LMMs with patient ID as a random effect. J, Box plots illustrating normalized interaction strength (on a log10 scale) between cell types in STIC.I and STIC.C: (i) cDC1 and CD4+ PD1+ T cells, (ii) HLA-DR+ CD68+ APCs with CD4+ CD8+ PD-1+ T cells, and (iii) HLA-DR+ APCs with CD8+ PD-1+ T cells. Scores >1 indicate stronger interactions in STIC.C vs. STIC.I. Significance is indicated by asterisks; *, P < 0.05, Wilcoxon rank-sum test.
Figure 6.
Figure 6.
Immune editing and T-cell dysfunction at early stage of HGSOC development. A and B, Stacked bar plots summarize CD8+ T-cell subtypes identified by CyCIF across disease stages in the epithelium (A) and in the adjacent stroma (B). Subtypes include TRM cells (CD8+ CD103+ CD45RO+) and cytotoxic T cells (CTLs; CD8+ CD103). Sample sizes: FT.I (n = 13), Fim.I (n = 15), p53.I (n = 10), STIC.I (n = 9), STIC.C (n = 23), and cancer (n = 20). Black asterisks show significant differences vs. FT.I, whereas colored dashed lines with asterisks indicate significant intergroup comparisons; *, P < 0.05; **, P < 0.01, determined by binomial generalized LMMs with patient ID and observational level random effect. C and D, Stacked bar plots showing the proportion of CD8+ T-cell states within total CD8 T cells in the epithelium (C) and the adjacent stroma (D). T-cell states are defined as activated (Ki67/PD-1+ and LAG3) and exhausted (PD-1+LAG3+ or LAG3+). Same specimen counts as above. Significance levels from FT.I are marked by black asterisks stages; *, P < 0.05; ***, P < 0.001; ****, P < 0.0001, using binomial generalized LMMs. Colored dashed lines indicate significant intergroup comparisons. E, CyCIF images from a representative FT.I case matched to STIC.I [case CD302.04(939), patient ID 40, BRCA WT; also shown in Fig. 3A]. A TRM cell (CD8+ CD103+ CD45RO+) is indicated by a yellow arrow. F, CyCIF image from a representative p53.I case [case C21-22 patient ID 28, BRCA1 mutant (Mut); also shown in Fig. 3A]. The red box marks a “p53 signature” – TRM (yellow arrows) and CD8+ CD103– CTL (orange arrow) are seen at higher magnification. Different markers from the same specimen are shown in multiple figures, enabling direct comparisons. G and H, CyCIF images from another p53.I case (C21-80, patient ID 35, BRCA2 Mut), displaying TRM (white arrows) coexpressing PD-1 (yellow arrows). I and J, CyCIF images from a representative STIC.I case, also shown in Fig. 5E [CD302.03(706), patient ID 38, BRCA1 Mut], showing CTL (magenta arrows) and TRM (yellow arrows) within the stroma. K, CyCIF image of the same ROI as in J, illustrating T-cell exhaustion in STIC.I. PD-1 (orange arrows) and LAG3 (punctate expression) colocalize on CTL (white arrows) and TRM (gray arrows). The inset provides a magnified view of the gray ROI for LAG3+ T cells. L, CyCIF image of the same STIC.I ROI indicated as in I and J showing a proliferative CD8+ T cell (CD8+ Ki67+ GZMB; orange arrow). M and N, CyCIF images from another STIC.I case [CD302.04(939), patient ID 40, BRCA WT, also shown in Fig. 3A], highlighting TP53-positive epithelium (M) and TRM cells in the STIC.I epithelium (N; yellow arrows). O, CyCIF images of same ROI as in N, showing exhausted intra-epithelial TRM in STIC.I, coexpressing PD-1 and LAG3 (yellow arrows). P and Q, Heatmaps showing normalized gene expression related to various T-cell states (naïve, dysfunctional, and memory) in the stroma from the cancer group (P) and stroma from incidental group. (Q) Genes include HAVCR2 (encoding TIM3), CTLA4, PDCD1 (PD-1), ITGAE (CD103), TCF7 (TCF1), and CD274 (PD-L1). Rows represent lesion stages, and columns represent genes. Asterisks indicate significant changes from baseline stages (p53.C in P and FT.I in Q) based on an ordinal Bayesian modeling. Significance is defined by the proportion of the posterior highest density interval outside the region of practical equivalence (*>95%, **>99%). These findings underscore the early emergence of T-cell dysfunction and immune editing in HGSOC precursors such as STIC.I.
Figure 7.
Figure 7.
Evolution of the precancer ecosystem during HGSOC progression. A, A lollipop plot illustrates the relative differences in major immune cell types and states between STIC.I and STIC.C in both epithelial and stromal regions. The fold difference is computed as the ratio of the average proportion of each cell state in STIC.C compared with STIC.I. A value of 1 indicates no change, values >1 signify an increased prevalence in STIC.C, and values <1 indicate a higher prevalence in STIC.I. B, Schematic representation of HGSOC progression, emphasizing the temporal development of hallmark cancer features and the dynamic interplay and interactions between immune cells and precancer/cancer cells. Cancer often starts with oncogenic changes (mutations, aneuploidy, and other cancer hallmarks) under selective pressure. These cells may remain latent for decades. Only a subset of these “phenotypically normal” but mutated clones undergo clonal expansion and acquire additional mutations, ultimately developing into cancer. Early on, despite limited genomic instability, innate immune responses, including the NK–cDC1–CTL axis and TRM cells, help contain p53 signature cells. Increasing aneuploidy or extrinsic factors can enhance immune surveillance, potentially eliminating precancer clones before significant proliferation occurs. During early STIC expansion, there is pronounced IFN response activation, with activated cDC1 and APCs and NK cell–secreted chemokines, further attracting cDC1. This environment suggests active immune surveillance and is accompanied by interactions among APCs, activated CD4+, and CD8+ T cells. However, immunosuppressive cells, such as M2-like macrophages and Tregs, also emerge, indicating a complex equilibrium in which cytotoxic and suppressive forces coexist. As STIC lesions advance, there is a reduction in CD8+ T cells and the interactions between APCs and CD4+ T cells, along with an increase in exhausted CD8+ CTL and CD4+ cells expressing LAG3, almost no NK and cDC1 cells, and more suppressive APCs. The transition from STIC to overt cancer involves hallmark mechanisms such as TGF-β signaling, which excludes CTLs, changes in cytokine and fibroblast profiles, and induction of EMT and migratory programs. Dotted arrows indicate the hypothetical timing of these events, suggesting a prolonged interval from p53 signature to early STIC, followed by a more rapid progression from early to late STIC. (Created with BioRender.com.)

Update of

References

    1. Bray F, Laversanne M, Sung H, Ferlay J, Siegel RL, Soerjomataram I, et al. . Global cancer statistics 2022: GLOBOCAN estimates of incidence and mortality worldwide for 36 cancers in 185 countries. CA Cancer J Clin 2024;74:229–63. - PubMed
    1. Kroeger PT Jr, Drapkin R. Pathogenesis and heterogeneity of ovarian cancer. Curr Opin Obstet Gynecol 2017;29:26–34. - PMC - PubMed
    1. Bowtell DD, Böhm S, Ahmed AA, Aspuria P-J, Bast RC Jr, Beral V, et al. . Rethinking ovarian cancer II: reducing mortality from high-grade serous ovarian cancer. Nat Rev Cancer 2015;15:668–79. - PMC - PubMed
    1. Lee Y, Miron A, Drapkin R, Nucci MR, Medeiros F, Saleemuddin A, et al. . A candidate precursor to serous carcinoma that originates in the distal fallopian tube. J Pathol 2007;211:26–35. - PubMed
    1. Medeiros F, Muto MG, Lee Y, Elvin JA, Callahan MJ, Feltmate C, et al. . The tubal fimbria is a preferred site for early adenocarcinoma in women with familial ovarian cancer syndrome. Am J Surg Pathol 2006;30:230–6. - PubMed

MeSH terms

Substances