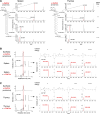
. 2025 Feb 3;222(2):e20240728.
doi: 10.1084/jem.20240728. Epub 2024 Dec 20.

Identification of α-galactosylceramide as an endogenous mammalian antigen for iNKT cells

Affiliations

Identification of α-galactosylceramide as an endogenous mammalian antigen for iNKT cells

Yuki Hosono et al. J Exp Med. .

Abstract

Invariant natural killer T (iNKT) cells are unconventional T cells recognizing lipid antigens in a CD1d-restricted manner. Among these lipid antigens, α-galactosylceramide (α-GalCer), which was originally identified in marine sponges, is the most potent antigen. Although the presence of α-anomeric hexosylceramide and microbiota-derived branched α-GalCer is reported, antigenic α-GalCer has not been identified in mammals. Here, we developed a high-resolution separation and detection system, supercritical fluid chromatography tandem mass spectrometry (SFC/MS/MS), that can discriminate hexosylceramide diastereomers (α-GalCer, α-GlcCer, β-GalCer, or β-GlcCer). The B16 melanoma tumor cell line does not activate iNKT cells; however, ectopic expression of CD1d was sufficient to activate iNKT cells without adding antigens. B16 melanoma was unlikely to generate iNKT cell antigens; instead, antigen activity was detected in cell culture serum. Activity-based purification and SFC/MS/MS identified dihydrosphingosine-based saturated α-GalCer as an antigenic component in serum, bile, and lymphoid tissues. These results show the first evidence for the presence of potent antigenic α-GalCer in mammals.


Conflict of interest statement

Disclosures: The authors declare no competing interests exist.

Figures
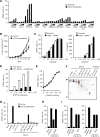
Figure 1.
Figure 1.
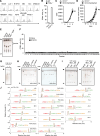
Serum contains antigens for iNKT cells. (A) DN32.D3 cells were co-cultured with 5.5 × 10², 1.66 × 10³, 5.0 × 10³ and 1.5 × 10⁴ parental or CD1d-transduced MC38, LLC1, B16F10, 2B4, EL4, DN32.D3, HEK293T, HeLa, A549, MDA-MB-231, and PANC-1 cells for 16 h and analyzed for CD69 expression. (B) 5 × 10⁵ CD1d−/− or CD1d-transduced B16F10 cells were injected subcutaneously into the right flank of C57BL/6J mice (n = 8). Tumor volume was measured every 3–4 days. (C) DN32.D3 cells were co-cultured with the indicated cell number of WT or Ugcg−/− Ugt8a−/− CD1d-transduced B16F10 cells for 16 h and analyzed as in A (left). Concentrations of IL-2 in the supernatants were measured (right). (D) CD1d-transduced B16F10 cells were cultured in RPMI 1640 supplemented with 10% FCS or in RPMI 1640 with 0.6% FCS and 9.4% animal component-free cell culture supplement for 7 days. DN32.D3 cells were then co-cultured with those B16F10 cells for 16 h and analyzed as in A. (E) DN32.D3 cells were co-cultured with CD1d-transduced B16F10 cells that were cultured in RPMI 1640 supplemented with 0.6% FCS and 9.4% animal component-free cell culture supplement for 7 days as in D in the absence or presence of α-GalCer (t18:0/26:0) (KRN7000) for 16 h and analyzed as in A. (F) Lipids extracted from serum were separated into seven fractions by open column chromatography and analyzed by HPTLC using C:M:W (65:25:4; vol/vol/vol) followed by staining with copper acetate reagent. Commercial β-GlcCer was used as a reference (right lanes). Open and closed arrowheads denote the origin and solvent front, respectively. (G) CD1d−/− or CD1d-transduced DN32.D3 cells were stimulated with each fraction separated from serum lipids in F for 16 h and analyzed as in A. α-GalCer (t18:0/26:0) was used as a positive control. (H) CD1d-transduced DN32.D3 cells were stimulated with the C:M = 19:1 fraction of serum lipids with or without hydrolysis treatment for 16 h and analyzed as in A. α-GalCer (t18:0/26:0) was used as a positive control. (I) CD1d-transduced DN32.D3 cells were stimulated with the C:M = 19:1 fraction of serum lipids treated with Gba (left) or Galc (right) for 16 h and analyzed as in A. α-GalCer (t18:0/26:0) was used as a positive control. Data are presented as mean ± SD (A–E and G–I) and are representative of three independent experiments (A–I). Statistical significance was determined by Student’s t test. *, P < 0.05. Source data are available for this figure: SourceData F1.
Figure S1.
Figure S1.
Serum contains antigens for iNKT cells. (A) Surface expression of CD1d on CD1d-transduced cell lines. Filled histogram, anti-mouse CD1d antibody; open histogram, isotype control antibody. (B) WT or TCRα−/− DN32.D3 cells were co-cultured with CD1d-transduced B16F10 cells for 16 h and analyzed for CD69 expression. (C) CD1d−/− or CD1d-transduced B16F10 cells were seeded onto 24-well plates. Growth curves were generated using cell counting by flow cytometer every 24 h. (D) 5 × 10⁵ CD1d−/− or CD1d-transduced B16F10 cells were injected subcutaneously into the right flank of Jα18-deficient mice (n = 7). Tumor volume was measured every 3–4 days. (E) The crude lipids extracted from WT, Ugcg−/−, Ugt8a−/−, and Ugcg−/− Ugt8a−/− B16F10 cells were analyzed by HPTLC using C:M:W (65:25:4; vol/vol/vol) and stained with copper acetate reagent. (F) Lipid extracts from B16F10 cells (5 × 10⁶) were separated into 84 fractions in a 96-well plate by LC-FRC system and evaporated. DN32.D3 cells were stimulated in the 96-well plate for 16 h and analyzed for CD69 expression. Fractionation was performed in triplicate. (G) The C:M = 19:1 fraction of serum lipids before and after hydrolysis treatment was analyzed by HPTLC as in E. (H) Commercial α- and β-GalCer (d18:1/16:0) (left) and α- and β-GalCer (d18:1/24:1) (right) were treated with Galc and analyzed by HPTLC as in E. (I) The C:M = 19:1 fraction of serum lipids and commercial β-GlcCer or β-GalCer were treated with Gba (left) or Galc (right) and analyzed by HPTLC as in E. (J) Screening of columns to separate three diastereomers of synthesized HexCer (d18:1/16:0). MRM chromatograms of SFC/MRM analysis using the columns in Table S1 are shown. The MRM transition was set to 700.57 > 264.27 (precursor ions selected as [M+H]+). The SFC analysis conditions for 1-AA, 2-PC, BEH 2-EP, BEH, DEA, Diol, P4VP (PEEK), and PTZ (PEEK) (left) were as follows: column temperature, 50°C; mobile phase A, supercritical carbon dioxide; mobile phase B, M:W (95:5, vol/vol) with 0.1% (wt/vol) ammonium acetate; flow rate of mobile phase, 1.0 ml min−1; flow rate of make-up pump, 0.1 ml min−1; back-pressure regulator, 10 MPa. The gradient conditions were as follows: 1% B, 0–1 min; 1–75% B, 1–24 min; 75% B, 24–26 min; and 1% B, 26–30 min. The SFC analytical conditions for other columns (center and right) were as described above with modification as follows: column temperature, 40°C; gradient conditions, 1% B, 0–1 min; 1–50% B, 1–17 min; 50% B, 17–26 min; and 1% B, 26–30 min. The MRM operating conditions were identical to those of the SFC/MRM analysis method. The colored shadows indicate the peaks coincident with the RT of synthesized α-GalCer (red), α-GlcCer (blue), β-GlcCer (green), and β-GalCer (yellow), respectively. Open and close arrowheads denote the origin and solvent front, respectively (E and G–I). Data are presented as mean ± SD (B–D and F) and are representative of three independent experiments (B–E and G–J). Statistical significance was determined by Student’s t test (C and D). NS, not significant. Source data are available for this figure: SourceData FS1.
Figure 2.
Figure 2.
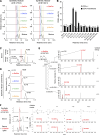
Separation of HexCer diastereomers. (A) MRM chromatograms of the synthesized four diastereomers of HexCer (d18:1/16:0) and (d18:1/24:1) were obtained using SFC/MRM. SFC separated the four diastereomers according to their RTs even when mixed (bottom). MRM transitions were 700.57 > 264.27 for HexCer (d18:1/16:0) and 810.68 > 264.27 for HexCer (d18:1/24:1), (precursor ions were selected as [M+H]+). The colored shadows indicate the peaks coincident with the RT of synthesized α-GalCer (red), α-GlcCer (blue), β-GalCer (green), and β-GlcCer (yellow), respectively. (B) CD1d−/− or CD1d-expressing DN32.D3 cells were stimulated with the C:M = 19:1 SFC-FRC separated fractions from serum lipids for 16 h and analyzed for CD69 expression. The C:M = 19:1 fraction (10 μg) of serum lipids was separated using SFC, and 1/25th of the product was used for 9.5–13.5 min subfractions and 1/75th of the product was used for the other four sub-fractions (0–9.5 [#1], 13.5–24 [#2], 24–34.5 [#3] and 34.5–45 min [#4]) (Fig. S2 A). (C) HRMS chromatogram of HexCer (d18:0/16:0) in serum. The colored shadows indicate the peaks coincident with the estimated RT of α-GalCer (d18:0/16:0) (red) and β-GlcCer (d18:0/16:0) (yellow), respectively. (D) HRMS-EIC chromatograms of the synthesized four diastereomers of HexCer (d18:0/16:0) obtained using SFC/HRMS. SFC separated the four diastereomers according to their RTs. The red shadow indicates the peak coincident with the RT of synthesized α-GalCer (d18:0/16:0). (E) HRMS/MS spectra of candidates for α-GalCer (d18:0/16:0) in serum. From top to bottom, collision energy settings are −10 eV (+), −20 eV (++), −30 eV (+++), and −40 eV (++++). The HRMS/MS of precursor-product ion pair: m/z 702.5878 to 540.5350, 522.5245, 284.2948, and 266.2842, respectively. (F) HRMS chromatograms of HexCer (d18:0/16:0) and the HRMS/MS spectra of candidates for α-GalCer (d18:0/16:0) in serum spiked with synthesized α-GalCer (d18:0/16:0). From left to right, collision energy settings are −10 eV (+), −20 eV (++), −30 eV (+++), and −40 eV (++++). The structures of product ions are shown. The red shadow indicates the peak coincident with the RT of synthesized α-GalCer (d18:0/16:0). The mass error tolerance of the precursor ion (m/z 702.5878 as [M+H]+) was <7 ppm (E and F). The HRMS/MS of precursor-product ion pair: m/z 702.5878 to 540.5350, 522.5245, 284.2948, and 266.2842, respectively (E and F). Data are presented as mean ± SD (B) and are representative of three independent experiments (A, C, and D–F).
Figure S2.
Figure S2.
α-GalCer is detected in serum using SFC/HRMS/MS. (A) Separation of the C:M = 19:1 fraction from serum by SFC. Samples, including HexCer, with a RT of 9.5–13.5 min were fractionated every 0.5 min. The other parts of the samples were separated into four subfractions: 0–9.5 (#1), 13.5–24 (#2), 24–34.5 (#3), and 34.5–45 min (#4). (B) HRMS chromatograms of the synthesized four diastereomers of HexCer (upper) and HexCer in serum (lower) (d18:1/16:0 and d18:1/24:1) obtained using SFC/HRMS. The mass error tolerance of the precursor ions (m/z 700.5722 and m/z 810.6817) was <7 ppm. (C) Monoisotopic (m/z 702.5858) and 13C1 isotopic spectra (m/z 703.5911) of α-GalCer (d18:0/16:0) candidate in serum. (D) The HRMS chromatograms were plotted from the theoretical m/z ± 7 ppm of candidate HexCer molecular species in serum obtained using SFC. The colored shadows indicate the peaks coincident with the theoretical RT of β-GlcCer (green) and β-GalCer (yellow), respectively. (E) Representative HRMS/MS spectra of four synthesized diastereomers of HexCer (d18:0/16:0) (m/z 702.5878, as [M+H]+) obtained using HRMS/MS. From top to bottom, collision energy settings are −10 eV (+), −20 eV (++), −30 eV (+++), and −40 eV (++++). Data are representative of three independent experiments (B–E).
Figure S3.
Figure S3.
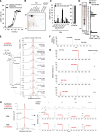
The presence of α-GalCer in mammalian tissues and fluids. (A) Synthetic β-GalCer (d18:1/16:0 and d18:1/24:1), LPA (O-16:0 and O-18:0), and LPE (P-18:0) were analyzed by HPTLC using C:M:W (65:25:4; vol/vol/vol) followed by staining with copper acetate reagent. Open and closed arrowheads denote the origin and solvent front, respectively. (B) Two clones of human iNKT TCR transfectants (#1 and #2) were stimulated with synthesized α-GalCer (d18:0/16:0) for 16 h and analyzed for CD69 expression. (C) CD1d-transduced B16F10 cells were cultured in RPMI 1640 supplemented with 10% FCS or in RPMI 1640 with 0.6% FCS and 9.4% animal component-free cell culture supplement for 7 days. DN32.D3 cells were co-cultured with those B16F10 cells in the presence of indicated concentrations of α-GalCer (d18:0/16:0) for 16 h and analyzed as in B. (D) HRMS and HRMS/MS chromatograms of HexCer (d18:0/16:0) in the spleen of germ-free mice. The red shadow indicates the peak coincident with synthesized α-GalCer (d18:0/16:0). (E) HRMS and HRMS/MS chromatograms of HexCer detected in human serum by SFC/HRMS/MS. The red shadows indicate the peaks coincident with the theoretical RTs of α-GalCer. The precursor ions as [M+H]+ are m/z 786.6817 and 800.6974, respectively. The HRMS chromatograms were plotted from the theoretical m/z ± 7 ppm of candidate HexCer molecular species. Data are presented as mean ± SD (B and C) and are representative of three independent experiments (A–C). CE, collision energy. Source data are available for this figure: SourceData FS3.
Figure 3.
Figure 3.
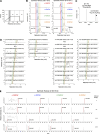
Detection of α-GalCer in serum and bile. (A) DN32.D3 cells were stimulated with synthesized α-GalCer (d18:0/16:0) or α-GalCer (t18:0/26:0) (KRN7000) for 16 h and analyzed for CD69 expression. (B) Lipid extracts from bovine bile were separated into five fractions by open column chromatography and analyzed by HPTLC using C:M:W (65:25:4; vol/vol/vol) followed by staining with copper acetate reagent. (C) CD1d−/− or CD1d-transduced DN32.D3 cells were stimulated for 16 h with each fraction of bovine bile lipids separated in B and analyzed as in A. α-GalCer (t18:0/26:0) was used as a positive control. (D) The C:M = 19:1 fraction of bovine bile lipid in B was separated into 16 subfractions by HPTLC (left) and used for stimulation as in C (right). α-GalCer (t18:0/26:0) was used as a positive control. (E) HRMS and HRMS/MS chromatograms of HexCer (d18:0/16:0) in bovine bile. (F and G) The HRMS spectra (F) and HRMS/MS spectra (G) of candidates for α-GalCer (d18:0/16:0) in bovine bile detected in D. From top to bottom, collision energy settings are −10 eV, −20 eV, −30 eV, and −40 eV (G). (H) HRMS chromatograms of HexCer (d18:0/16:0) and the HRMS/MS spectra of candidates for α-GalCer (d18:0/16:0) in bovine bile spiked with synthesized α-GalCer (d18:0/16:0). The area under the curve value ratio of the peak coincident with synthesized α-GalCer (d18:0/16:0) is 4.04 × 10⁶:7.22 × 10⁶. From left to right, collision energy settings are −10 eV (+), −20 eV (++), −30 eV (+++), and −40 eV (++++). The structures of product ions are shown. Open and closed arrowheads denote the origin and solvent front, respectively (B and D). The mass error tolerance of the precursor ion (m/z 702.5878 as [M+H]+) was <7 ppm (G and H). The HRMS/MS of precursor-product ion pair: m/z 702.5878 to 540.5350, 522.5245, 284.2948, and 266.2842, respectively (G and H). The red shadow indicates the peak coincident with synthesized α-GalCer (d18:0/16:0) (E and H). Data are presented as mean ± SD (A, C, and D) and are representative of three independent experiments (A–H). CE, collision energy. Source data are available for this figure: SourceData F3.
Figure 4.
Figure 4.
Detection of α-GalCer (d18:0/16:0) in mammalian tissues. (A) HRMS/MS spectra of candidate for α-GalCer (d18:0/16:0) (m/z 702.5878, as [M+H]+) in mouse spleen (left) and thymus (right). All HRMS/MS mass error tolerances are <7 ppm. From top to bottom, collision energy settings are −10 eV (+), −20 eV (++), −30 eV (+++), and −40 eV (++++). (B and C) HRMS chromatograms of HexCer (d18:0/16:0) and the HRMS/MS spectra of candidates for α-GalCer (d18:0/16:0) in spleen (B) and thymus (C) spiked with synthesized α-GalCer (d18:0/16:0). The area under the curve value ratios of each peak coincident with synthesized α-GalCer (d18:0/16:0) are 3.67 × 10⁵:7.35 × 10⁵ (B) and 3.43 × 10⁵:5.94 × 10⁵ (C). The mass error tolerance of the precursor ion (m/z 702.5878 as [M+H]+) was <7 ppm (A–C). The HRMS/MS chromatograms of precursor-product ion pair: m/z 702.5878 to 540.5350, 522.5245, 284.2948, and 266.2842, respectively (A–C). The red shadow indicates the peak coincident with synthesized α-GalCer (d18:0/16:0) (B and C). From left to right, collision energy settings are −10 eV (+), −20 eV (++), −30 eV (+++), and −40 eV (++++) (B and C). The structures of product ions are shown (B and C). Data are representative of three independent experiments (A–C).
Figure 5.
Figure 5.
Detection of α-GalCer (d18:0) species with several lengths of side chains in bile. (A) HRMS chromatograms of HexCer detected in bovine bile by SFC/HRMS/MS. The red shadow indicates the peaks coincident with the theoretical RTs of α-GalCer. The precursor ions as [M+H]+ are m/z 674.5565, 688.5722, 702.5878, 716.6035, 730.6191, and 800.6974, respectively. The HRMS chromatograms were plotted from the theoretical m/z ± 7 ppm of candidate HexCer molecular species. (B) The concentrations of α-GalCer, β-GalCer, and β-GlcCer of indicated species were detected in bovine bile. (C) The ratio of α-GalCer to β-GalCer quantities in the indicated GalCer species was detected in bovine bile by SFC/HRMS/MS.

References

    1. An, D., Oh S.F., Olszak T., Neves J.F., Avci F.Y., Erturk-Hasdemir D., Lu X., Zeissig S., Blumberg R.S., and Kasper D.L.. 2014. Sphingolipids from a symbiotic microbe regulate homeostasis of host intestinal natural killer T cells. Cell. 156:123–133. 10.1016/j.cell.2013.11.042 - DOI - PMC - PubMed
    1. Berger, T.A. 2022. The evolution and current state of instrumentation for analytical supercritical fluid chromatography. J. Chromatogr. B Analyt. Technol. Biomed. Life Sci. 1211:123478. 10.1016/j.jchromb.2022.123478 - DOI - PubMed
    1. Bligh, E.G., and Dyer W.J.. 1959. A rapid method of total lipid extraction and purification. Can. J. Biochem. Physiol. 37:911–917. 10.1139/y59-099 - DOI - PubMed
    1. Brennan, P.J., Brigl M., and Brenner M.B.. 2013. Invariant natural killer T cells: An innate activation scheme linked to diverse effector functions. Nat. Rev. Immunol. 13:101–117. 10.1038/nri3369 - DOI - PubMed
    1. Brennan, P.J., Tatituri R.V.V., Heiss C., Watts G.F.M., Hsu F.F., Veerapen N., Cox L.R., Azadi P., Besra G.S., and Brenner M.B.. 2014. Activation of iNKT cells by a distinct constituent of the endogenous glucosylceramide fraction. Proc. Natl. Acad. Sci. USA. 111:13433–13438. 10.1073/pnas.1415357111 - DOI - PMC - PubMed