. 2024 Dec 20:13:RP102222.
doi: 10.7554/eLife.102222.

A neurotrophin functioning with a Toll regulates structural plasticity in a dopaminergic circuit

Affiliations

A neurotrophin functioning with a Toll regulates structural plasticity in a dopaminergic circuit

Jun Sun et al. Elife. .

Abstract

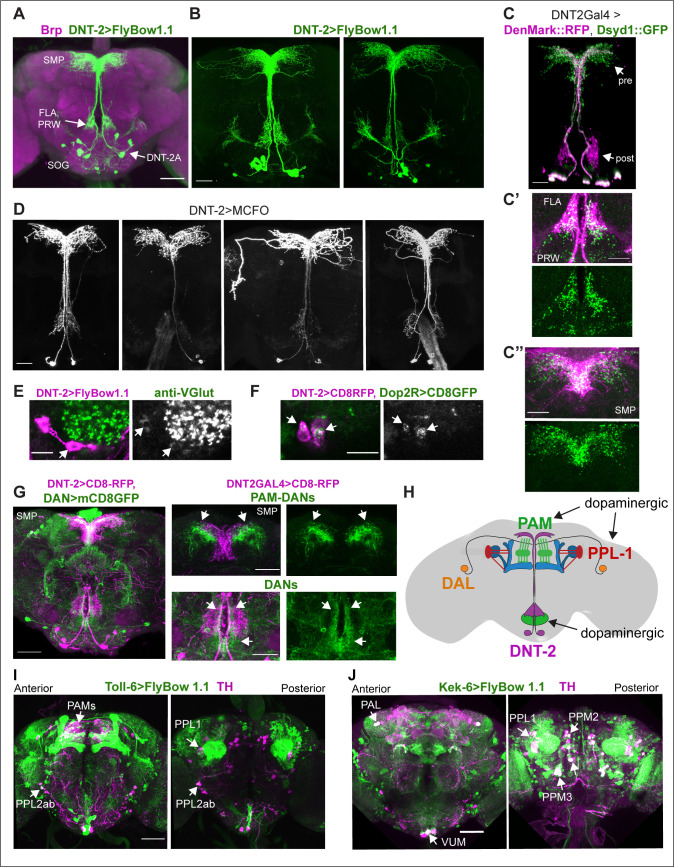
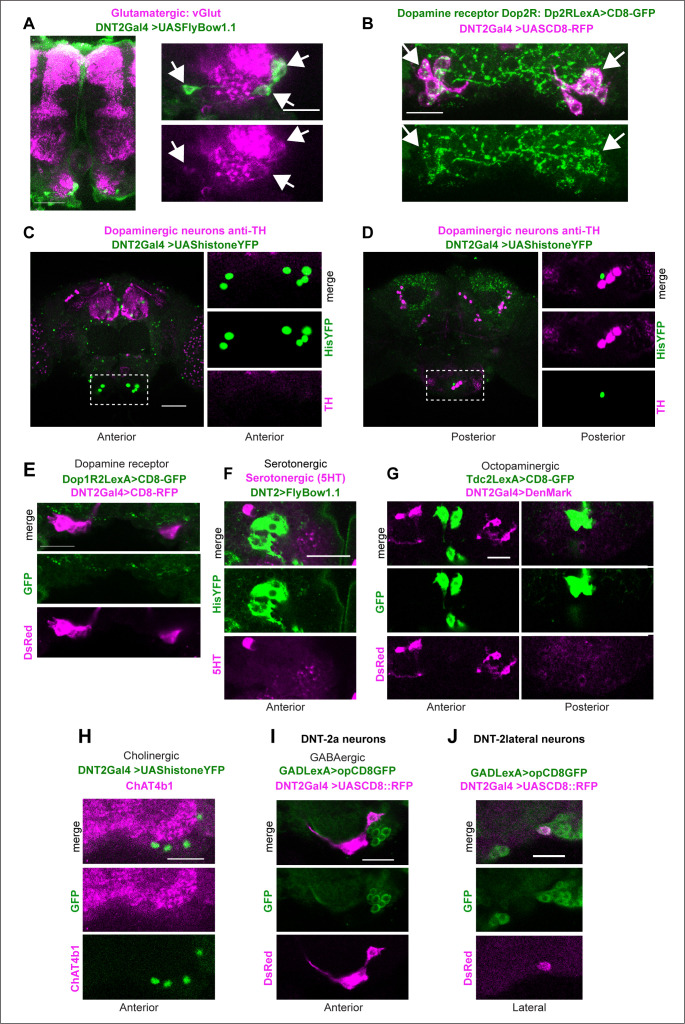
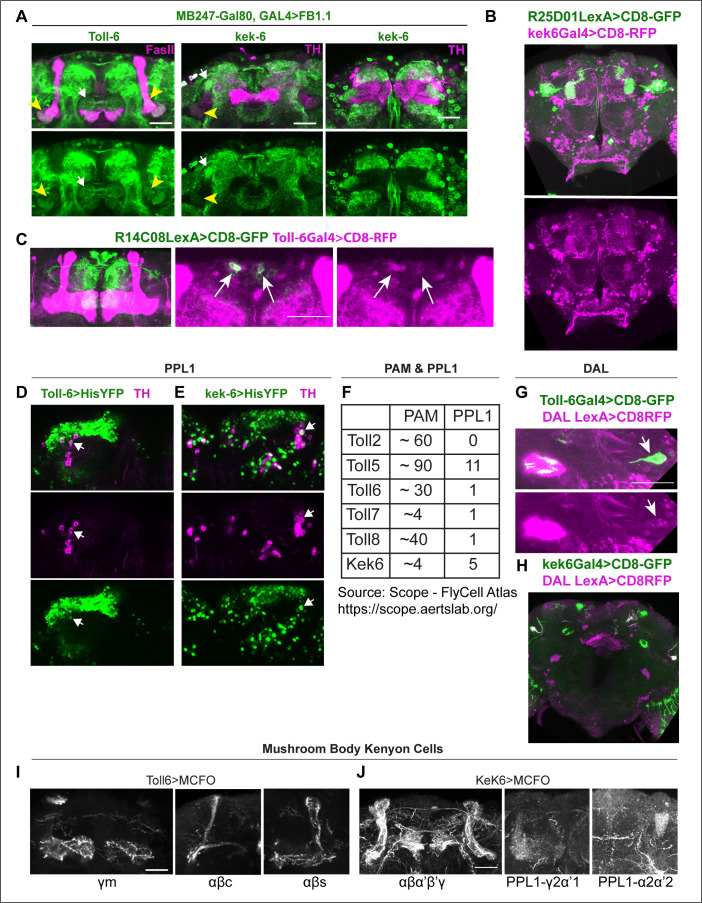
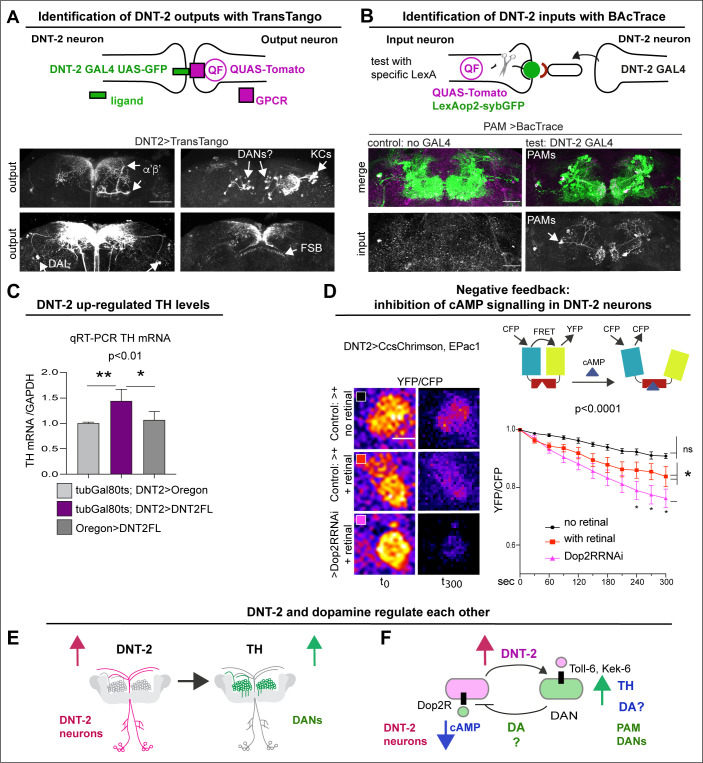
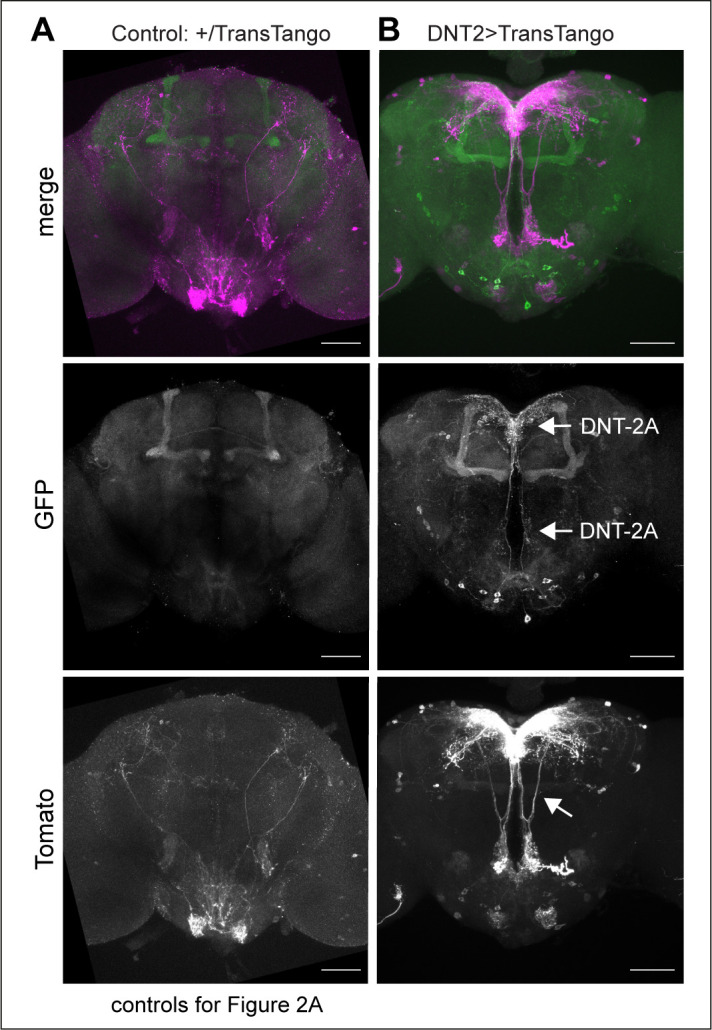
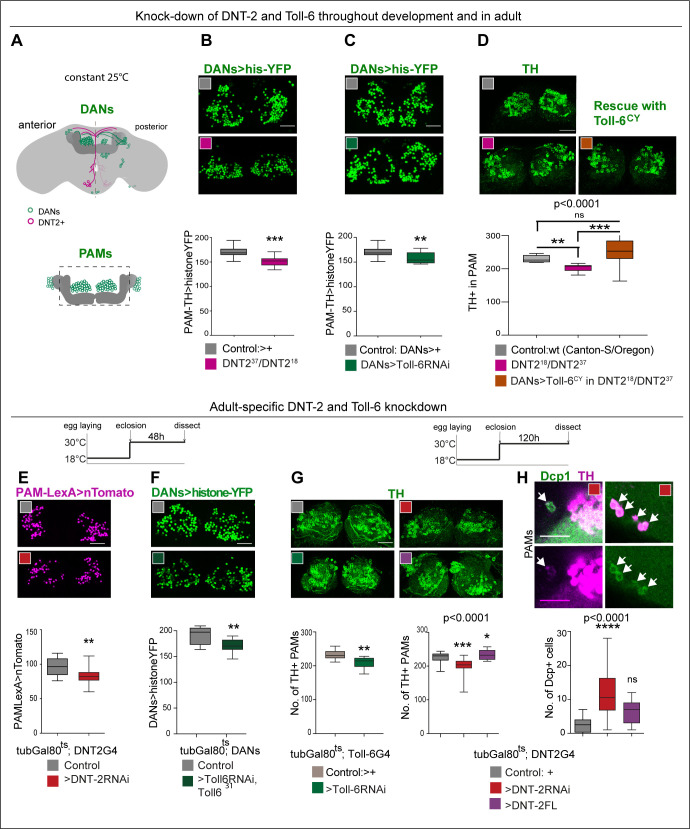
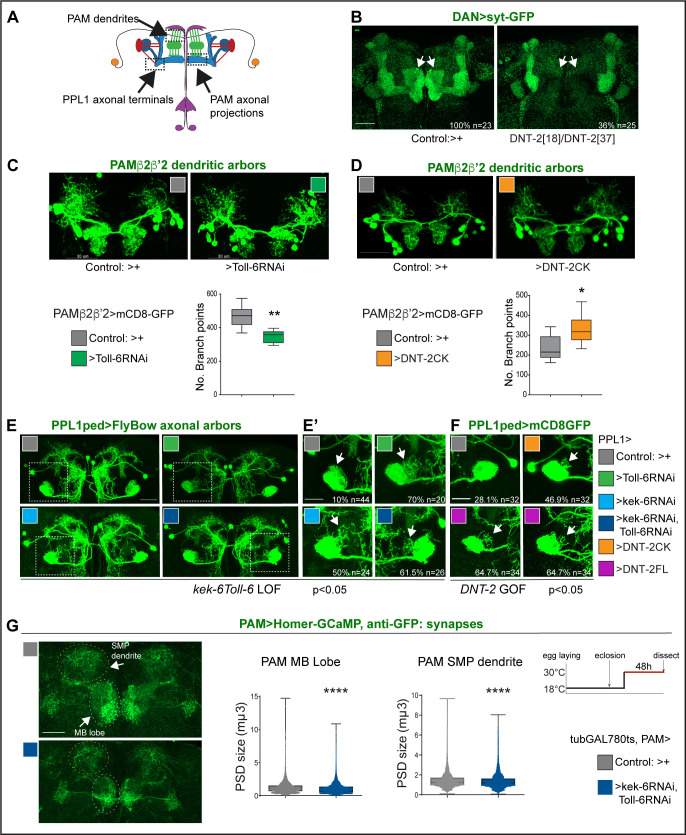
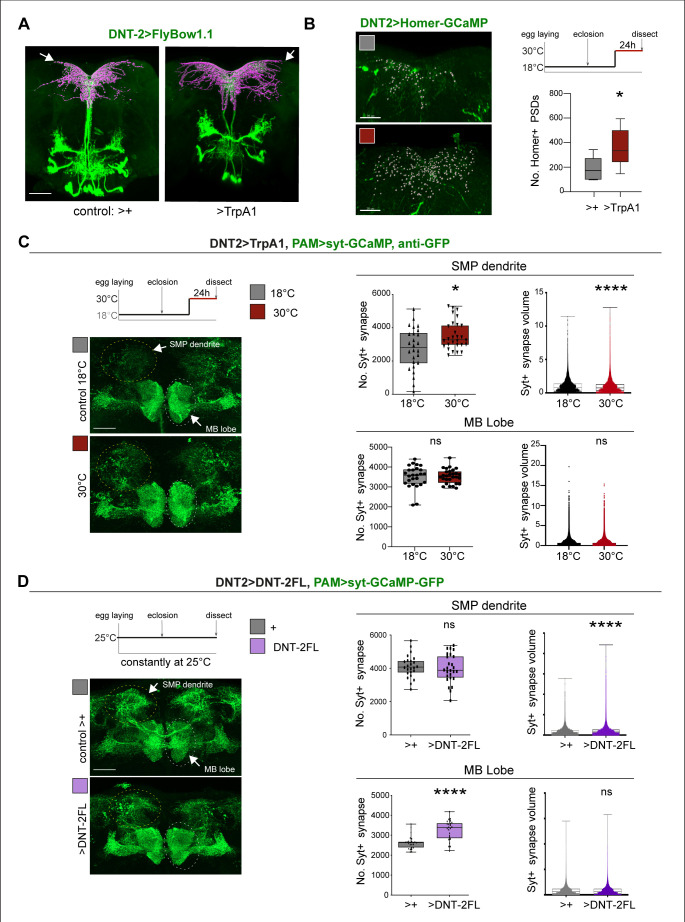
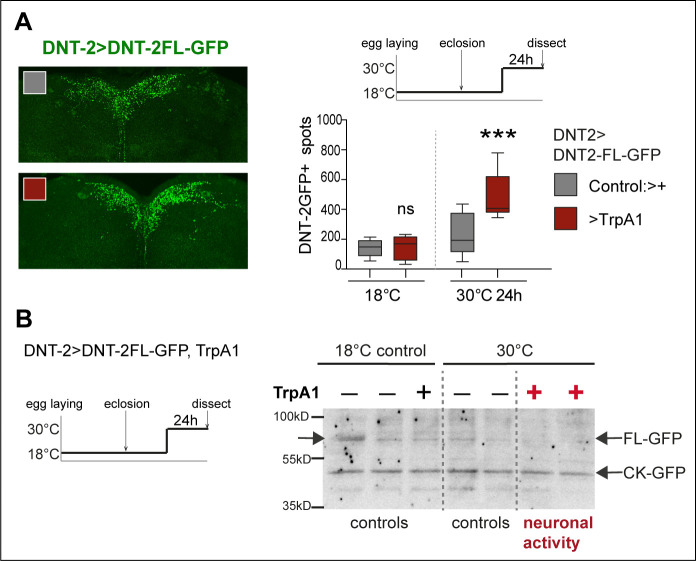
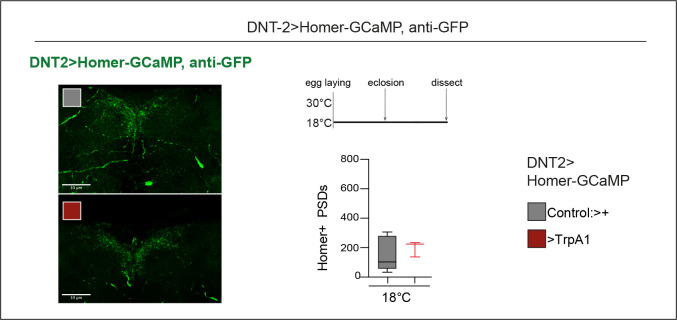
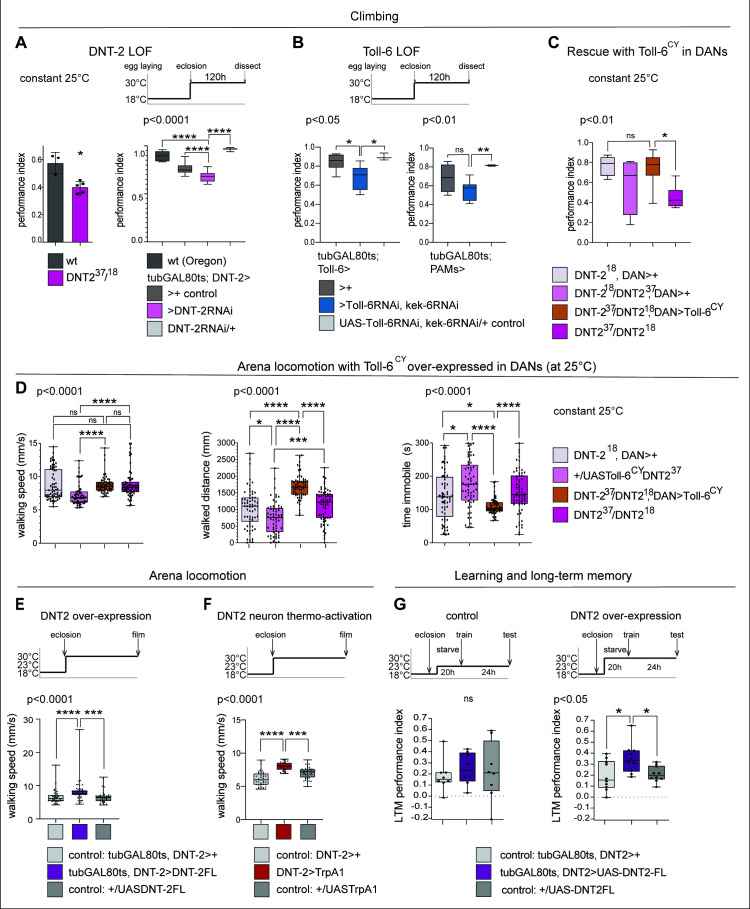
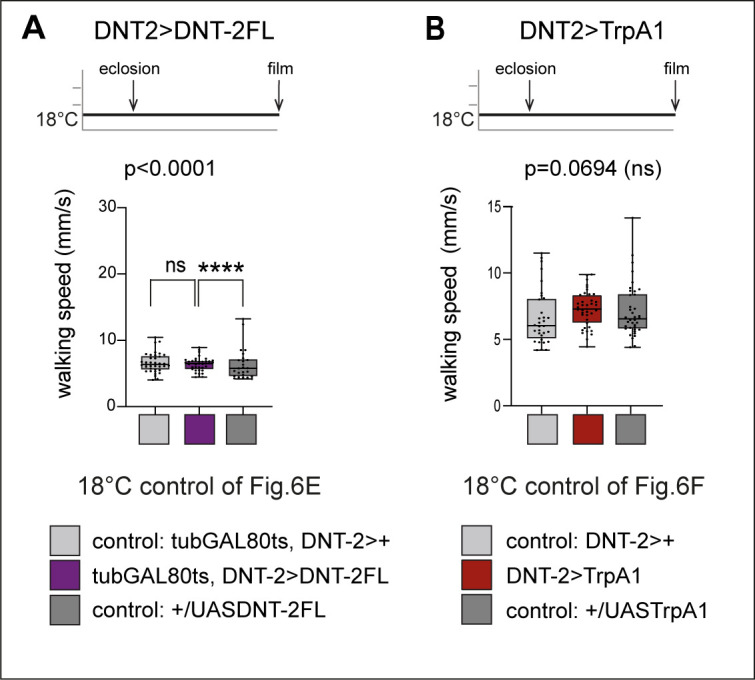
Experience shapes the brain as neural circuits can be modified by neural stimulation or the lack of it. The molecular mechanisms underlying structural circuit plasticity and how plasticity modifies behaviour are poorly understood. Subjective experience requires dopamine, a neuromodulator that assigns a value to stimuli, and it also controls behaviour, including locomotion, learning, and memory. In Drosophila, Toll receptors are ideally placed to translate experience into structural brain change. Toll-6 is expressed in dopaminergic neurons (DANs), raising the intriguing possibility that Toll-6 could regulate structural plasticity in dopaminergic circuits. Drosophila neurotrophin-2 (DNT-2) is the ligand for Toll-6 and Kek-6, but whether it is required for circuit structural plasticity was unknown. Here, we show that DNT-2-expressing neurons connect with DANs, and they modulate each other. Loss of function for DNT-2 or its receptors Toll-6 and kinase-less Trk-like kek-6 caused DAN and synapse loss, impaired dendrite growth and connectivity, decreased synaptic sites, and caused locomotion deficits. In contrast, over-expressed DNT-2 increased DAN cell number, dendrite complexity, and promoted synaptogenesis. Neuronal activity modified DNT-2, increased synaptogenesis in DNT-2-positive neurons and DANs, and over-expression of DNT-2 did too. Altering the levels of DNT-2 or Toll-6 also modified dopamine-dependent behaviours, including locomotion and long-term memory. To conclude, a feedback loop involving dopamine and DNT-2 highlighted the circuits engaged, and DNT-2 with Toll-6 and Kek-6 induced structural plasticity in this circuit modifying brain function and behaviour.

Keywords: D. melanogaster; DNT-2; Toll; cell biology; kek; neurodegeneration; neuroscience; structural plasticity; synaptogenesis.


Conflict of interest statement

JS, FR, SU, MF, GL, DS, XW, SC, MM, DK, GJ, VC, AH No competing interests declared

Figures

Figure 1.
Figure 1.. Neurons expressing DNT-2 and its receptors Toll-6 and kek-6 in the adult brain.
(A, B) DNT-2A-expressing neurons (DNT-2>FlyBow1.1 in green; anti-Brp in magenta) have cell bodies in SOG and project to FLA/PRW and SMP. (C, C’, C’’) Pre-synaptic (green) and post-synaptic (magenta) terminals of DNT-2A neurons seen with DNT-2>DenMark::RFP, Dsyd1::GFP, higher magnification in (C’, C”), different specimens from (C). DNT-2A projections at SMP and PRW have both pre- and post-synaptic sites. (D) Single-neuron DNT-2A>MCFO clones. (E) DNT-2A neurons have the vesicular glutamate transporter vGlut (arrows). (F) Co-localisation between Dop2RLexA>LexAOP-CD8-GFP and DNT2Gal4>UASCD8-RFP in cell bodies of DNT-2A neurons (arrows). (G) Terminals of dopaminergic neurons (TH>mCD8GFP) abut and overlap those of DNT-2A neurons (DNT2>CD8-RFP, magenta), arrows; magnified projections on the right. (H) Illustration of neurons expressing DNT-2 (magenta) and KCs, DAN PAM and PPL1, and DAL neurons (I) Toll-6>FlyBow1.1 is expressed in Kenyon cells, PPL1, PPL2, and PAM DANs, as revealed by co-localisation with anti-TH. (J) kek-6>FlyBow1.1 co-localises with TH in MB vertical lobes, dopaminergic PALs, VUMs, PPL1, PPM2, and PPM3. SMP: superior medial protocerebrum; PRW: Prow; FLA: Flange; SOG: sub-oesophageal ganglion. Scale bars: (A, G left, I, J) 50 µm; (B, C, C”, D, G right) 30 µm (C’, E, F) 25 µm. For genotypes and sample sizes, see Supplementary file 2.
Figure 1—figure supplement 1.
Figure 1—figure supplement 1.. Identification of neurotransmitter type for DNT-2A neurons.
(A) All four DNT-2A neurons per hemibrain are glutamatergic as DNT-2>FlyBow1.1 reporter co-localises with anti-vGlut in these neurons as well as in their projections at SMP (arrows point at cluster of four cells). (B) All four DNT-2A neurons per hemibrain have Dop2R (arrows point to cluster, each neuron seen in magenta). (C, D) Anterior DNT-2A neurons projecting at SMP are not dopaminergic as there was no co-localisation between DNT-2>histoneYFP and anti-TH in the anterior brain (C), and there was no co-localisation in other DNT-2+ neurons in the posterior brain either (D). Higher magnification of dotted boxes on the right. (E) There was no co-localisation with Dop1R2LexA>CD8::GFP, DNT-2Gal4>CD8::RFP either. (F) DNT-2 neurons are not serotonergic as there was no co-localisation between DNT-2>FlyBow1.1 and the serotonergic neuron marker anti-5HT. (G) They are not octopaminergic as there was no overlap between TdcLexA>mCD8::GFP and DNT-2Gal4>CD8::RFP. (H) There was no overlap between DNT-2Gal4>histoneYFP and the cholinergic neuron marker anti-ChAT4b1. (I, J) Anterior DNT-2A neurons are not GABAergic, but lateral DNT-2 neurons are, as visualised with DNT-2>CD8-RFP, GADLexA>CD8-GFP. Scale bars: (A right, B, E, F, G, H, I, J) 20 µm; (A left, C,D same magnification) 50 µm. For further genotypes and sample sizes, see Supplementary file 2.
Figure 1—figure supplement 2.
Figure 1—figure supplement 2.. Identification of Toll-6 and kek-6-expressing neurons.
(A)Toll-6Gal4, MB247-Gal80>UASFlyBow1.1 and kek-6Gal4, MB247-Gal80>UASFlyBow1.1 revealed Toll-6+ and Kek-6+ projections on MB γ2α’1. (B) R25D01LexA >CD8GFP, kek6-Gal4>CD8RFP overlapped in MB γ2α’1. (C) R14C08LexA >CD8GFP, Toll-6Gal4>CD8-RFP13 revealed co-localisation in MBON-M4/M6 cell bodies. (D, E) Co-localisation of Toll-6>Histone-YFP and kek-6>HistoneYFP with TH in PPL1 neurons. (F) Number of PAM and PPL1 neurons expressing Tolls and kek-6, revealed from published RNAseq data (Scope, see also Supplementary file 1). (G, H) Toll-6 and kek-6 are expressed in DAL neurons. (G) DAL neurons express Toll-6, as revealed by co-localisation between DAL-LexA (VT49239-LexA)>mCD8-GFP and Toll-6GAL4>mCD8-RFP. (H) DAL neurons express kek-6, as revealed by co-localisation between DAL-LexA (VT49239-LexA)>mCD8-GFP and kek6GAL4>mCD8RFP. (I, J) Toll-6 and kek-6 are expressed in MB neurons. (I) Toll-6>MCFO clones reveal expression at least in MB neurons γ medial (γm), αβcore (αβc), and αβsurface (αβs). (J) kek-6>MCFO clones reveal expression at least in MB Kenyon cells αβα’β’γ formed and MB γ2α’1 and α2α’2 and PPL1-γ2α’1 and PPL1-α2α’2. Scale bars: (B, H same magnification) 50 µm; (A,C,D,E,G, I, J same magnification) 30 µm. For further genotypes and sample sizes, see Supplementary file 2.
Figure 2.
Figure 2.. DNT-2 neurons are functionally connected to dopaminergic neurons.
(A) TransTango revealed out-puts of DNT-2 neurons. All neurons express TransTango and expression of the TransTango ligand in DNT-2 neurons identified DNT-2 outputs with Tomato (anti-DsRed). TransTango identified as DNT-2 outputs KC α’β’ MB lobes (anterior brain, arrow, top left); Kenyon and possibly DAN cell bodies (posterior, arrows top right); DAL neurons (bottom left, arrows) and the dorsal layer of the fan shaped body (bottom right, arrow). See also Figure 2—figure supplement 1 for further controls. (B) BAcTrace tests connectivity to a candidate neuron input visualised with LexAop>sybGFP by driving the expression of a ligand from DNT-2GAL4 that will activate QUASTomato in the candidate input neuron (Cachero et al., 2020). Candidate PAM neurons visualised at SMP with GFP (green): Control: R58E02LexA>BAcTrace 806, no GAL4. Test: R58E02LexA, DNT-2GAL4>BAcTrace 806 revealed PAMs are inputs of DNT-2A neurons at SMP (Tomato, bottom). Magenta shows QUAS-Tomato. (C) qRT-PCR showing that TH mRNA levels increased with DNT-2 over-expression at 30°C (tubGAL80ts, DNT-2>DNT-2FL). One-way ANOVA, p=0.0085; post doc Dunnett’s multiple comparison test. Mean ± standard deviation (s.d.). n=4 (left), 5 (middle), 3 (right). (D) FRET cAMP probe Epac1 revealed that DNT-2>Dop2R-RNAi knock-down decreased YFP/CFP ratio over time in DNT-2A neurons, meaning that cAMP levels increased. Two-way ANOVA, genotype factor p<0.0001, time factor p<0.0001; post doc Dunnett’s. Mean ±s.d. n=9,12,17. (E, F) Summary: DNT-2 neurons and DANs are functionally connected and modulate each other. (E) DNT-2 can induce TH expression in DANs; (F) this is followed by negative feedback from DANs to DNT-2 neurons (question marks indicate inferences). TH: tyrosine hydroxylase. Scale bars: (A) 50 µm; (B) 30 µm; (D) 20 µm. p-Values over graphs in (C) refer to group analyses; stars indicate multiple comparisons tests. *p<0.05, **p<0.01, ***p<0.001. For sample sizes and further statistical details, see Supplementary file 2.
Figure 2—figure supplement 1.
Figure 2—figure supplement 1.. TransTango connectivity controls.
(A) UAS-TransTango/+ control, showing background GFP expression in mushroom bodies and Tomato+ signal in sub-oesophageal ganglion (SOG). (B) DNT-2GAL4>UAS-TransTango, revealing the GFP+DNT-2 neurons and Tomato+ signal in DNT-2 neurons. TransTango also reveals what appears to be feedback connections between DNT-2 neurons from SMP to PRW (arrow). These are controls for Figure 2A. Scale bars: (A, B) 50 µm. For further genotypes and sample sizes, see Supplementary file 2.
Figure 3.
Figure 3.. DNT-2 and Toll-6 maintain PAM neuron survival in the developing and adult brain.
(A) Illustration of PAM neuronal cell bodies and experimental temporal profile. DANs are shown in green, DNT-2A neurons in magenta, and MB in dark grey. The left hemisphere shows the anterior brain with PAL and PAM DAN neurons (green) and DNT-2 neurons (magenta); the right shows the posterior brain, with the calyx and other DAN neurons (PPM1, PPM2, PPM3, PPL1, PPL2, green). (B–D) Fruit flies were kept constantly at 25°C, from development to adult. Analyses done in adult brains. (B) DNT-237/DNT-218 mutants had fewer histone-YFP+-labelled PAM neurons (THGAL4, R58E02-GAL4>hisYFP). Unpaired Student’s t-test. (C) Toll-6 RNAi knock-down in all DANs (THGAL4, R58E02-GAL4>hisYFP, Toll-6 RNAi) reduced Histone-YFP+-labelled PAM cell number. Unpaired Student’s t-test. (D) DNT-237/DNT-218 mutants had fewer PAMs stained with anti-TH antibodies. Over-expressing Toll-6CY in DANs (THGAL4, R58E02 GAL4>hisYFP, Toll-6CY) rescued TH+ PAM neurons in DNT-237/DNT-218 mutants, demonstrating that DNT-2 functions via Toll-6 to maintain PAM cell survival. Welch ANOVA p<0.0001, post hoc Dunnett test. (E–H) Adult-specific restricted over-expression or knock-down at 30°C using the temperature-sensitive GAL4 repressor tubGAL80ts. (E) Adult-specific DNT-2 RNAi knock-down in DNT-2 neurons decreased Tomato+ PAM cell number (tubGAL80ts, R58E02-LexA, DNT-2 GAL4>LexAOP-Tomato, UAS DNT-2-RNAi). Unpaired Student’s t-test, p=0.005. (F) Adult-specific Toll-6 RNAi knock-down in Toll-631 heterozygous mutant flies in DANs, reduced Histone-YFP+ PAM cell number (tubGAL80ts; THGAL4, R58E02-GAL4>hisYFP, Toll-6 RNAi/Toll631). Unpaired Student’s t-test. (G) PAMs were visualised with anti-TH. Left: tubGAL80ts, Toll-6>Toll-6-RNAi knock-down decreased TH+ PAM cell number. Unpaired Student’s t-test. Right: tubGAL80ts, DNT-2>DNT-2-RNAi knock-down decreased TH+ PAM cell number, whereas DNT-2FL over-expression increased PAM cell number. Kruskal–Wallis ANOVA, p=0.0001, post hoc Dunn’s test. (H) Adult-specific tubGAL80ts, DNT-2>DNT-2RNAi knock-down increased the number of apoptotic cells in the brain labelled with anti-DCP-1. Dcp-1+ cells co-localise with anti-TH at least in PAM clusters. One-way ANOVA, p<0.0001, post hoc Bonferroni’s multiple comparisons test. DANs>histone-YFP: all dopaminergic neurons expressing histone-YFP, genotype: THGal4 R58E02Gal4>UAS-histoneYFP. PAMsLexA>tomato: restricted to PAM DANs: R58E02LexA >LexAop-nlstdTomato. Controls: GAL4 drivers crossed to wild-type Canton-S. Scale bars: (B–G) 30 µm; (H) 20 µm. Graphs show boxplots around the median. p-values over graphs in (D, G right, H) refer to group analyses; stars indicate multiple comparisons tests. *p<0.05, **p<0.01, ***p<0.001. For further genotypes, sample sizes, and statistical details, see Supplementary file 2.
Figure 4.
Figure 4.. DNT-2, Toll-6, and Kek-6 are required for arborisations and synapse formation.
(A) Illustration showing the regions of interest (ROIs) (dashed lines) used for the analyses, corresponding to dendrites and axonal endings of PAMs and axonal terminals of PPL1ped neurons. (B–F) Fruit flies were kept constantly at 25°C. (B) Complete loss of DAN synapses (THGAL4, R58E02GAL4>syt-GFP) onto α,β MB lobe in DNT-237/DNT-218 null mutants. (C) Toll-6 RNAi knock-down in PAM β2β’2 neurons (MB301B>FB1.1, Toll-6-RNAi) decreased dendrite complexity. Unpaired Student’s t-test. (D) Over-expression of cleaved DNT-2CK in PAM β2β’2 neurons (MB301B>CD8-GFP, DNT-2CK) increased dendrite complexity. Unpaired Student’s t-test. Same magnification as (C). (E, E’, F) PPL1ped axonal misrouting was visualised with split-GAL4 MB320CGal4>FlyBow1.1. Images show PPL1-γped neurons and some PPL1-α2α’2. (E,E’) RNAi knock-down of Toll-6, kek-6 or both (e.g. MB320CGal4>FlyBow1.1, Toll-6RNAi) in PPL1-γped neurons caused axonal terminal misrouting (arrows). (E’ Higher magnification of E, dotted squares). Chi-square for group analysis: p=0.0224, and multiple comparisons Bonferroni correction control vs Toll-6RNAi p<0.01; vs kek-6RNAi p<0.05; vs Toll-6RNAi kek-6RNAi p<0.01, see Supplementary file 2. (F) PPL1 misrouting was also induced by over-expressed DNT-2CK or DNT-2FL (e.g. MB320CGal4>FlyBow1.1, DNT-2FL). Chi-square for group analysis: p<0.05, Bonferroni correction control vs DNT-2CK ns, vs DNT-2FL *p<0.05, see Supplementary file 2. (G) Adult-specific Toll-6 kek-6 RNAi knock-down in PAM neurons decreased size of post-synaptic density sites (PAM >Homer-GCaMP and anti-GFP antibodies). Temperature regime shown on the right. (C, D) Graphs show boxplots around the median; (G) are boxplots with dot plots. (C, D, G) *p<0.05, **p<0.01, ****p<0.0001. Scale bars: (B, C, D, E) 30 µm; (E’, F, G) 20 µm. For genotypes, sample sizes, and statistical details, see Supplementary file 2.
Figure 5.
Figure 5.. DNT-2 neuron activation and DNT-2 over-expression induced synaptogenesis.
(A) Thermo-activation of DNT-2 neurons at 30°C altered DNT-2 arborisations, here showing an example with smaller dendrites and enlarged axonal arbours (magenta shows 3D rendering of axonal arborisation done with Imaris, merged with raw image in green) (genotype: DNT-2>FlyBow1.1, TrpA1). (B) Thermogenetic activation of DNT-2 neurons increased the number of Homer+ PSDs in DNT-2 neurons, at SMP (DNT-2>Homer-GCAMP3, TrpA1, anti-GFP). Test at 30°C 24 hr: unpaired Student’s t-test. See Supplementary file 2. (C) Thermogenetic activation of DNT-2 neurons induced synaptogenesis in PAM target neurons at SMP, but not at MB lobe (genotype: PAM(R58E02)LexA/LexAOP-sytGCaMP; DNT-2GAL4/UASTrpA1). At SMP: No. Syt+ synapses: Mann–Whitney U; Syt+ synapse volume: Mann–Whitney U. At MB lobe: No. Syt+ synapses: unpaired Student’s t ns; Syt+ synapse volume: Mann–Whitney U ns. (D) Over-expression of DNT-2FL in DNT-2 neurons increased synapse volume at SMP dendrite and induced synaptogenesis at MB lobe (genotype: PAM(R58E02)LexA/LexAopSytGcaMP6; DNT-2Gal4/UAS-DNT-2FL). At SMP: No. Syt+ synapses: unpaired Student’s t ns. Syt+ synapse volume: Mann–Whitney U. At MB lobe: No. Syt+ synapses: unpaired Student’s t; Syt+ synapse volume: Mann–Whitney U ns. Graphs show boxplots around the median, except for PSD volume data that are dot plots. *p<0.05, ****p<0.0001; ns: not significantly different from control. Scale bars (A-D): 30 µm. For genotypes, sample sizes, p-values, and other statistical details, see Supplementary file 2.
Figure 5—figure supplement 1.
Figure 5—figure supplement 1.. Neuronal activity increased production and cleavage of DNT-2.
(A) Thermogenetic activation of DNT-2 neurons increased the number of DNT-2FLGFP+ vesicles or spots (DNT-2>DNT-2-FL-GFP, TrpA1 with anti-GFP). Control 18°C: unpaired Student’s t-test, ns. Activation 30°C 24 hr: Mann–Whitney. (B) Western blot from fly heads over-expressing DNT-2FL-GFP in DNT-2+ neurons showing that neuronal activation with TrpA1 at 30°C increased DNT-2FL-GFP cleavage (genotype: DNT-2>TrpA1, DNT-2FL-GFP). Controls are flies of the same genotype kept constantly at 18°C as well as flies treated also at 30°C but lacking TrpA1. High temperature (30°C) is sufficient to increase fly activity. ***p<0.001. ns, not significant. For further genotypes, sample sizes, p-values, and other statistical details, see Supplementary file 2.
Figure 5—figure supplement 2.
Figure 5—figure supplement 2.. Controls for Figure 5B.
Control at 18°C, for Figure 5B. DNT-2 bidirectional arborisation at SMP was visualised with Homer-GCaMP and anti-GFP antibodies (DNT-21>homer-GCAMP and DNT-2>homer-GCAMP, TrpA1 at 18°C). Unpaired Student’s t-test, ns. Scale bars: 30 µm. For further genotypes, sample sizes, p-values, and other statistical details, see Supplementary file 2.
Figure 6.
Figure 6.. DNT-2-induced circuit plasticity modified dopamine-dependent behaviour.
(A) DNT-2 mutants (left, DNT-237/DNT-218) and flies with adult-specific RNAi knock-down of DNT-2 in DNT-2 neurons (right, tubGAL80ts; DNT-2>DNT-2RNAi), had impaired climbing. Left: Mann–Whitney U; right: one-way ANOV, post hoc Dunnett. (B) Adult-specific Toll-6 and kek-6 RNAi knock-down in Toll-6 (tubGAL80ts; Toll-6>Toll-6RNAi, kek-6RNAi, left) or PAM (tubGAL80ts; R58E02>Toll-6RNAi, kek-6RNAi, right) neurons impaired climbing. Left: Welch ANOVA, post hoc Dunnett. Right: Welch ANOVA, post hoc Dunnett. (C) The climbing impairment of DNT-2 mutants could be rescued with the over-expression of Toll-6CY in dopaminergic neurons (rescue genotype: UASToll-6CY/+; DNT-218THGAL4 R58E02GAL4/DNT-237). Welch ANOVA, post hoc Dunnett. (D) Adult-specific over-expression of Toll-6CY in DANs increased locomotion in DNT-237/DNT-218 mutants (test genotype: UASToll-6CY/+; DNT-218THGAL4 R58E02GAL4/DNT-237). Walking speed: Kruskal–Wallis ANOVA, post hoc Dunn’s. Distance walked: Kruskal–Wallis ANOVA, post hoc Dunn’s. Time spent immobile: Kruskal–Wallis ANOVA, post hoc Dunn’s. (E) Adult-specific DNT-2FL overexpression in DNT-2 neurons increased fruit fly locomotion speed in an open arena at 30°C (see also Figure 6—figure supplement 1A for further controls) (test genotype: tubGAL80ts, DNT-2>DNT-2FL) Kruskal–Wallis, post hoc Dunn’s test. (F) Thermogenetic activation of DNT-2 neurons at 30°C (DNT-2>TrpA1) increased fruit fly locomotion speed (see also Figure 6—figure supplement 1B for further controls). One-way ANOVA p<0.0001, post hoc Dunnett’s test. (G) Over-expression of DNT-2-FL in DNT-2 neurons increased long-term memory (test genotype: tubGAL80ts, DNT-2>DNT-2FL). Left: 23°C controls: one-way ANOVA p=0.8006. Right: 30°C: one-way ANOVA, post hoc Dunnett’s test. Graphs show boxplots around the median, under also dot plots. p-Values over graphs refer to group analyses; asterisks indicate multiple comparisons tests. *p<0.05, **p<0.01, ***p<0.001, ****p<0.0001; ns, not significantly different from control. For further genotypes, sample sizes, p-values, and other statistical details, see Supplementary file 2.
Figure 6—figure supplement 1.
Figure 6—figure supplement 1.. Locomotion in open arena controls.
(A) Controls for Figure 6E. In 18°C controls, GAL80 is on and GAL4 is off, thus there is no adult-specific DNT-2FL overexpression in DNT-2 neurons in these flies (genotype: tubGAL80ts, DNT-2>DNT-2FL). Consistently, there was no increase in locomotion speed in an open arena, in flies over-expressing DNT-2FL relative to controls, compare also to Figure 6E. Kruskal–Wallis ANOVA ns (lower median in UAS-DNT-2FL/+ control). (B) Controls for Figure 6F. The cation TrpA1 opens at high temperatures (e.g. 30°C) but remains closed at 18°C. Consistently, there was no effect in locomotion at 18°C in flies of genotype DNT-2>TrpA1 compared to controls, compare also to 30°C data in Figure 6F. Kruskal–Wallis ANOVA ns. For further genotypes, sample sizes, p-values, and other statistical details, see Supplementary file 2.
Figure 6—figure supplement 2.
Figure 6—figure supplement 2.. Altering DNT-2 levels induced seizures.
Knock-down or over-expression of DNT-2 in the adult, using GAL80ts. Fruit flies were reared at 18°C from egg laying to adult eclosion, when they were transferred to 30°C and kept there for 5 days prior to testing. To test for seizures, we used the bang-sensitivity test. DNT237/DNT218 mutant flies (left) and adult DNT-2 knock-down flies (tubGal80ts DNT-2Gal4>DNT-2RNAi, centre) took longer to recover than controls. Over-expression of DNT-2FL in DNT-2 neurons (tubGal80ts DNT-2Gal4>DNT-2FL, right) increased variability in recovery time. For further genotypes and sample sizes, see Supplementary file 2.

Update of

References

    1. Adel M, Griffith LC. The role of dopamine in associative learning in Drosophila: An updated unified model. Neuroscience Bulletin. 2021;37:831–852. doi: 10.1007/s12264-021-00665-0. - DOI - PMC - PubMed
    1. Adhikarla SV, Jha NK, Goswami VK, Sharma A, Bhardwaj A, Dey A, Villa C, Kumar Y, Jha SK. TLR-mediated signal transduction and neurodegenerative disorders. Brain Sciences. 2021;11:11. doi: 10.3390/brainsci11111373. - DOI - PMC - PubMed
    1. Anthoney N, Foldi I, Hidalgo A. Toll and Toll-like receptor signalling in development. Development. 2018;145:dev156018. doi: 10.1242/dev.156018. - DOI - PubMed
    1. Arikkath J. Molecular mechanisms of dendrite morphogenesis. Frontiers in Cellular Neuroscience. 2012;6:61. doi: 10.3389/fncel.2012.00061. - DOI - PMC - PubMed
    1. Arnot CJ, Gay NJ, Gangloff M. Molecular mechanism that induces activation of Spätzle, the ligand for the Drosophila Toll receptor. The Journal of Biological Chemistry. 2010;285:19502–19509. doi: 10.1074/jbc.M109.098186. - DOI - PMC - PubMed

MeSH terms

LinkOut - more resources