. 2024 Dec 15;45(18):e70099.
doi: 10.1002/hbm.70099.

Discovery, Replicability, and Generalizability of a Left Anterior Hippocampus' Morphological Network Linked to Self-Regulation

Affiliations

Discovery, Replicability, and Generalizability of a Left Anterior Hippocampus' Morphological Network Linked to Self-Regulation

Somayeh Maleki Balajoo et al. Hum Brain Mapp. .

Abstract

The human hippocampus is a key region in cognitive and emotional processing, but also a vulnerable and plastic region. Accordingly, there is a great interest in understanding how variability in the hippocampus' structure relates to variability in behavior in healthy and clinical populations. In this study, we aimed to link interindividual variability in subregional hippocampal networks (i.e., the brain grey matter networks of hippocampal subregions) to variability in behavioral phenotype. To do so, we used a multiblock multivariate approach mapping the association between grey matter volume in hippocampal subregions, grey matter volume in the whole brain regions, and behavioral variables in healthy adults. To ensure the robustness and generalizability of the findings, we implemented a cross-cohort discovery and validation framework. This framework utilized two independent cohorts: the Human Connectome Project Young Adult (HCP-YA) cohort and the Human Connectome Project Aging (HCP-A) cohort, enabling us to assess the replicability and generalizability of hippocampal-brain-behavior phenotypes across different age groups in the population. Our results highlighted a left anterior hippocampal morphological network including the left amygdala and the posterior midline structures whose expression relates to higher self-regulation, life satisfaction, and better performance at standard neuropsychological tests. The cross-cohort generalizability of the hippocampus-brain-behavior mapping demonstrates its relevance beyond a specific population sample. Our previous work in developmental populations showed that the hippocampus' head co-maturates with most of the brain during childhood. The current data-driven study further suggests that grey matter volume in the left hippocampal head network would be particularly relevant for self-regulation abilities in adults that influence a range of life outcomes. Future studies should thus investigate the factors influencing the development of this morphological network across childhood, as well as its relationship to neurocognitive phenotypes in various brain diseases.

Keywords: CCA; brain–behavior relationships; generalizability; hippocampus' organization; machine learning; replicability.


Conflict of interest statement

The authors declare no conflicts of interest.

Figures
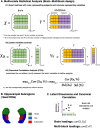
FIGURE 1
FIGURE 1
Overview of the brain–multiblock design and analysis framework. Matrix X represents parcellated whole‐brain grey matter volumes (except parcels related to bilateral Hippocampus) with dimensions N × P, where N is the sample size and P is the number of whole‐brain parcels. Matrix Y with dimensions N × R represents the concatenation of hippocampal subregions (B) and behavioral variables, where N is the sample size and R is the total number of hippocampal subregions and behavioral variables. Canonical correlation analysis is utilized to identify brain weights (u) and multiblock weights (v), representing linear combinations of variables in matrices X and Y, respectively. Projecting the original data X and Y onto these weights yields scores (Xu and Yv). The model optimizes weights to maximize canonical correlation (i.e., effect size), typically reported with Pearson's correlation between brain scores and multiblock scores. This correlation is depicted as a latent dimension, with each point representing one participant. Variable loadings are derived based on the correlation between the (original) variables and the canonical variate. Loadings here hence reflect the correlation between original variables in X and Y and brain and multiblock scores, respectively. The figure highlights how latent dimensions are extracted and interpreted.
FIGURE 2
FIGURE 2
Cross‐Cohort Discovery and Validation Framework. This framework used two independent cohorts: HCP‐YA cohort and HCP‐A cohort as Discovery and Validation cohorts interchangeably to ensure the robustness and generalizability of the findings. Regularized canonical correlation analysis (RCCA) models were trained and evaluated on the discovery cohort using a machine learning framework with nested cross‐validation, consisting of five outer splits and five inner splits. In the outer splits, the data is partitioned into optimization and test sets, while within the inner splits, the optimization set is further divided into training and validation sets. This meticulous division aims to enhance the precision of the model through hyperparameter tuning, model selection, and statistical evaluation. After selecting the best model based on highly significant canonical correlation, the canonical weights (computed in the discovery phase) were used to project the data in the validation onto the identified latent dimensions. This allowed us to assess whether the relationships identified in the discovery cohort between variables could be replicated in the validation cohort.
FIGURE 3
FIGURE 3
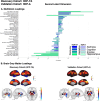
Second latent dimension: Discovery cohort (HCP‐YA) and Validation cohort (HCP‐A). (A) Multiblock loadings; (B) Brain grey matter volume loadings. Both loadings were primarily used for interpreting how variables in the multiblock data and whole brain grey matter volume contributed to the identified second latent dimension A. Dark and light colors represent loadings for the discovery and validation cohorts, respectively. The loadings are calculated for the best model based on high effect size (canonical correlation) across five outer splits. The color‐map bars illustrate multiblock variables associated with various domains such as alertness, cognition, emotion, and hippocampal subregions. (B) Cortical and subcortical patterns of brain loadings are shown separately for visualization purposes. Thresholding was applied in the brain loadings cortical maps purely for visualization purposes to highlight key contributing regions. It was not based on any statistical criteria and does not reflect significance. The subcortical slice corresponds to MNI coordinates: 19, −5, 0. In both cortical and subcortical maps, red indicates positive loadings and blue indicates negative loadings.
FIGURE 4
FIGURE 4
Cross‐cohort replicability and generalizability of the second latent dimension. This figure illustrates the effect sizes of canonical correlations for the second latent dimension in both discovery and validation cohorts. (A) In the primary analysis, using the HCP‐YA as the discovery cohort, the effect size for the significant canonical correlation was 0.72, while the effect size in the validation cohort (HCP‐A) was 0.48. (B) In the replication analysis, where HCP‐A served as the discovery cohort and HCP‐YA as the validation cohort, the effect sizes were 0.58 and 0.45, respectively. All effect sizes are significant, indicating robust relationships between hippocampal–brain–behavior variability across cohorts.
FIGURE 5
FIGURE 5
Second latent dimension in replication analysis: Discovery cohort (HCP‐A) and Validation cohort (HCP‐YA). (A) Multiblock loadings; (B) Brain grey matter volume loadings. Both loadings were primarily used for interpreting how variables in the multiblock data and whole brain grey matter volume contributed to the identified second latent dimension A. Dark and light colors represent loadings for the discovery and validation cohorts, respectively. The loadings are calculated for the best model based on high effect size (canonical correlation) across five outer splits. The color‐map bars illustrate multiblock variables associated with various domains such as alertness, cognition, emotion, and hippocampal subregions. (B) Cortical and subcortical patterns of brain loadings are shown separately for visualization purposes. Thresholding was applied in the brain loadings cortical maps purely for visualization purposes to highlight key contributing regions. It was not based on any statistical criteria and does not reflect significance. The subcortical slice corresponds to MNI coordinates: 19, −5, 0. In both cortical and subcortical maps, red indicates positive loadings and blue indicates negative loadings.

Similar articles

References

    1. Banker, S. M. , Gu X., Schiller D., and Foss‐Feig J. H.. 2021. “Hippocampal Contributions to Social and Cognitive Deficits in Autism Spectrum Disorder.” Trends in Neurosciences 44, no. 10: 793–807. - PMC - PubMed
    1. Barnes, J. , Scahill R. I., Schott J. M., Frost C., Rossor M. N., and Fox N. C.. 2005. “Does Alzheimer's Disease Affect Hippocampal Asymmetry? Evidence From a Cross‐Sectional and Longitudinal Volumetric MRI Study.” Dementia and Geriatric Cognitive Disorders 19, no. 5–6: 338–344. - PubMed
    1. Besteher, B. , Gaser C., and Nenadić I.. 2020. “Brain Structure and Subclinical Symptoms: A Dimensional Perspective of Psychopathology in the Depression and Anxiety Spectrum.” Neuropsychobiology 79, no. 4–5: 270–283. - PubMed
    1. Bookheimer, S. Y. , Salat D. H., Terpstra M., et al. 2019. “The Lifespan Human Connectome Project in Aging: An Overview.” NeuroImage 185: 335–348. - PMC - PubMed
    1. Caplan, J. B. , McIntosh A. R., and De Rosa E.. 2007. “Two Distinct Functional Networks for Successful Resolution of Proactive Interference.” Cerebral Cortex 17, no. 7: 1650–1663. - PubMed

MeSH terms