. 2025 Jan;121(2):e17212.
doi: 10.1111/tpj.17212. Epub 2024 Dec 20.

BIL7 enhances plant growth by regulating the transcription factor BIL1/BZR1 during brassinosteroid signaling

Affiliations

BIL7 enhances plant growth by regulating the transcription factor BIL1/BZR1 during brassinosteroid signaling

Tomoko Miyaji et al. Plant J. 2025 Jan.

Abstract

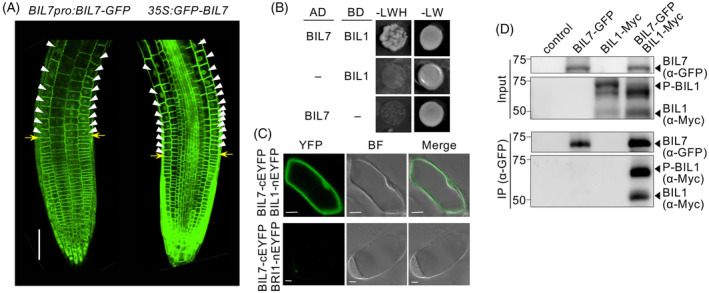
Brassinosteroids (BRs) are plant steroid hormones that regulate plant development and environmental responses. BIL1/BZR1, a master transcription factor that regulates approximately 3000 genes in the BR signaling pathway, is transported to the nucleus from the cytosol in response to BR signaling; however, the molecular mechanism underlying this process is unknown. Here, we identify a novel BR signaling factor, BIL7, that enhances plant growth and positively regulates the nuclear accumulation of BIL1/BZR1 in Arabidopsis thaliana. BIL7-overexpressing plants were resistant to the BR biosynthesis inhibitor Brz and taller than wild-type (WT) plants were due to increased cell division. BIL7 is mainly localized to the plasma membrane, but during the early stages of cell growth, it was also localized to the nucleus. BIL7 was directly phosphorylated by the kinase BIN2, and nuclear localization of BIL7 was enhanced by the BIN2 inhibitor bikinin. BIL7 was found to bind to BIL1/BZR1, and nuclear accumulation of BIL1/BZR1 was strongly enhanced by BIL7 overexpression. Finally, double overexpression of BIL1/BZR1 and BIL7 led to greatly elongated hypocotyls in the presence of Brz. These findings suggest that BIL7 mediates nuclear accumulation of BIL1/BZR1, which activates inflorescence elongation in plants via BR signaling.

Keywords: BIL1/BZR1; BIN2; NRPM; brassinosteroid; nuclear localization; plant growth; signaling pathway.


Conflict of interest statement

The authors declare no conflict of interest.

Figures

Figure 1
Figure 1
BIL7 positively regulates BR signaling. (A) Hypocotyl phenotypes of WT, 35S:BIL7‐2 (BIL7‐OX2), bil7‐1D, and 35S:BIL7‐1 (BIL7‐OX1) plants grown on medium supplemented with 3 μM Brz in the dark for 7 days. Scale bars, 1 mm. (B) Hypocotyl lengths of WT, BIL7‐OX2, bil7‐1D, BIL7‐OX1, and bil1‐1D/bzr1‐1D plants grown on medium supplemented with 3 μM Brz or mock solution (0 μM) in the dark for 7 days. The different letters above the bars indicate statistically significant differences between the samples (two‐way ANOVA followed by Tukey–Kramer test, P < 0.05; n ≥ 28). (C) Expression levels of DWF4 and CPD in 27‐day‐old WT and bil7‐1D plants. The results are presented as the mean ± s.d. (n = 3). Each experiment was repeated at least three times with similar results. (D) Endogenous BR content in WT, BIL7‐RNAi‐1, bil7‐1D, and BIL7‐OX1 plants. The different letters above the bars indicate statistically significant differences between the samples (one‐way ANOVA followed by Tukey–Kramer test, P < 0.05; n = 3). 6‐deoxoCT, 6‐deoxocathasterone; 6‐deoxoTE, 6‐deoxoteasterone; 6‐deoxo3DT, 3‐dehydro‐6‐deoxoteasterone; 6‐deoxoTY, 6‐deoxotyphasterol; 6‐deoxoCS, 6‐deoxocastasterone; BL, brassinolide; CS, castasterone; n.d., not detected; TY, typhasterol. Cathasterone, teasterone, and 3‐dehydroteasterone were not detected. (E) Hypocotyl length of WT and BIL7‐RNAi‐1 plants grown in the dark for 7 days on medium supplemented with Brz and/or BL. The different letters above the bars indicate statistically significant differences between the samples (three‐way ANOVA followed by Tukey–Kramer test, P < 0.05; n = 15).
Figure 2
Figure 2
BIL7 regulates inflorescence and root elongation. (A) Phenotypes of BIL7‐RNAi‐1, WT, BIL7‐OX2, bil7‐1D, and BIL7‐OX1 plants grown in soil for 63 days. Scale bars, 5 cm. (B) Inflorescence length of WT, bil7‐1D, and BIL7‐RNAi‐1 plants during development. The results are presented as the mean ± s.d. (n = 6). (C–E) Number (C), shape (D), and length (E) of epidermal cells in the primary inflorescences of 91‐day‐old WT, bil7‐1D, and BIL7‐RNAi‐1 plants. The different letters above the bars indicate statistically significant differences between the samples (one‐way ANOVA followed by Tukey–Kramer test, P < 0.05; n ≥ 28). Scale bars, 100 μm. (F–H) Root length (F) and phenotype (G) of the primary roots of 7‐day‐old plants and cell length (H) in the root transition zones of 4‐day‐old WT, bil7‐1D, and BIL7‐RNAi‐1 plants grown vertically on ½ MS medium supplemented with 1.5% sucrose and 0.4% gellan gum. The different letters above the bars indicate statistically significant differences between the samples (one‐way ANOVA followed by Tukey–Kramer test, P < 0.05; K: n ≥ 28, M: n = 42). Scale bars, 1 cm. The white lines indicate the root tips.
Figure 3
Figure 3
Changes in subcellular localization of BIL7 during different stages of development. (A, B) BIL7pro:GUS expression in 14‐day‐old plants grown in the light (A) and young inflorescences of 40‐day‐old plants (B). Scale bars, 1 mm. (C) Subcellular localization of 35S:BIL7‐GFP in epidermal cells of cotyledons and hypocotyls and in the root tips of 2‐, 4‐, or 6‐day‐old plants grown in the light. The dashed lines in the left panel indicate the source of the enlargements shown in the right panels. Scale bars, 5 μm. (D) Confocal microscopy images of BIL7‐GFP transgenic plant root stained with 4′,6‐diamidino‐2‐phenylindole (DAPI). DAPI staining indicates the location of the nuclei. Scale bars, 10 μm. (E, F) Immunoblot analyses showing that BIL7‐GFP is distributed in the nuclear fraction of 2‐day‐old seedlings (E) and microsomal fractions of 4‐day‐old seedlings (F) of WT and 35S:BIL7‐GFP plants. M, microsomal fraction; N, nuclear fraction; T, total extract. Histone H3 (E) and H+‐ATPase (F) were used as nuclear and microsomal fraction markers, respectively. Full‐scan blots are shown in Figure S16.
Figure 4
Figure 4
BIL7 interacts with BIN2 and BSU1. (A, B) Hypocotyl phenotypes (A) and hypocotyl length (B) of WT, bin2‐1, bil7‐1D bin2‐1 double‐mutant, and bil7‐1D plants germinated on medium supplemented with 3 μM Brz in the dark for 7 days. The different letters above the bars indicate statistically significant differences between the samples (one‐way ANOVA followed by Tukey–Kramer test, P < 0.05; n = 30). Scale bars, 1 mm. (C) Phenotypes of WT, bin2‐1, and bil7‐1D bin2‐1 double mutants grown in soil for 63 days. Scale bars, 5 cm. (D) Interaction of BIL7 with BIN2 and BSU1 analyzed by Y2H. –LW, synthetic dropout medium (SD) –Leu/–Trp; –LWH, SD –Leu/–Trp/–His; AD, activating domain; BD, binding domain. (E) Interaction of BIL7 with BIN2 and BSU1 analyzed by a BiFC assay in Arabidopsis suspension cells. BRI1‐nEYFP was used with BIL7‐cEYFP as a negative control. (F, G) Interaction of BIL7 with BIN2 analyzed by co‐IP in Nicotiana benthamiana leaves (F) and in Arabidopsis seedlings grown in the light for 7 days (G). (H) The interaction of BIL7 with BSU1 in N. benthamiana leaves was analyzed by co‐IP. The full‐scan blots are shown in Figure S16.
Figure 5
Figure 5
The phosphorylation status of BIL7 is regulated by BIN2 and BSU1. (A) Recombinant BIN2 phosphorylates recombinant BIL7 in an in vitro kinase assay. Maltose‐binding protein (MBP), MBP‐fused BIL1/BZR1, and MBP‐fused BIL7 were incubated in the presence (+) or absence (−) of the kinase BIN2. The top and bottom panels show the same gel stained with Pro‐Q Diamond (phosphoprotein) and SYPRO Ruby (total protein), respectively. (B) Phosphorylation status of BIL7 by BIN2 in vivo. Proteins from Nicotiana benthamiana leaves transiently transformed with the indicated constructs were immunoprecipitated with anti‐GFP antibodies, and the immunoblot was probed with phos‐tag biotin, anti‐GFP, and anti‐HA antibodies. The full‐scan blots are shown in Figure S16. (C) Phosphorylation status of BIL7 by BIN2 in vivo. Proteins from N. benthamiana leaves transiently transformed with the indicated constructs were treated with CIP, separated on a Phos‐tag SDS–PAGE gel, and detected by anti‐GFP. The slowly migrating band corresponding to BIL7 represents the phosphorylated form of BIL7 (pBIL7). The full‐scan blots are shown in Figure S15. (D) The BIN2‐induced mobility shift was eliminated in the presence of BSU1. Proteins from N. benthamiana leaves transiently transformed with the indicated constructs were separated via a Phos‐tag SDS–PAGE gel and detected via an anti‐GFP antibody. The full‐scan blots are shown in Figure S15. (E, F) 35S:GFP‐BIL7 plants were grown on 1/2 MS medium for 7 days. Confocal images (E) and quantification of the ratio of nuclear and plasma membrane fluorescence signal intensities (F) of 35S:GFP‐BIL7 treated with 50 μM bikinin or DMSO (mock control) for 1 h. Scale bars, 5 μm. Thirty cells in 3 roots were tested for each dataset. Asterisks indicate a significant difference according to Student's t‐test (**P < 0.01). (G, H) Confocal images (G) and quantification of the ratio of nuclear and cytosolic fluorescence signal intensities (H) of 35S:BIL7‐GFP plants pretreated with 50 μM CHX for 30 min and subsequently treated with 50 μM CHX and 60 μM bikinin or DMSO (mock) for 15 min. Scale bars, 10 μm. The results are presented as the mean ± s.e. (n = 63 cells). Asterisks indicate a significant difference according to Student's t‐test (***P < 0.001).
Figure 6
Figure 6
BIL7 interacts with BIL1/BZR1. (A) Confocal images of BIL7‐GFP/GFP‐BIL7 localization in the root tips of BIL7pro:BIL7‐GFP and 35S:GFP‐BIL7 plants. Yellow arrows indicate the transition zone between the meristematic zone and the elongation zone of the roots. Arrowheads indicate nuclei with representative GFP signals in the root transition zone. Scale bars, 50 μm. (B) Y2H analysis of the interaction between BIL7 and BIL1/BZR1. (C) BiFC analysis of Arabidopsis suspension cells showing the interaction between BIL7 and BIL1/BZR1. BRI1‐nEYFP was used with BIL7‐cEYFP as a negative control. Scale bars, 10 μm. (D) co‐IP analysis of the interaction between BIL7 and BIL1/BZR1 in Nicotiana benthamiana leaves. P‐BIL1: phosphorylated BIL1/BZR1. Full‐scan blots are shown in Figure S16.
Figure 7
Figure 7
BIL7 is involved in nuclear accumulation and increased levels of the dephosphorylated form of BIL1/BZR1. (A, B) Effect of BIL7 on the nuclear accumulation of BIL1/BZR1‐GFP. Fluorescence intensities in roots of WT, bil7‐1D, and BIL7‐RNAi plants harboring BIL1/BZR1‐GFP grown on 1/2 MS medium supplemented with 1 μM Brz for 4 days. Confocal images (A) and quantification of the nuclear fluorescence signal intensity (B). Scale bars, 20 μm. Different letters denote significant differences (P < 0.05) based on the Tukey–Kramer test. Thirty cells in 3 roots were tested for each dataset. (C) Transgenic seedlings harboring BIL1/BZR1‐GFP were grown on 1/2 MS medium supplemented with 1 μM Brz for 21 days. The phosphorylation status of BIL1/BZR1 in WT, bil7‐1D, and BIL7‐RNAi seedlings treated with 25 μM bikinin or DMSO (mock) for 5 min, as determined by immunoblot analysis using an anti‐GFP antibody. The signal intensities of phosphorylated and dephosphorylated BIL1/BZR1, indicated by arrowheads, are presented as the percentage relative to phosphorylated BIL1/BZR1 in WT plants subjected to DMSO treatment (upper panel). Relative ratio of dephosphorylated BIL1/BZR1 to phosphorylated BIL1/BZR1 (middle panel). The Ponceau‐stained membrane is shown as a loading control (bottom panel). pBIL1: phosphorylated BIL1/BZR1. The full‐scan blots are shown in Figure S16. (D, E) BIL7 promotes hypocotyl elongation in bil1‐1D plants grown on a medium containing Brz in the dark. Hypocotyl phenotypes (D) and hypocotyl lengths (E) of WT, bil7‐1D, bil1‐1D, and bil7‐1D×bil1‐1D seedlings grown on medium supplemented with 3 μM Brz in the dark for 7 days (one‐way ANOVA followed by Tukey–Kramer test, P < 0.05; n ≥ 32).
Figure 8
Figure 8
A working model of how BIL7 enhances plant growth through regulation of BIL1/BZR1. (A) In the absence of BR, BIN2 phosphorylates BIL7. BIN2‐induced phosphorylation of BIL7 controls its extranuclear localization. (B) In the presence of bikinin, inhibition of BIN2 suppresses phosphorylation of BIL7, prompting dissociation of BIL7 from the plasma membrane, thereby facilitating interaction with the transcription factor BIL1/BZR1. (C) BIL7 localizes to the nucleus and/or stabilizes within the nucleus. BIL7 promotes the accumulation of BIL1/BZR1 in the nucleus. High accumulation of BIL1/BZR1 enhances plant growth. P indicates protein phosphorylation.

References

    1. Alexandersson, E. , Saalbach, G. , Larsson, C. & Kjellbom, P. (2004) Arabidopsis plasma membrane proteomics identifies components of transport, signal transduction and membrane trafficking. Plant & Cell Physiology, 45, 1543–1556. - PubMed
    1. Asami, T. , Min, Y.K. , Nagata, N. , Yamagishi, K. , Takatsuto, S. , Fujioka, S. et al. (2000) Characterization of brassinazole, a triazole‐type brassinosteroid biosynthesis inhibitor. Plant Physiology, 123, 93–100. - PMC - PubMed
    1. Asami, T. , Nakano, T. , Nakashita, H. , Sekimata, K. , Shimada, Y. & Yoshida, S. (2003) The influence of chemical genetics on plant science: shedding light on functions and mechanism of action of brassinosteroids using biosynthesis inhibitors. Journal of Plant Growth Regulation, 22, 336–349. - PubMed
    1. Asami, T. & Yoshida, S. (1999) Brassinosteroid biosynthesis inhibitors. Trends in Plant Science, 4, 348–353. - PubMed
    1. Beemster, G.T. , Fiorani, F. & Inzé, D. (2003) Cell cycle: the key to plant growth control? Trends in Plant Science, 8, 154–158. - PubMed

MeSH terms