. 2024 Dec 20;4(12):e0003023.
doi: 10.1371/journal.pgph.0003023. eCollection 2024.

"The COVID-19 pandemic in BRICS: Milestones, interventions, and molecular epidemiology"

Affiliations

"The COVID-19 pandemic in BRICS: Milestones, interventions, and molecular epidemiology"

Stephanie van Wyk et al. PLOS Glob Public Health. .

Abstract

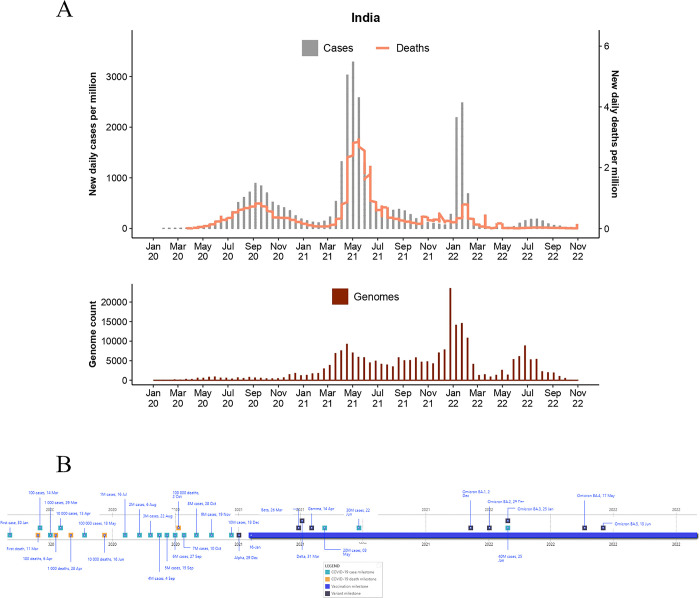
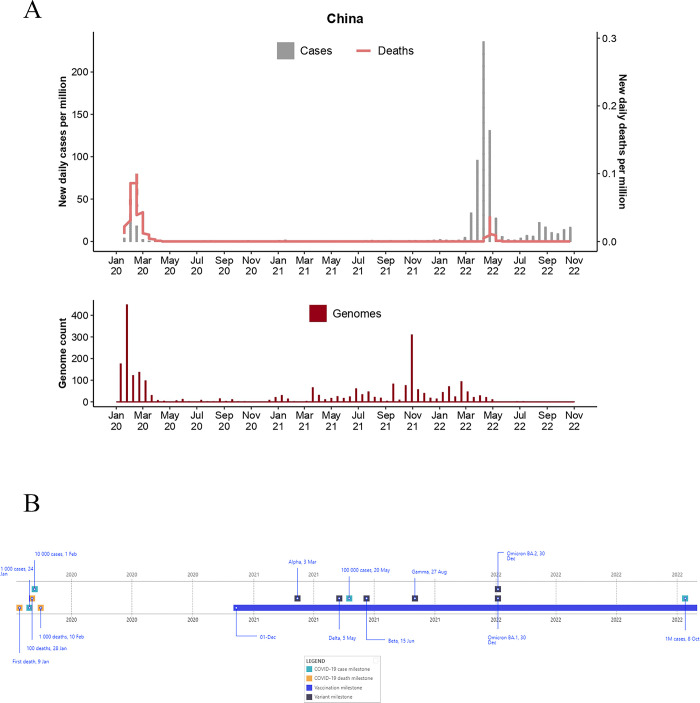
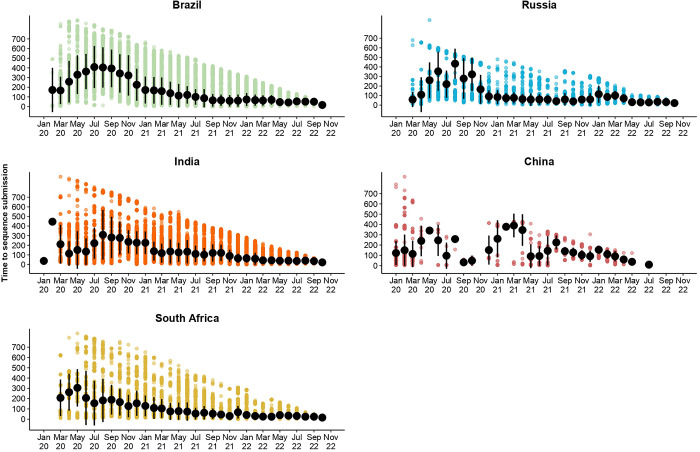
Brazil, Russia, India, China, and South Africa (BRICS) are a group of developing countries with shared economic, healthcare, and scientific interests. These countries navigate multiple syndemics, and the COVID-19 pandemic placed severe strain on already burdened BRICS' healthcare systems, hampering effective pandemic interventions. Genomic surveillance and molecular epidemiology remain indispensable tools for facilitating informed pandemic intervention. To evaluate the combined manner in which the pandemic unfolded in BRICS countries, we reviewed the BRICS pandemic epidemiological and genomic milestones, which included the first reported cases and deaths, and pharmaceutical and non-pharmaceutical interventions implemented in these countries. To assess the development of genomic surveillance capacity and efficiency over the pandemic, we analyzed the turnaround time from sample collection to data availability and the technologies used for genomic analysis. This data provided information on the laboratory capacities that enable the detection of emerging SARS-CoV-2 variants and highlight their potential for monitoring other pathogens in ongoing public health efforts. Our analyses indicated that BRICS suffered >105.6M COVID-19 infections, resulting in >1.7M deaths. BRICS countries detected intricate genetic combinations of SARS-CoV-2 variants that fueled country-specific pandemic waves. BRICS' genomic surveillance programs enabled the identification and characterization of the majority of globally circulating Variants of Concern (VOCs) and their descending lineages. Pandemic intervention strategies first implemented by BRICS countries included non-pharmaceutical interventions during the onset of the pandemic, such as nationwide lockdowns, quarantine procedures, the establishment of fever clinics, and mask mandates- which were emulated internationally. Vaccination rollout strategies complemented this, some representing the first of their kind. Improvements in BRICS sequencing and data generation turnaround time facilitated quicker detection of circulating and emerging variants, supported by investments in sequencing and bioinformatic infrastructure. Intra-BRICS cooperation contributed to the ongoing intervention in COVID-19 and other pandemics, enhancing collective capabilities in addressing these health challenges. The data generated continues to inform BRICS-centric pandemic intervention strategies and influences global health matters. The increased laboratory and bioinformatic capacity post-COVID-19 will support the detection of emerging pathogens.


Conflict of interest statement

The authors have declared that no competing interests exist.

Figures

Fig 1
Fig 1
Epidemiological curve (top) and total genome assemblies (bottom) generated and deposited on GISAID by BRICS country Brazil. The graphs illustrate the daily number of COVID-19 cases (bars) and associated deaths (line graph) for BRICS countries from January 2020 to 31 October 2022 (accessed from the COVID-19 Data Repository by the Centre for Systems Science and Engineering at John Hopkins University and retrieved through Our World In Data (OWID; https://ourworldindata.org/) and genomic data were retrieved from Global Initiative on Sharing Avian Influenza Data (GISAID; https://www.gisaid.org/). B) Pandemic timeline illustration of the milestones for BRICS countries during the pandemic timeline (1 January 2020 to 31 October 2022) (accessed from the COVID-19 Data Repository by the Centre for Systems Science and Engineering at John Hopkins University and retrieved through OWID.
Fig 2
Fig 2
Epidemiological curve (top) and total genome assemblies (bottom) generated and deposited on GISAID by BRICS country Russia. The graphs illustrate the daily number of COVID-19 cases (bars) and associated deaths (line graph) for BRICS countries from January 2020 to 31 October 2022 (accessed from the COVID-19 Data Repository by the Centre for Systems Science and Engineering at John Hopkins University and retrieved through Our World In Data (OWID; https://ourworldindata.org/) and genomic data were retrieved from Global Initiative on Sharing Avian Influenza Data (GISAID; https://www.gisaid.org/). B) Pandemic timeline illustration of the milestones for BRICS countries during the pandemic timeline (1 January 2020 to 31 October 2022) (accessed from the COVID-19 Data Repository by the Centre for Systems Science and Engineering at John Hopkins University and retrieved through OWID.
Fig 3
Fig 3
Epidemiological curve (top) and total genome assemblies (bottom) generated and deposited on GISAID by BRICS country India. The graphs illustrate the daily number of COVID-19 cases (bars) and associated deaths (line graph) for BRICS countries from January 2020 to 31 October 2022 (accessed from the COVID-19 Data Repository by the Centre for Systems Science and Engineering at John Hopkins University and retrieved through Our World In Data (OWID; https://ourworldindata.org/) and genomic data were retrieved from Global Initiative on Sharing Avian Influenza Data (GISAID; https://www.gisaid.org/). B) Pandemic timeline illustration of the milestones for BRICS countries during the pandemic timeline (1 January 2020 to 31 October 2022) (accessed from the COVID-19 Data Repository by the Centre for Systems Science and Engineering at John Hopkins University and retrieved through OWID.
Fig 4
Fig 4
Epidemiological curve (top) and total genome assemblies (bottom) generated and deposited on GISAID by BRICS country China. The graphs illustrate the daily number of COVID-19 cases (bars) and associated deaths (line graph) for BRICS countries from January 2020 to 31 October 2022 (accessed from the COVID-19 Data Repository by the Centre for Systems Science and Engineering at John Hopkins University and retrieved through Our World In Data (OWID; https://ourworldindata.org/) and genomic data were retrieved from Global Initiative on Sharing Avian Influenza Data (GISAID; https://www.gisaid.org/). B) Pandemic timeline illustration of the milestones for BRICS countries during the pandemic timeline (1 January 2020 to 31 October 2022) (accessed from the COVID-19 Data Repository by the Centre for Systems Science and Engineering at John Hopkins University and retrieved through OWID.
Fig 5
Fig 5
Epidemiological curve (top) and total genome assemblies (bottom) generated and deposited on GISAID by BRICS country South Africa. The graphs illustrate the daily number of COVID-19 cases (bars) and associated deaths (line graph) for BRICS countries from January 2020 to 31 October 2022 (accessed from the COVID-19 Data Repository by the Centre for Systems Science and Engineering at John Hopkins University and retrieved through Our World In Data (OWID; https://ourworldindata.org/) and genomic data were retrieved from Global Initiative on Sharing Avian Influenza Data (GISAID; https://www.gisaid.org/). B) Pandemic timeline illustration of the milestones for BRICS countries during the pandemic timeline (1 January 2020 to 31 October 2022) (accessed from the COVID-19 Data Repository by the Centre for Systems Science and Engineering at John Hopkins University and retrieved through OWID.
Fig 6
Fig 6. Schematic representation of the changes in the genetic compositions of SARS-CoV-2 lineages recorded for BRICS countries for 1 January 2020 to 31 October 2022.
Fig 7
Fig 7. Graphical summary of the average number of days (+- SD) from sample collection to sequence submission to GISAID for the BRICS countries.
The results are illustrated per month recorded for BRICS countries from 1 January 2020 to 31 October 2022.
Fig 8
Fig 8. Illustration of the total proportions of sequencing platforms used by BRICS countries to produce SARS-CoV-2 whole-genome sequences submitted to GISAID (1 January 2020 to 31 October 2022).

References

    1. Coronavirus Pandemic (COVID-19)—Our World in Data [Internet]. 2022. The Oxford Martin Programme on Global Development, University of Oxford, Oxford: [cited 2022 Mar 24]. Available from: https://ourworldindata.org/coronavirus.
    1. Sharif N, Dey SK. Impact of population density and weather on COVID-19 pandemic and SARS-CoV-2 mutation frequency in Bangladesh. Epidemiol Infect. 2021. Jan 7;149:e16. doi: 10.1017/S0950268821000029 . - DOI - PMC - PubMed
    1. Zhu J, Yan W, Zhu L, Liu J. COVID-19 pandemic in BRICS countries and its association with socio-economic and demographic characteristics, health vulnerability, resources, and policy response. Infect Dis Poverty. 2021. Jul 8;10(1):97. doi: 10.1186/s40249-021-00881-w . - DOI - PMC - PubMed
    1. Mehta A, Kumar Ratre Y, Sharma K, Soni VK, Tiwari AK, Singh RP, et al.. Interplay of Nutrition and Psychoneuroendocrineimmune Modulation: Relevance for COVID-19 in BRICS nations. Front Microbiol. 2021. Dec 17;12:769884. doi: 10.3389/fmicb.2021.769884 . - DOI - PMC - PubMed
    1. Stuikyte R, Barbosa I, Kazatchkine M. Getting to grips with the HIV epidemic in Russia. Curr Opin HIV AIDS. 2019. Sep;14(5):381–6. doi: 10.1097/COH.0000000000000573 . - DOI - PubMed

LinkOut - more resources