

Epithelial tubule interconnection driven by HGF-Met signaling in the kidney
- PMID: 39705305
- PMCID: PMC11670081
- DOI: 10.1073/pnas.2416887121
Epithelial tubule interconnection driven by HGF-Met signaling in the kidney
Abstract
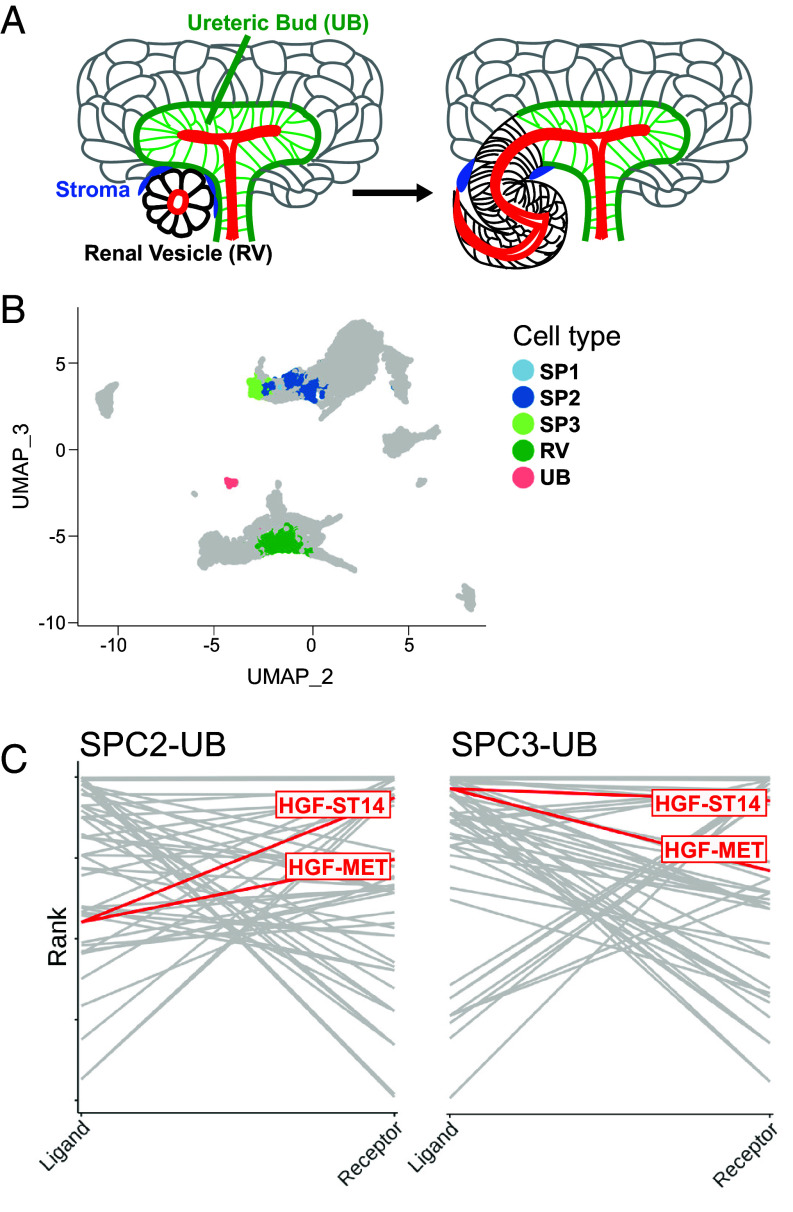
The formation of functional epithelial tubules is critical for the development and maintenance of many organ systems. While the mechanisms of tubule formation by epithelial cells are well studied, the process of tubule anastomosis-where tubules connect to form a continuous network-remains poorly understood. In this study, we utilized single-cell RNA sequencing to analyze embryonic mouse kidney tubules undergoing anastomosis. Our analysis identified hepatocyte growth factor (HGF) as a key potential mediator of this process. To investigate this further, we developed an assay using epithelial spheroids with fluorescently tagged apical surfaces, allowing us to visualize and quantify tubule-tubule connections. Our results demonstrate that HGF promotes tubule anastomosis, and it does so through the MAPK signaling pathway and MMPs, independently of cell proliferation. Remarkably, treatment with HGF and collagenase was sufficient to induce tubule anastomosis in embryonic mouse kidneys. These findings provide a foundational understanding of how to enhance the formation of functional tubular networks. This has significant clinical implications for the use of in vitro-grown kidney tissues in transplant medicine, potentially improving the success and integration of transplanted tissues.
Keywords: epithelial tubule; hepatocyte growth factor; tubule anastomosis.
Conflict of interest statement
Competing interests statement:The authors declare no competing interest.
Figures


Update of
-
Epithelial tubule interconnection driven by HGF-Met signaling in the kidney.bioRxiv [Preprint]. 2024 Jun 3:2024.06.03.597185. doi: 10.1101/2024.06.03.597185. bioRxiv. 2024. Update in: Proc Natl Acad Sci U S A. 2024 Dec 24;121(52):e2416887121. doi: 10.1073/pnas.2416887121. PMID: 38895378 Free PMC article. Updated. Preprint.
Similar articles
-
Epithelial tubule interconnection driven by HGF-Met signaling in the kidney.bioRxiv [Preprint]. 2024 Jun 3:2024.06.03.597185. doi: 10.1101/2024.06.03.597185. bioRxiv. 2024. Update in: Proc Natl Acad Sci U S A. 2024 Dec 24;121(52):e2416887121. doi: 10.1073/pnas.2416887121. PMID: 38895378 Free PMC article. Updated. Preprint.
-
Prescription of Controlled Substances: Benefits and Risks.2025 Jul 6. In: StatPearls [Internet]. Treasure Island (FL): StatPearls Publishing; 2025 Jan–. 2025 Jul 6. In: StatPearls [Internet]. Treasure Island (FL): StatPearls Publishing; 2025 Jan–. PMID: 30726003 Free Books & Documents.
-
GDNF enhances HGF-induced tubulogenesis and organization of Sertoli cell.J Assist Reprod Genet. 2025 Jun;42(6):2083-2098. doi: 10.1007/s10815-025-03493-7. Epub 2025 May 22. J Assist Reprod Genet. 2025. PMID: 40402398 Free PMC article.
-
Management of urinary stones by experts in stone disease (ESD 2025).Arch Ital Urol Androl. 2025 Jun 30;97(2):14085. doi: 10.4081/aiua.2025.14085. Epub 2025 Jun 30. Arch Ital Urol Androl. 2025. PMID: 40583613 Review.
-
Fabricating mice and dementia: opening up relations in multi-species research.In: Jenkins N, Jack-Waugh A, Ritchie L, editors. Multi-Species Dementia Studies. Bristol (UK): Bristol University Press; 2025 Feb 25. Chapter 2. In: Jenkins N, Jack-Waugh A, Ritchie L, editors. Multi-Species Dementia Studies. Bristol (UK): Bristol University Press; 2025 Feb 25. Chapter 2. PMID: 40690569 Free Books & Documents. Review.
References
-
- Nyengaard J. R., Bendtsen T. F., Glomerular number and size in relation to age, kidney weight, and body surface in normal man. Anat. Rec. 232, 194–201 (1992). - PubMed
-
- Evan A. P., Tanner G. A., Proximal tubule morphology after single nephron obstruction in the rat kidney. Kidney Int. 30, 818–827 (1986). - PubMed
-
- Nishinakamura R., Advances and challenges toward developing kidney organoids for clinical applications. Cell Stem Cell 30, 1017–1027 (2023). - PubMed
MeSH terms
Substances
Grants and funding
- UC2 DK126021/DK/NIDDK NIH HHS/United States
- UC2DK126021/HHS | NIH | National Institute of Diabetes and Digestive and Kidney Diseases (NIDDK)
- RC2 DK125960/DK/NIDDK NIH HHS/United States
- R01 DK118032/DK/NIDDK NIH HHS/United States
- R01 DK127634/DK/NIDDK NIH HHS/United States
- P30 DK079328/DK/NIDDK NIH HHS/United States
- P30DK079328/HHS | NIH | National Institute of Diabetes and Digestive and Kidney Diseases (NIDDK)
- R01DK118032/HHS | NIH | National Institute of Diabetes and Digestive and Kidney Diseases (NIDDK)
- RC2DK125960/HHS | NIH | National Institute of Diabetes and Digestive and Kidney Diseases (NIDDK)
- F31 DK129031/DK/NIDDK NIH HHS/United States
- P20 GM103423/GM/NIGMS NIH HHS/United States
- P20 GM104318/GM/NIGMS NIH HHS/United States
- P30 GM154610/GM/NIGMS NIH HHS/United States
LinkOut - more resources
Full Text Sources
Miscellaneous
