. 2024 Dec 24;121(52):e2422020121.
doi: 10.1073/pnas.2422020121. Epub 2024 Dec 20.

MINFLUX fluorescence nanoscopy in biological tissue

Affiliations

MINFLUX fluorescence nanoscopy in biological tissue

Thea Moosmayer et al. Proc Natl Acad Sci U S A. .

Abstract

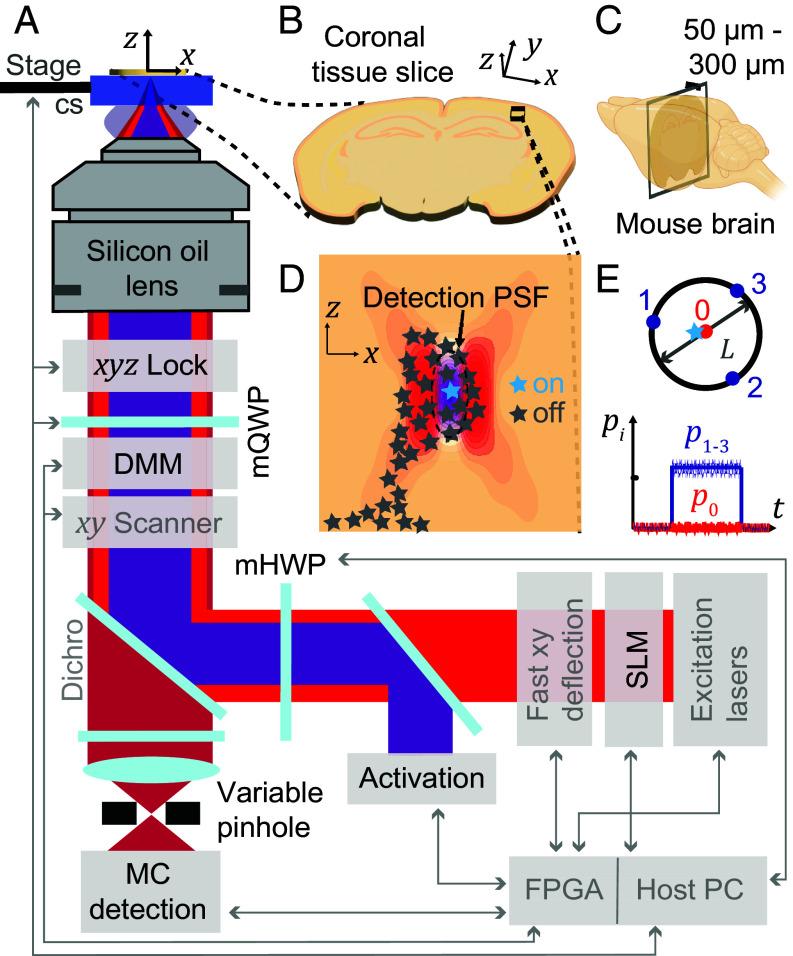
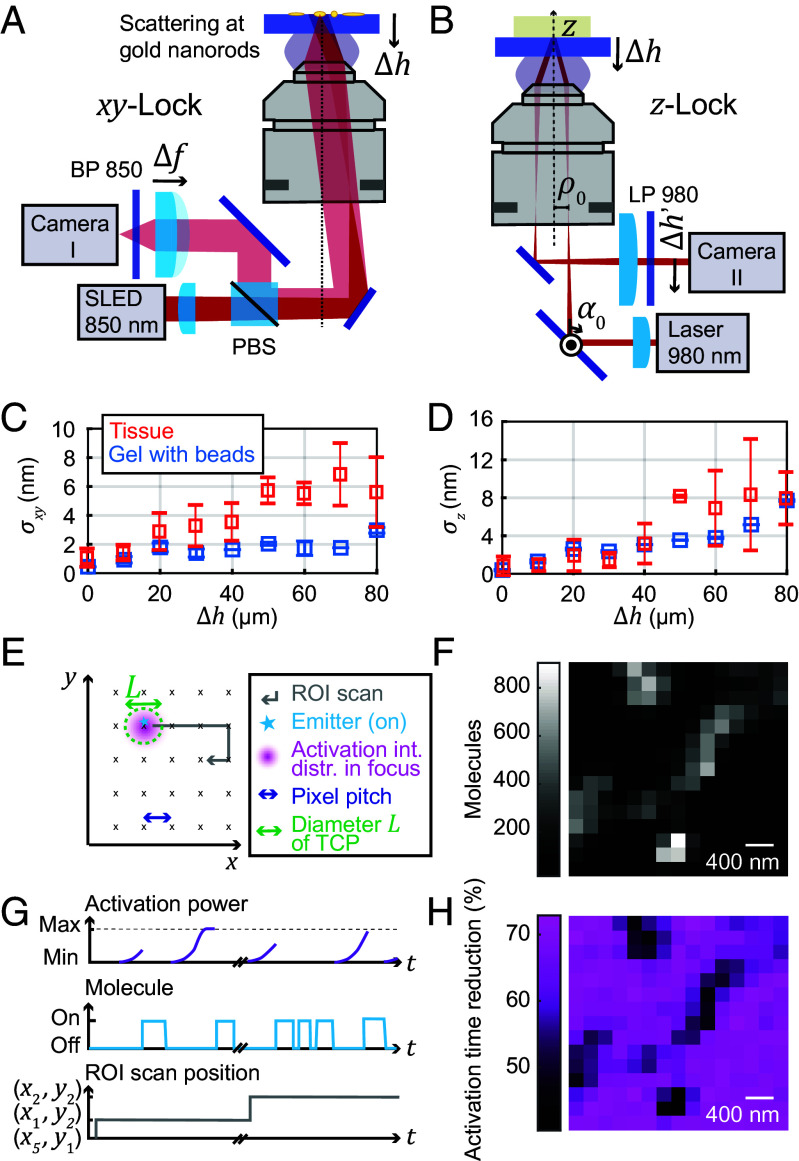
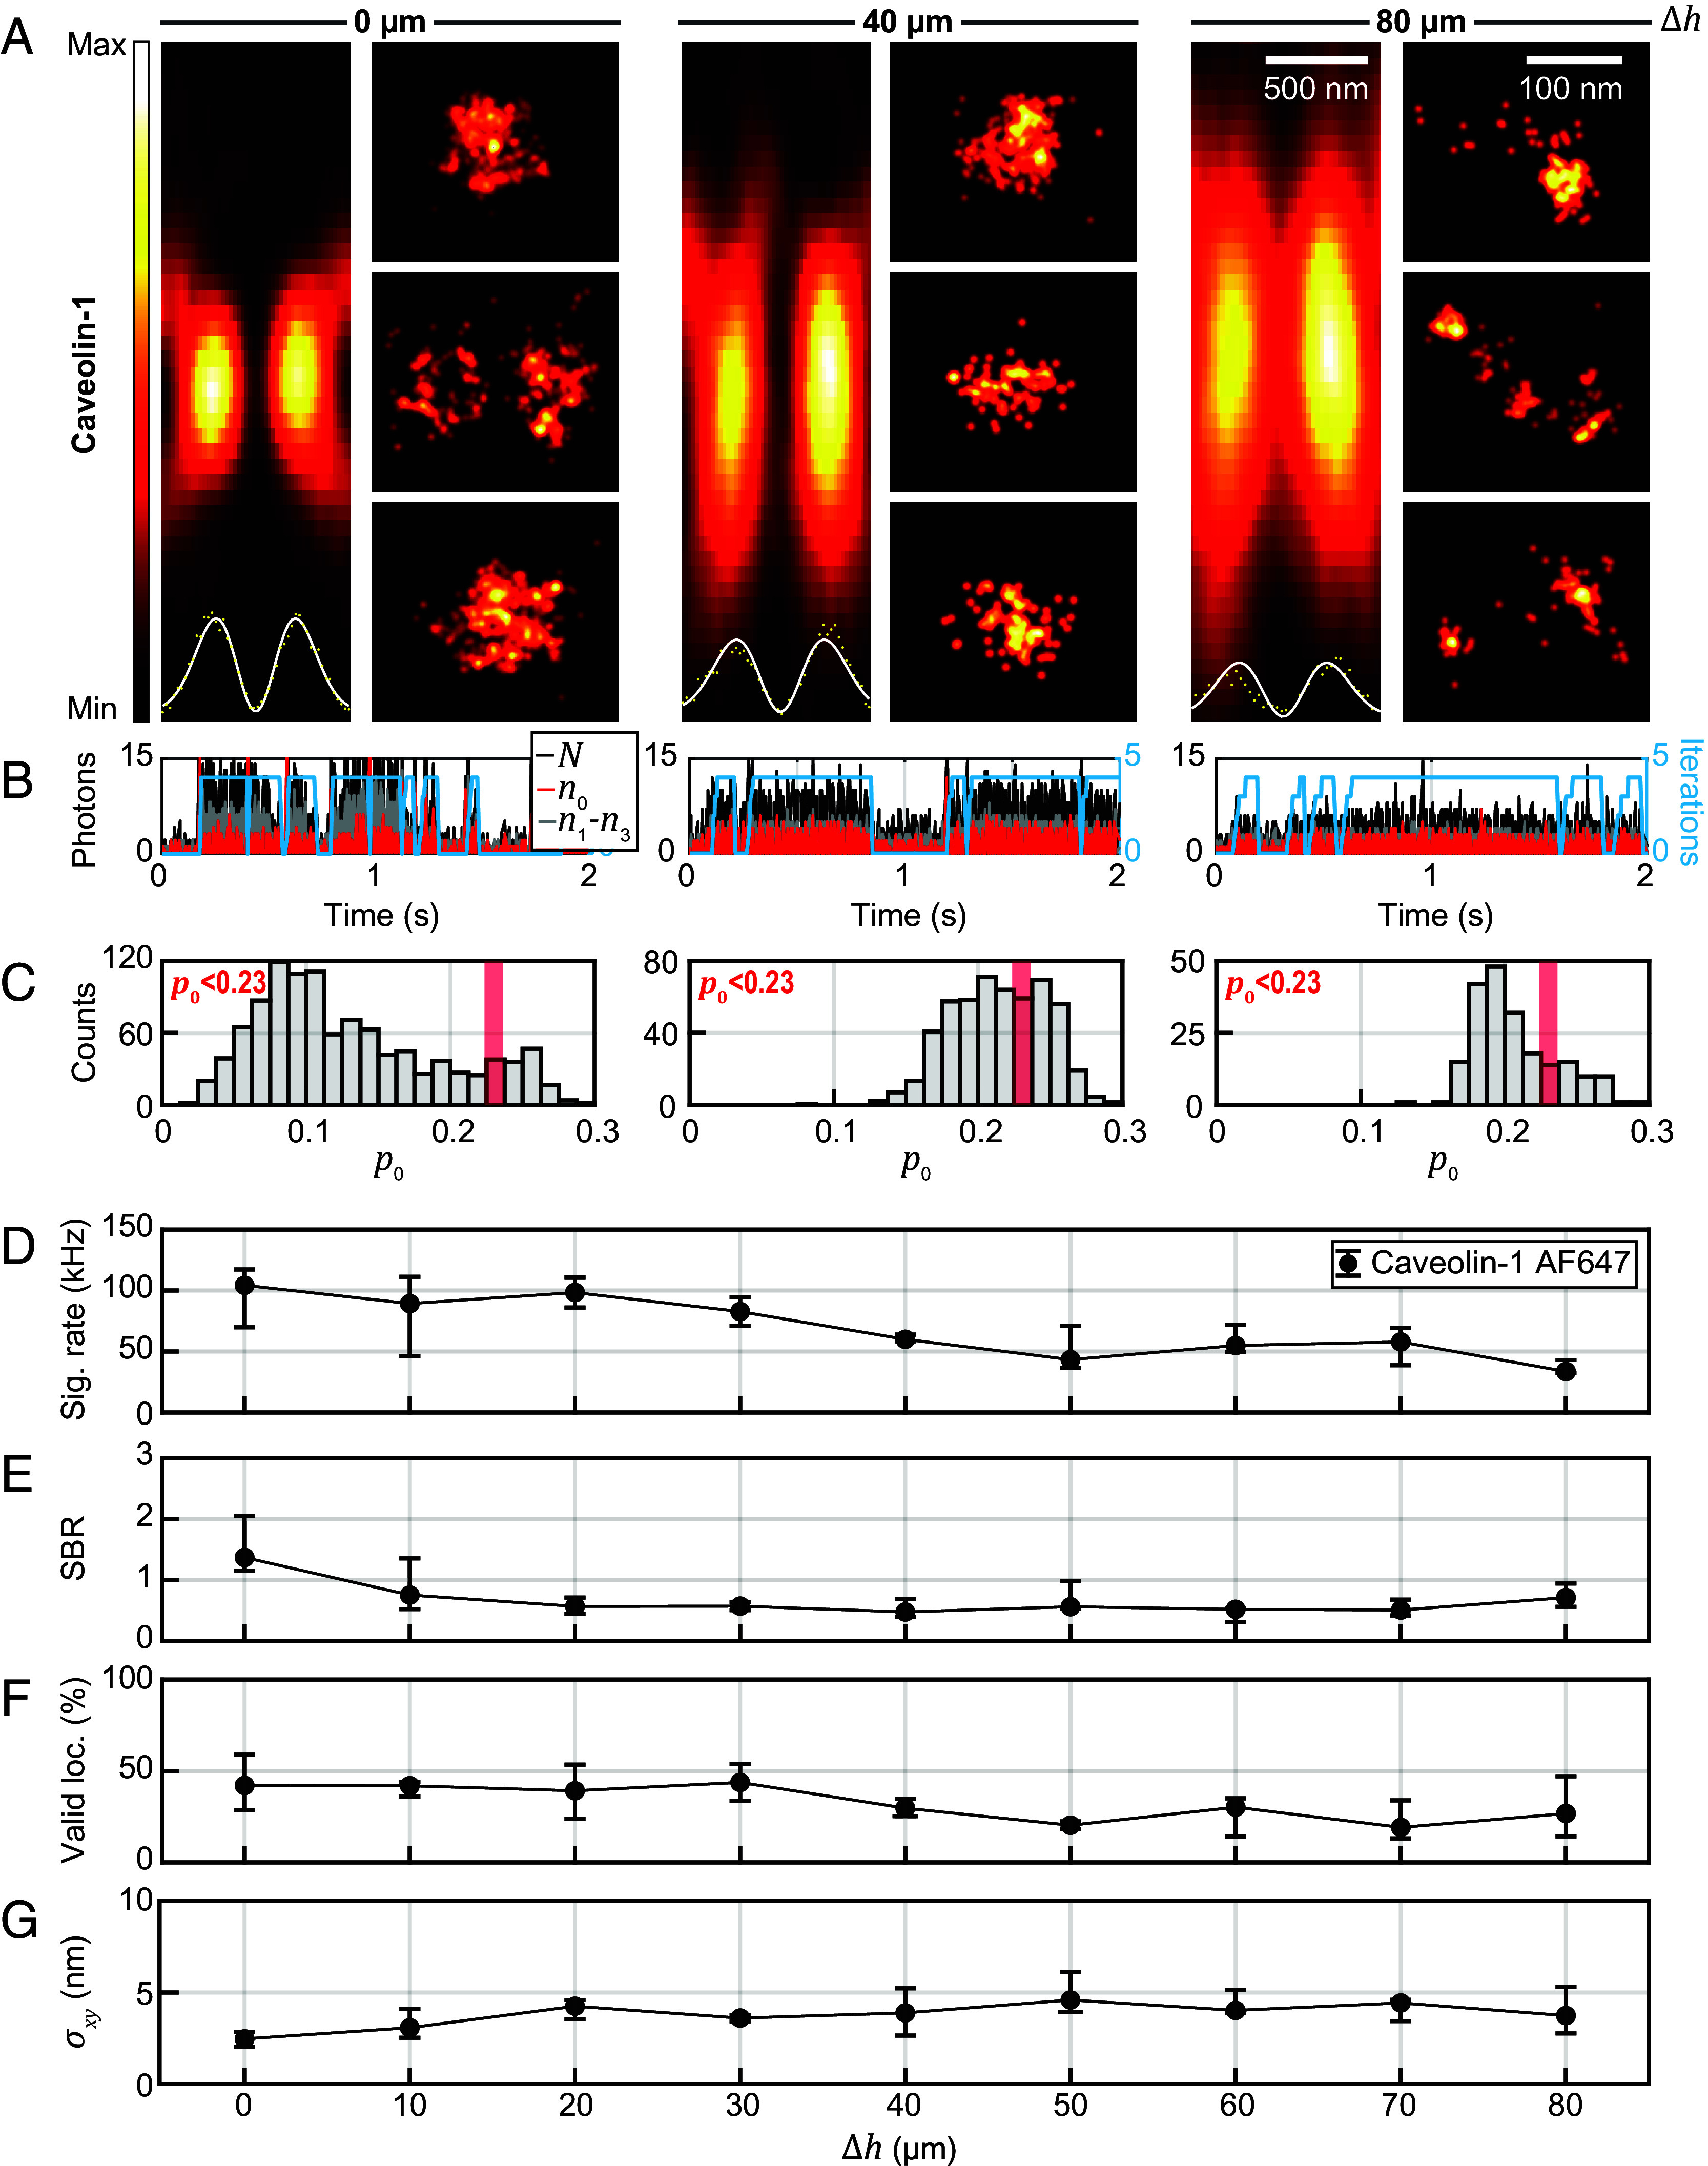
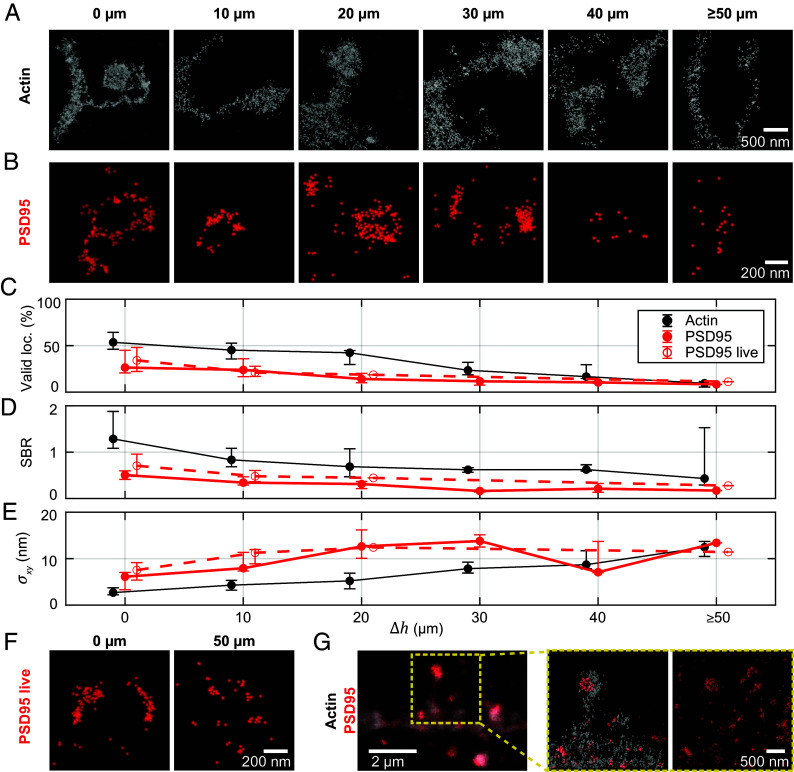
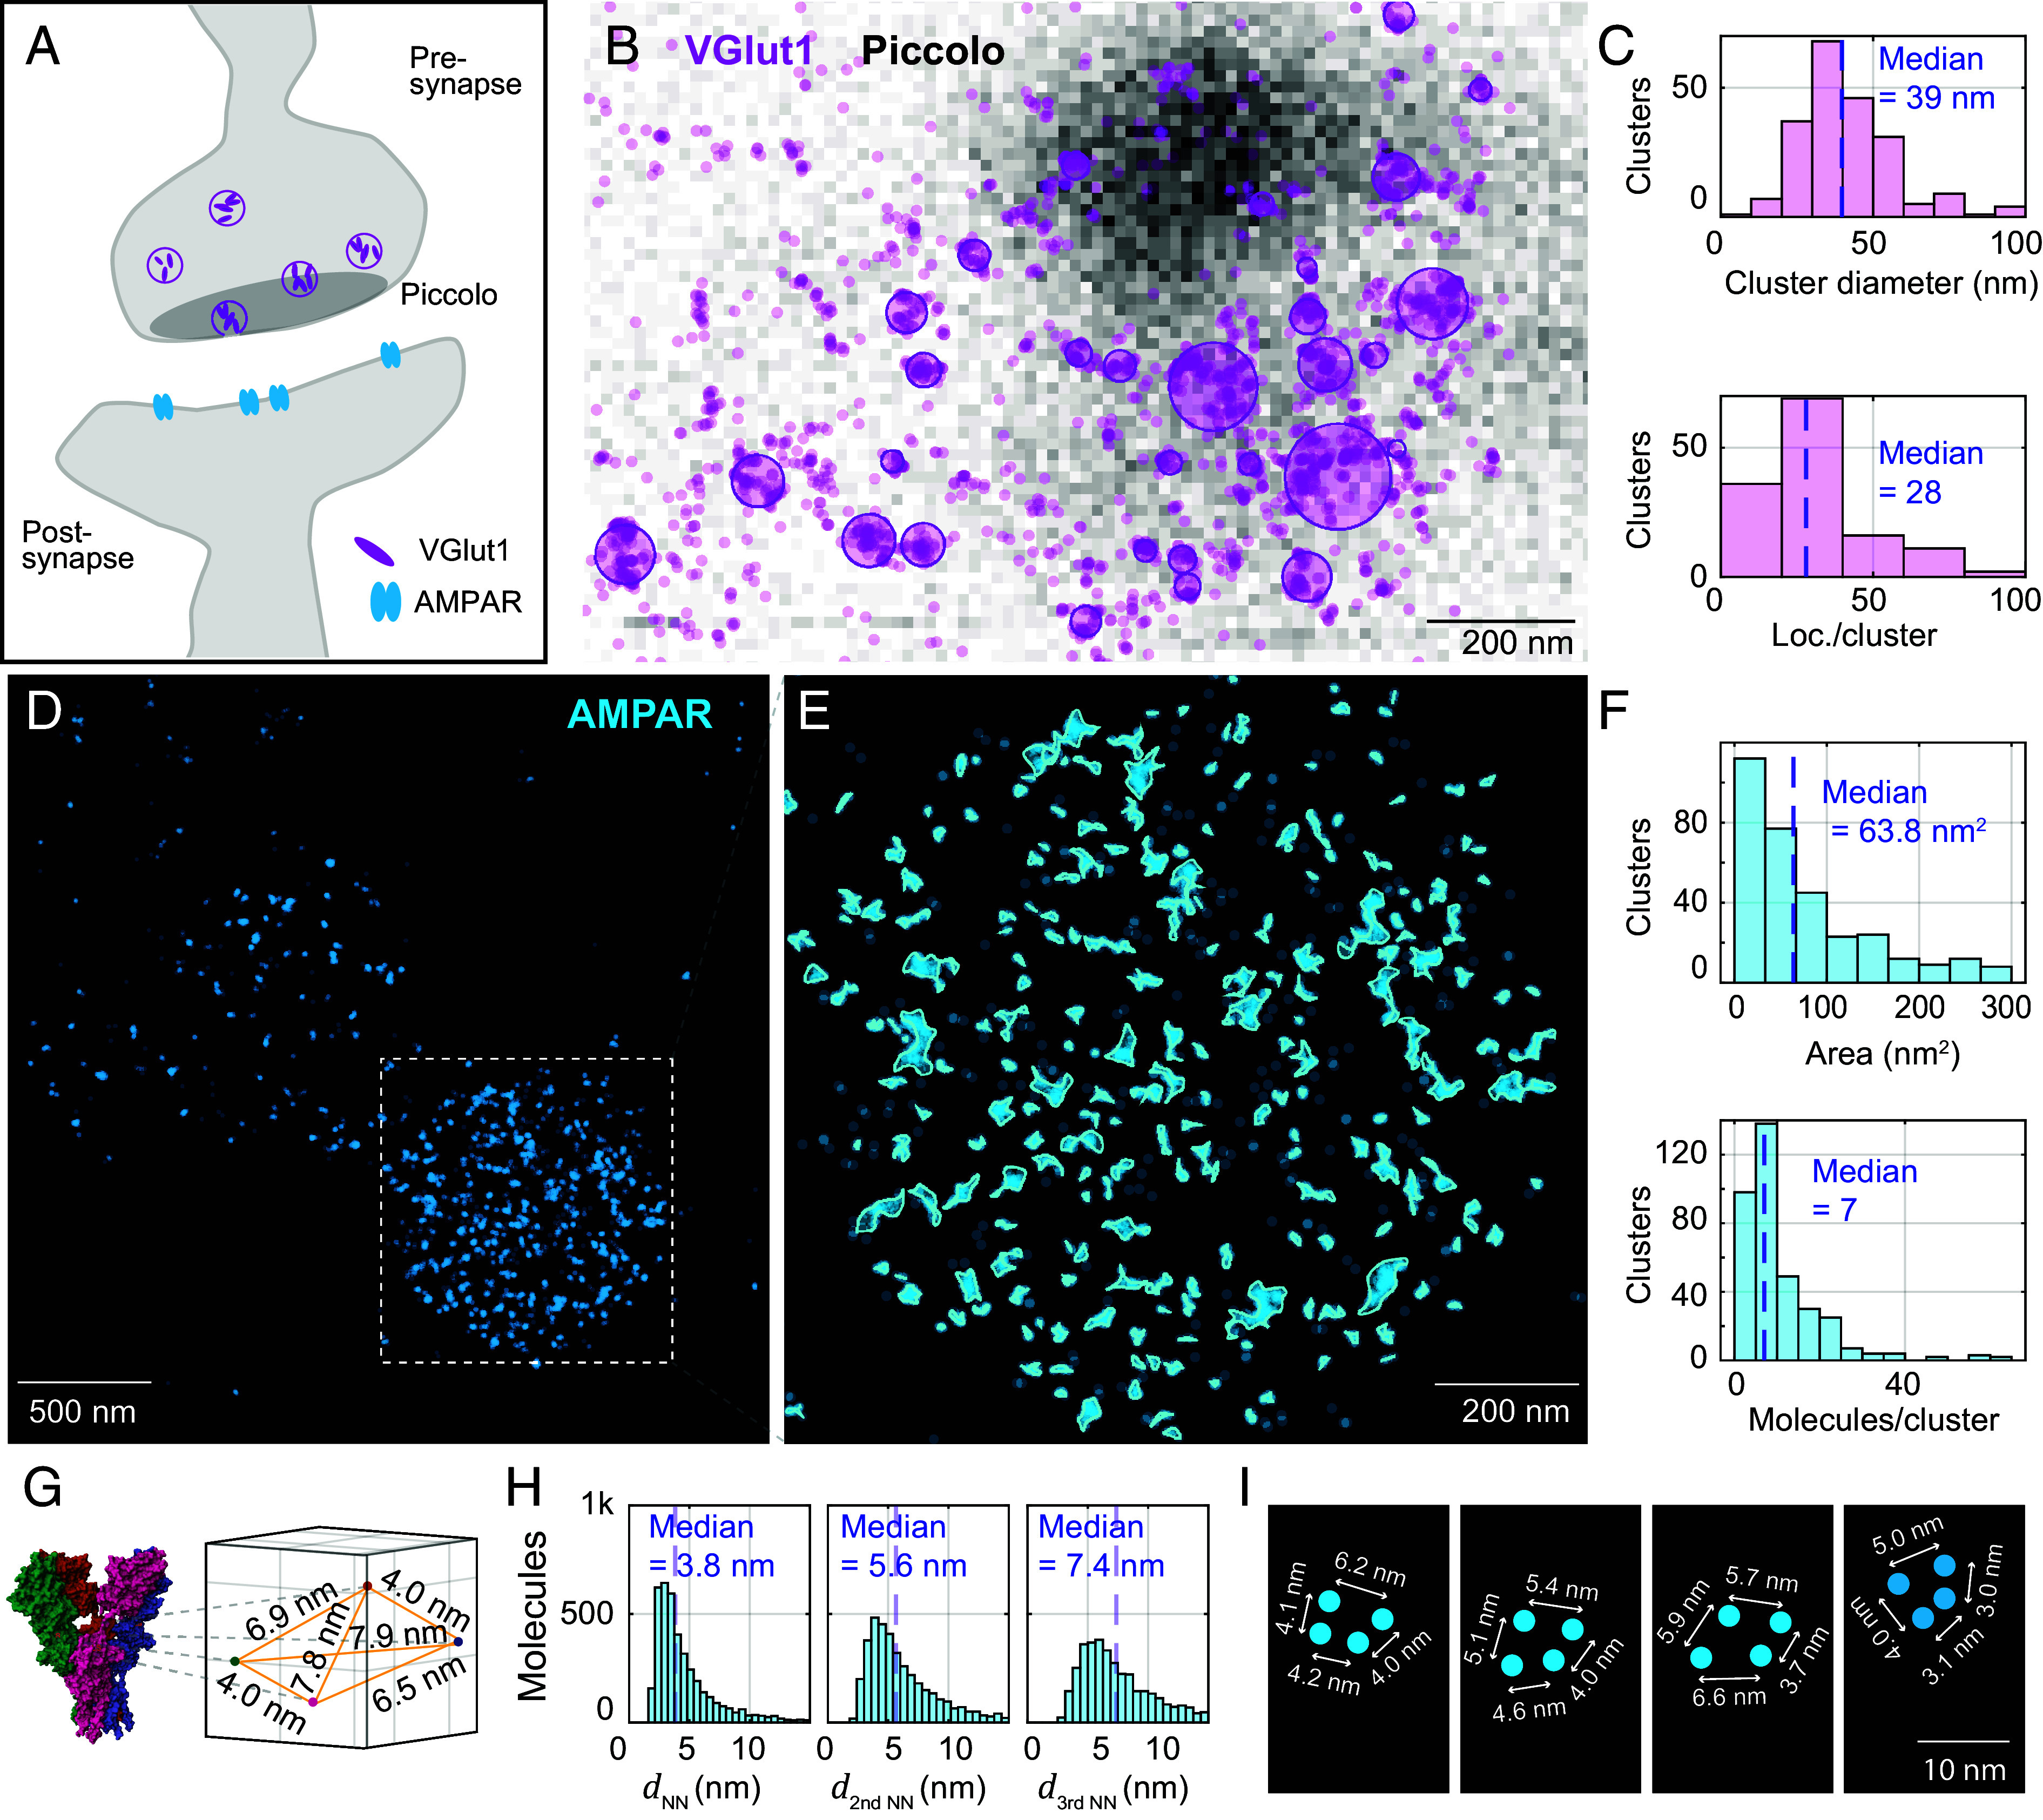
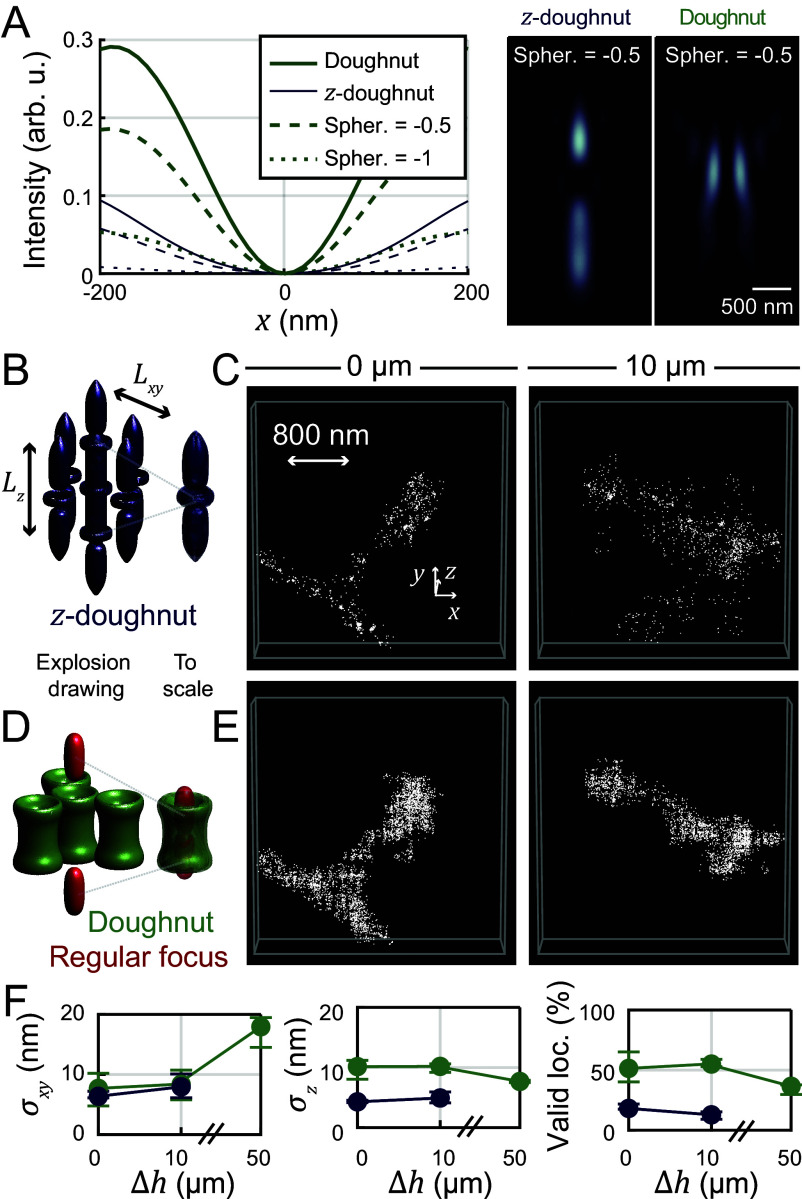
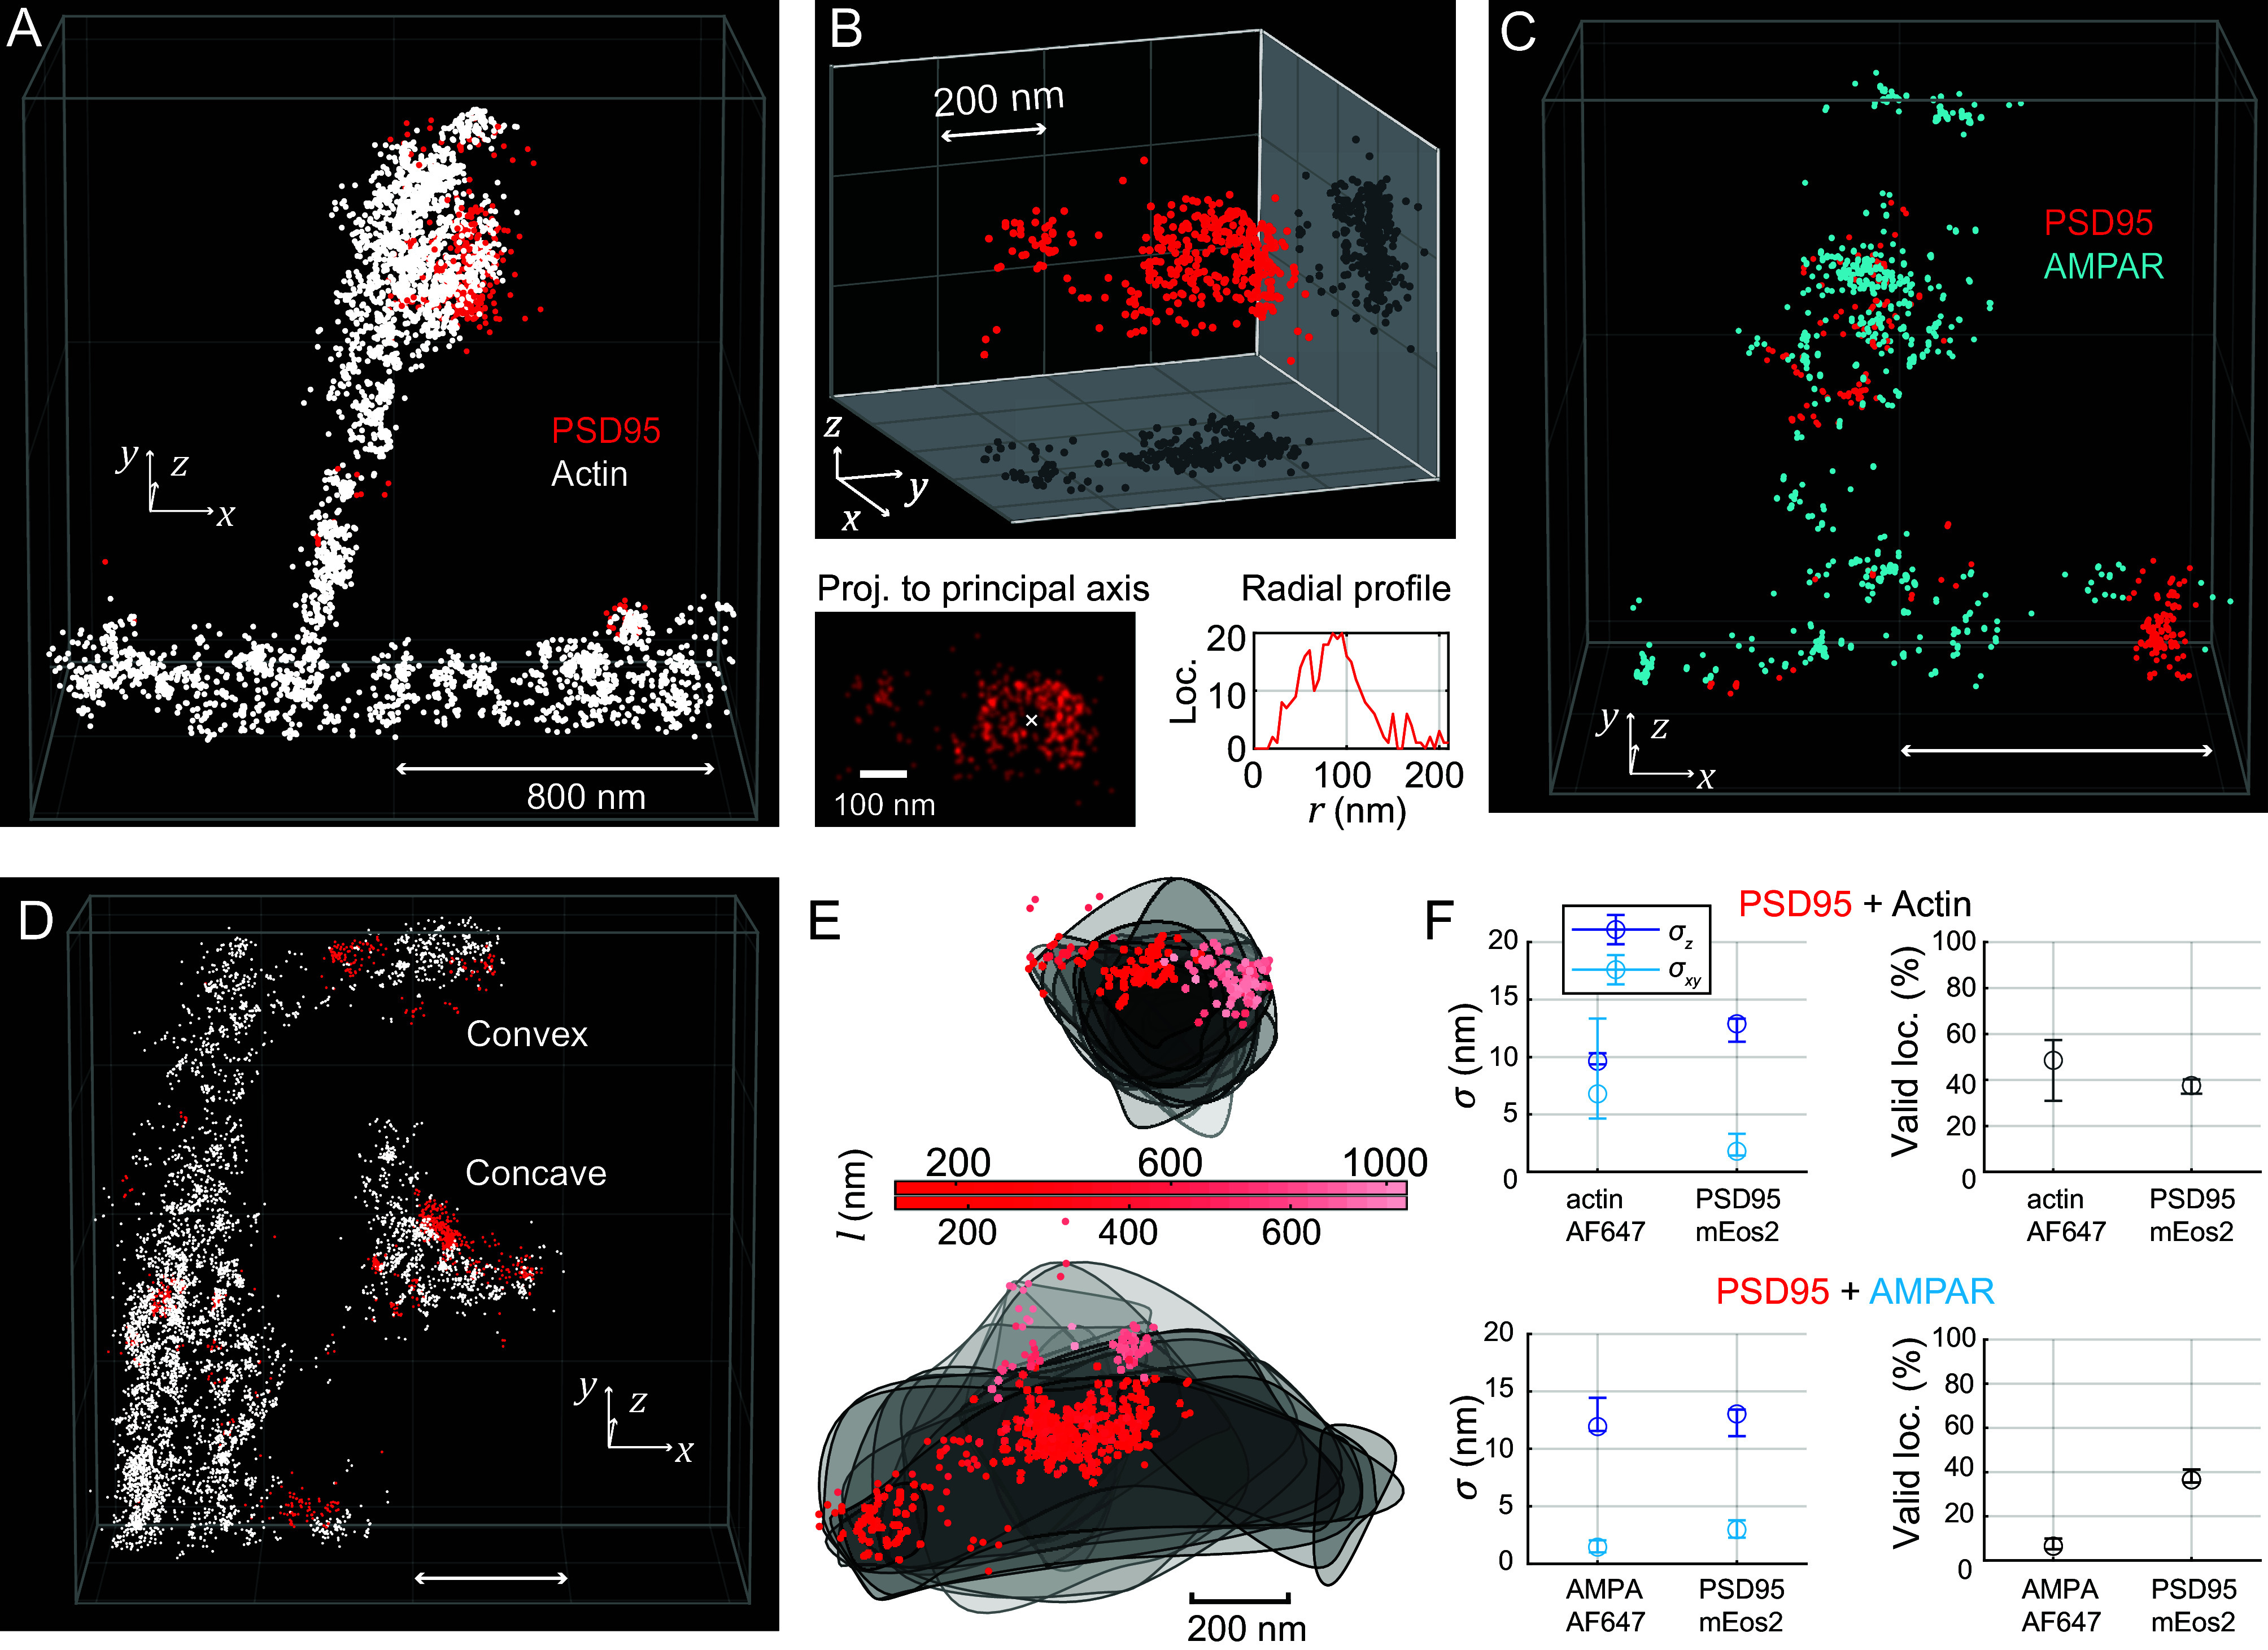
Optical imaging access to nanometer-level protein distributions in intact tissue is a highly sought-after goal, as it would provide visualization in physiologically relevant contexts. Under the unfavorable signal-to-background conditions of increased absorption and scattering of the excitation and fluorescence light in the complex tissue sample, superresolution fluorescence microscopy methods are severely challenged in attaining precise localization of molecules. We reasoned that the typical use of a confocal detection pinhole in MINFLUX nanoscopy, suppressing background and providing optical sectioning, should facilitate the detection and resolution of single fluorophores even amid scattering and optically challenging tissue environments. Here, we investigated the performance of MINFLUX imaging for different synaptic targets and fluorescent labels in tissue sections of the mouse brain. Single fluorophores were localized with a precision of <5 nm at up to 80 µm sample depth. MINFLUX imaging in two color channels allowed to probe PSD95 localization relative to the spine head morphology, while also visualizing presynaptic vesicular glutamate transporter (VGlut) 1 clustering and α-amino-3-hydroxy-5-methyl-4-isoxazolepropionic acid receptor (AMPAR) clustering at the postsynapse. Our two-dimensional (2D) and three-dimensional (3D) two-color MINFLUX results in tissue, with <10 nm 3D fluorophore localization, open up broad avenues to investigate protein distributions on the single-synapse level in fixed and living brain slices.

Keywords: 3D nanoscopy; postsynapse; super-resolution microscopy; tissue imaging.


Conflict of interest statement

Competing interests statement:The Max Planck Society holds patents on selected embodiments and procedures of MINFLUX, benefitting S.W.H. S.W.H. owns shares of Abberior Instruments, a company selling MINFLUX microscopes.

Figures

Fig. 1.
Fig. 1.
MINFLUX nanoscopy in biological tissue. (A) Overview of the custom-built MINFLUX setup for imaging in tissue (adaptations for tissue imaging highlighted in black, standard MINFLUX components shown in gray). (B) Sample imaged. The sample is a coronal section prepared by slicing (C) a mouse brain into 50-300 micrometer consecutive sections. (D) Region of interest in the brain slice showing the optical sectioning capabilities of MINFLUX by the confocal detection volume and the selective on- and off-switching of single emitters. The activated fluorophore is localized photon-efficiently by centering the zero of the donut excitation beam on the activated molecule. (E) Targeted-coordinate pattern for the donut excitation beam and schematic photon emission trace of a centered molecule. cs: coverslip; DMM: deformable membrane mirror; mQWP, mHWP: motorized quarter/half-wave plates; pi: photon count ratio in ith exposure; MC: multicolor; SLM: spatial light modulator; FPGA: Field-Programmable Gate Array.
Fig. 2.
Fig. 2.
Active drift-correction for depth imaging and progressive activation. (A) Depth-adaptable xy-lock system. The dark-field images of fiducial markers (gold nanorods) on the coverslip are acquired when imaging in a plane away from the coverslip surface by refocusing the nanorods with a variable-focus lens. (B) Depth-adaptable z-lock system. The imaging depth range that can be stabilized with high precision is enlarged by a piezo-actuated closed-loop absolute positionable mirror mount. (C and D) Stability of the (C) xy-lock position and (D) z-lock position for measurements in both agarose-sucrose and tissue samples (mean stabilities ± SD). (E) Schematic of activation scan over the ROI. (F) Number of fluorophores detected at each mosaic scan position. (G) Progressive activation, shown schematically. At each new activation location addressed by the mosaic scan, the activation power is ramped up until a molecule starts to emit. (H) Reduction in activation time for the progressive activation relative to activation time expected with constant low activation. PBS: polarizing beam splitter, BP, LP: band/long pass, Δh: imaging depth, α0: rotation angle of absolute positionable mirror, Δh’: z-lock beam position on camera, σxy, σz: xy-lock and z-lock position stability, SLED: superluminescent diode.
Fig. 3.
Fig. 3.
Imaging up to 80 µm deep in tissue with MINFLUX nanoscopy. (A) Focal intensity distribution (xz) of the excitation donut in different imaging depths in tissue, together with regions of interest from MINFLUX images in the same imaging depth showing Caveolin-1 distributions. Intensity profiles of the excitation light are shown as Insets together with a donut-shaped fit along the x-axis. The intensity minimum deteriorates from 3% at the coverslip to 14% in 80 µm depth. The FWHM of the focus along z is increased from ~900 nm at the coverslip to ~1,660 nm in 80 µm depth. (B) Photon traces for the upper row of MINFLUX images. (C) Histogram of p0 values for resegmented localizations. (D) Median signal count rate and interquartile range in each imaging depth. (E) Median SBR over depth. (F) Median ratio of valid localizations over depth. (G) Median localization precision over depth. Statistics from 703,924 localizations (23 images) in ~0 µm, 58,303 locs. (9 images) in ~10 µm, 50,396 locs. (10 images) in ~20 µm, 10,051 locs. (2 images) in ~30 µm, 16,009 locs. (5 images) in ~40 µm, 53,764 locs. (5 images) in ~50 µm, 32,978 locs. (6 images) in 60 µm, 193,465 locs. (15 images) in 70 µm and 12,289 locs. (7 images) in ~80 µm imaging depth. Δh: imaging depth, N: number of photons collected in one multiplexing cycle. ni: number of photons in ith exposure, p0 = n0/N, σxy: localization precision, SBR: signal to background ratio.
Fig. 4.
Fig. 4.
Imaging the post-synapse deep in tissue. (A) MINFLUX nanoscopy of actin (LifeAct-EYFP labeled with primary and secondary antibody by Alexa Fluor 647) in 0 to 50 µm imaging depth. Localizations classified by delineation (SI Appendix, Fig. S9) as not belonging to spine or dendrite are reduced in visibility. (B) PSD95-mEos2 in fixed tissue in 0 to 50 µm imaging depth. (C) Median percentage of valid MINFLUX localizations (p0 < 0.23) and interquartile range over imaging depth, calculated from several images in each imaging depth. (D) Median signal to background ratio vs. imaging depth. (E) Median localization precision vs. imaging depth. Number of localizations and images from which the statistics for the three different samples are calculated are shown in SI Appendix, Table S8. (F) PSD95-mEos2 in living tissue in 0 and 50 µm imaging depth. (G) Imaging with two excitation colors. Two-color image of PSD95-mEos2 and actin-AlexaFluor647. (Left to Right): Two-color confocal overview image. Two-excitation-color MINFLUX in the ROI showing the PSD95 distribution on the postsynapse (only delineated dendritic region shown); full image from the PSD95-mEos2 color channel; further confocal overview images from which the relevant fluorescence was identified are shown in SI Appendix, Fig. S11.
Fig. 5.
Fig. 5.
Cluster analysis of synaptic proteins in mouse brain tissue. (A) Schematic of a synapse showing the arrangement of VGlut1 in synaptic vesicles (presynapse), Piccolo situated close to the synaptic release site, and AMPA receptors (post-synapse). (B) Confocal image of Piccolo (grayscale) overlaid with MINFLUX acquisition of VGlut1 (localizations in transparent violet). VGlut1 is labeled by Alexa Fluor 647 with primary and secondary antibody. Clusters assigned by analysis with the dbscan algorithm are fitted with a circle, shown overlaid. (C) Cluster analysis of VGlut. (D) MINFLUX image reconstruction of AMPA receptors directly chemically labeled with CAM2-Alexa Fluor 647 conjugate. Localizations from the same emission event and localizations that fall within 2 nm of each other are assigned to the same molecule (AMPAR subunit). Molecules are plotted as cyan dots. (E) Zoom-in to the image region with highest molecule density, and cluster analysis of the AMPA receptors (clusters identified by dbscan and their border delineated using a spline-fit). (F) Cluster analysis of AMPAR. (G) AMPA receptor structure from PDB file 3KG2, and extracted distances between the labeled amino acids. (H) Distances dNN between AMPAR subunit localizations (nearest neighbors, second-nearest neighbors, and third-nearest neighbors). (I) Selected molecule geometries assumed to be part of completely labeled AMPA receptors.
Fig. 6.
Fig. 6.
3D MINFLUX localization scheme for imaging in aberrant media. (A) Simulated focal intensity profiles for different spherical aberrations (Zernike coefficient of first-order spherical aberration; see SI Appendix, Supplementary Text). While the z-donut provides good imaging contrast along the optical axis, its contrast perpendicular to the optical axis is notably worse than for the donut, especially in the case of spherical aberrations. (B) Standard 3D MINFLUX localization scheme based on the z-donut. (C) 3D MINFLUX images of spines in 0 and 10 µm imaging depth in tissue acquired with the z-donut. (D) Donut/regularly focused beam 3D imaging scheme. (E) Same regions of interest as in (B) acquired with the donut/regular focus imaging scheme. (Interleaved acquisition: first z-donut, then donut/regular focus, then again z-donut). (F) MINFLUX metrics (color-coded) for 3D imaging with donut/regular focus or z-donut in different imaging depths.
Fig. 7.
Fig. 7.
3D MINFLUX with two excitation colors for investigating the protein distributions on the post-synapse (spine head). (A) Region of interest showing part of a dendrite with a spine. Spine morphology is delineated similarly to the 2D two-color MINFLUX recording of PSD95/actin; localizations of actin in white, PSD95 in red. (B) More detailed view of the PSD95 distribution. Notably, PSD95 proteins are clustered and the biggest cluster is perforated. Projection of the localizations to an orthonormal head-on view, and radial profile centered on the hole in the cluster. (C) PSD95 and AMPA receptor (AMPAR) distribution on a spine with similar morphology. AMPA receptor localizations are plotted in blue. The highest AMPAR density is on the top of the convex spine head. (D) ROI containing two spines: one with a concave-shaped, one with a convex-shaped spine head. (E) Convex and concave spine head, shown projected from the top of the respective spine head. Gray lines delineate 80 nm thick slices of the actin dataset. PSD95 localizations shown as scatter, with the distance l along the line of sight from the top of the spine color-coded. (F) MINFLUX metrics over multiple 3D two-excitation-color MINFLUX images of actin and PSD95 as well as AMPAR and PSD95 (median values, whiskers represent interquartile range). Animations of the data in (A, C, and D) are found in Movies S1–S3. Scale bars: 800 nm or as indicated.

References

    1. Abbe E. C., The relation of aperture and power in the microscope (continued). J. R. Microsc. Soc. 2, 460–473 (1882).
    1. Hell S. W., Microscopy and its focal switch. Nat. Methods 6, 24–32 (2009). - PubMed
    1. Hell S. W., Wichmann J., Breaking the diffraction resolution limit by stimulated emission: Stimulated-emission-depletion fluorescence microscopy. Opt. Lett. 19, 780–782 (1994). - PubMed
    1. Klar T. A., Jakobs S., Dyba M., Egner A., Hell S. W., Fluorescence microscopy with diffraction resolution barrier broken by stimulated emission. Proc. Natl. Acad. Sci. U.S.A. 97, 8206–8210 (2000). - PMC - PubMed
    1. Betzig E., et al. , Imaging intracellular fluorescent proteins at nanometer resolution. Science 313, 1642–1645 (2006). - PubMed

LinkOut - more resources