. 2024 Dec 20;9(102):eadl2967.
doi: 10.1126/sciimmunol.adl2967. Epub 2024 Dec 20.

NK cells restrain cytotoxic CD8+ T cells in the submandibular gland via PD-1-PD-L1

Affiliations

NK cells restrain cytotoxic CD8+ T cells in the submandibular gland via PD-1-PD-L1

Samantha M Borys et al. Sci Immunol. .

Abstract

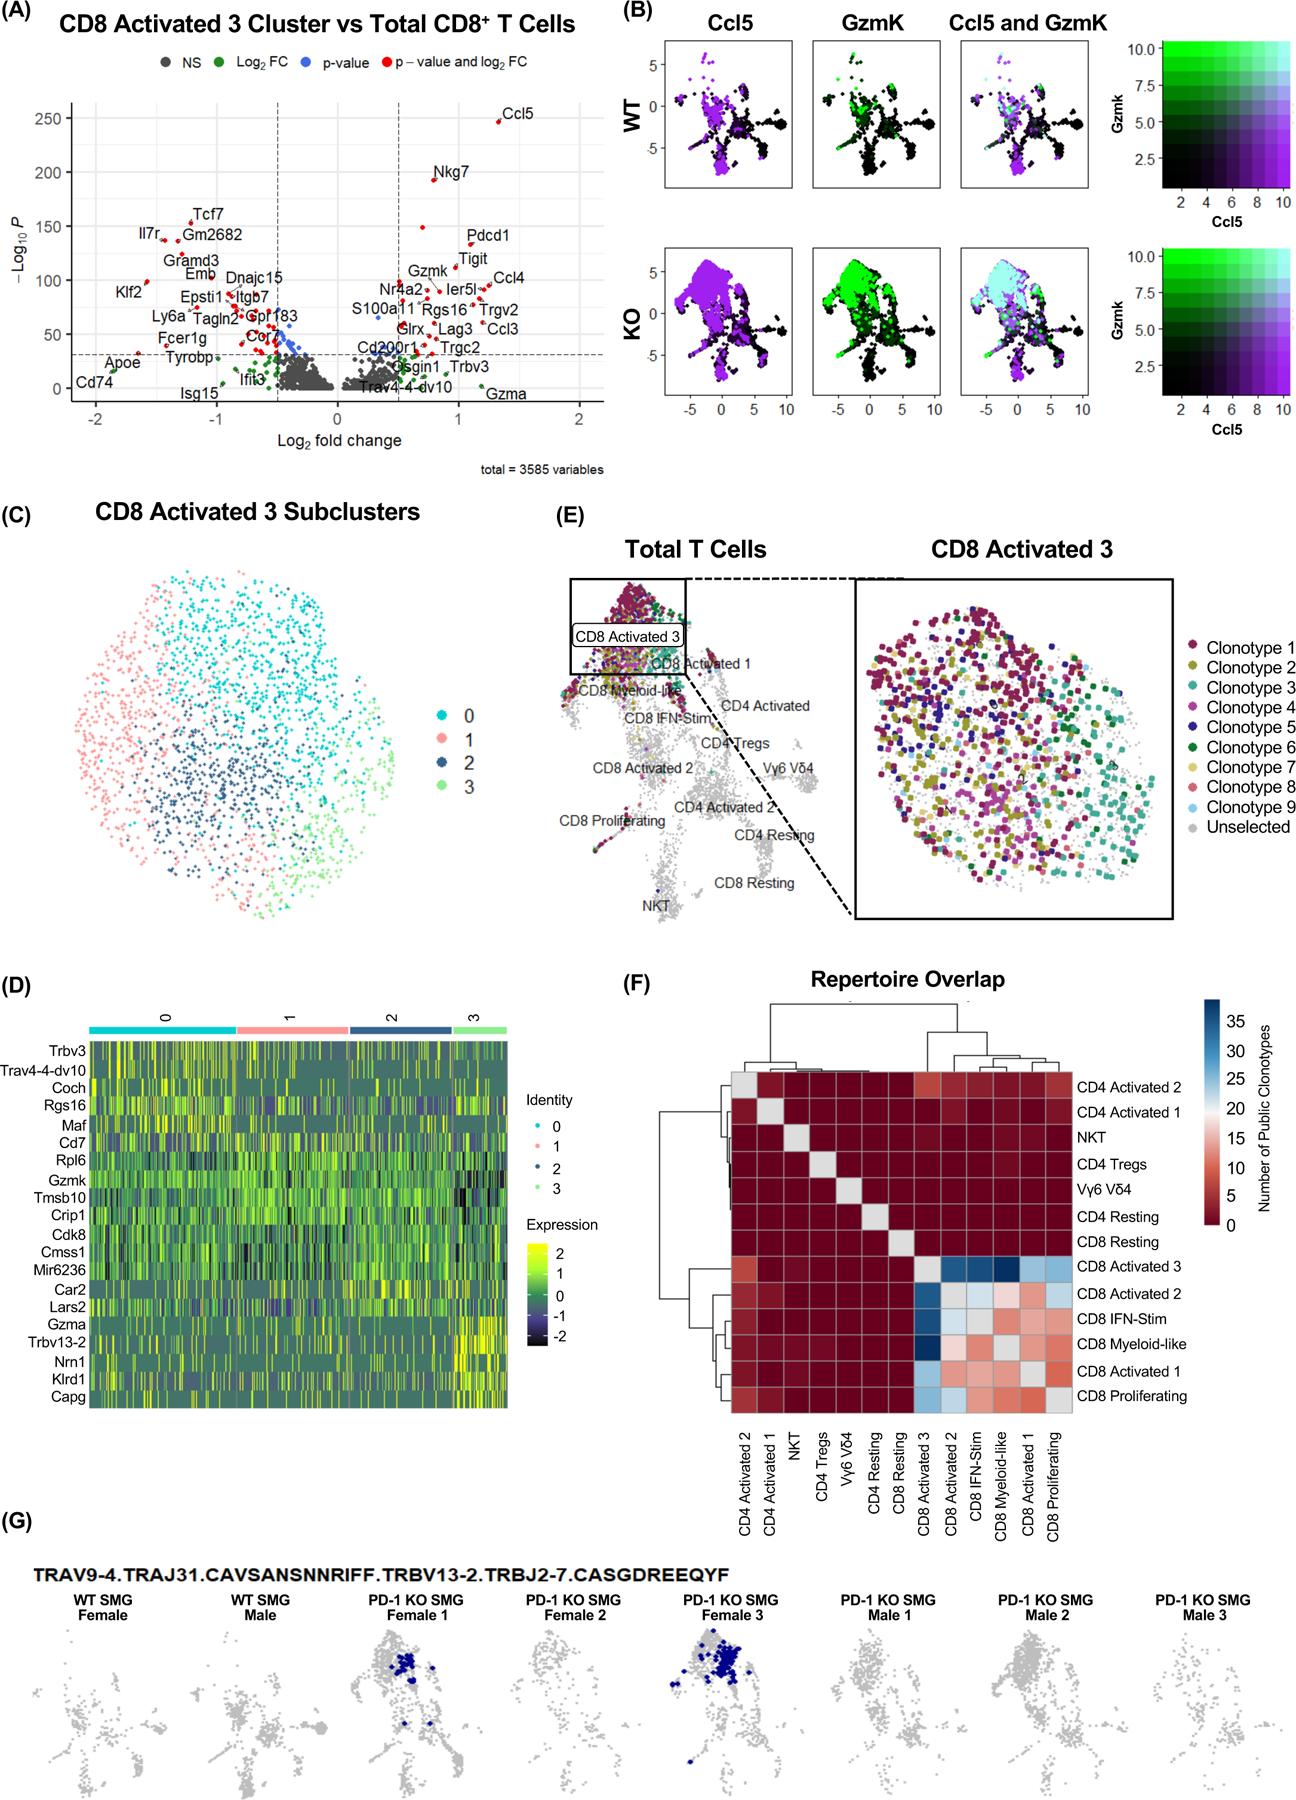
The increasing use of anti-programmed cell death 1 (PD-1) immune checkpoint blockade has led to the emergence of immune-related adverse events (irAEs), including dysfunction of the submandibular gland (SMG). In this study, we investigated the immunoregulatory mechanism contributing to the susceptibility of the SMG to irAEs. We found that the SMGs of PD-1-deficient mice and anti-programmed cell death ligand 1 (PD-L1)-treated mice harbor an expanded population of CD8+ T cells. We demonstrate that natural killer (NK) cells expressing PD-L1 tightly regulate CD8+ T cells in the SMG. When this immunoregulation is disrupted, CD8+ T cells clonally expand and acquire a unique transcriptional profile consistent with T cell receptor (TCR) activation. These clonally expanded cells phenotypically overlapped with cytotoxic GzmK+ CD8+ T autoimmune cells identified in patients with primary Sjögren's syndrome. Understanding how NK cells modulate CD8+ T cell activity in the SMG opens new avenues for preventing irAEs in patients undergoing checkpoint blockade therapies.


Conflict of interest statement

Competing Interests: The authors declare no competing financial interests.

Figures

Figure 1:
Figure 1:
The SMG of PD-1 KO mice display elevated proportion and number of CD8+ T cells. (A) Representative flow cytometry staining in the submandibular gland (SMG) of mice aged 10–15 weeks, gated on live CD45+ lymphocytes. (B) SMG CD8+ T cell frequency and (C) number. (D) SMG CD8+ T cell, CD4+ T cell, NK cell, and B cell frequency and (E) number. Data in B-E pooled from 6 independent experiments, n = 17–19. (F) Fold change in CD8+ T cells in PD-1 KO mice relative to WT mice. Data pooled from three independent experiments, n = 2–3 for lung and kidney, n = 6–10 for spleen, liver, and SMG. FC =1 indicated by dotted line. (G) PD-1 expression on CD8+ T cells across various organs in C57BL/6 WT mice. Data pooled from two independent experiments, n = 4 for all organs, except lungs where n = 2. (H) Proportion and (I) number of CD8+ and CD4+ T cells following treatment with 200 μg anti-PD-L1 antibody every 5–6 days for 4 weeks. (J) PD-1 expression on CD8+ T cells following anti-PD-L1 treatment. Data are represented as mean ± SEM. Statistical analysis for B and C utilized an unpaired t-test. Statistical analysis for D, E, H, I, and J utilized multiple unpaired t-tests, and q-value is displayed. Statistical analysis for F and G utilized a one-way ANOVA.
Figure 2:
Figure 2:
Both NK cell deficiency and PD-L1 deletion on NK cells lead to specific expansion of CD8+ T cells in the SMG. (A) NK cell frequency across various organs. Pooled from two experiments, n=4 for all organs, except lungs where n=2. (B) Validation of NK depletion. (C) Frequency and (D) number of CD8+ and CD4+ T lymphocytes in the SMG of C57BL/6 following anti-NK1.1 mAb treatment. Pooled from three experiments, n=9. (E) Frequency and (F) number of CD8+ and CD4+ T lymphocytes in the SMG of ROSA-DTA-Ncr1Cre mice and controls, n=6–7 (age 8–10 weeks). (G) PD-L1 expression on conventional (cNK – CD49a) and tissue-resident (trNK – CD49a+) from various organs of C57BL/6 compared to splenic cNK from PD-L1fl-Ncr1Cre mice, (9–13 weeks). Data representative of 3 experiments, n=3. (H) Representative PD-L1 deletion on NK cells. (I) Expression of PD-L1 on SMG CD8+ T and NK cells. (J) Frequency and (K) number of CD8+ and CD4+ T cells in PD-L1fl-Ncr1Cre SMG compared to controls, four experiments, n=13–20, (8–14 weeks). (L) PD-1 expression on CD8+ T cells in PD-L1fl-Ncr1Cre SMG. (M) Proportion and (N) number of CD8+ and CD4+ T cells in PD-L1fl-Ncr1Cre SMG treated with 200μg anti-PD-L1 antibody or isotype every 5–6 days for 4 weeks, two experiments, n=8–9. Represented as mean ± SEM. One-way ANOVA for A, multiple unpaired t-tests for B-F and J-O, and multiple paired t-tests for G.
Figure 3:
Figure 3:
Multimodal single-cell RNA sequencing reveals distinct subsets of T cells in the mouse SMG. (A) Uniform manifold approximation and projection (UMAP) of RNA-seq data from WT control (n=2) and PD-1 KO (n=6) mouse SMGs with semi-supervised cluster annotation. (B) Feature plots showing log-normalized expression of key genes used to identify clusters. (C) Module score of key genes used to identify clusters (see Methods). (D) Dotplot of enriched genes in each cluster. The dot size represents the proportion of cells in a cluster that express a given feature, while the color indicates the average expression level of that feature across all cells in the cluster (with green representing high expression and light blue indicating low expression). (E) Bar graph representing the proportion of cells per cluster from WT and KO groups.
Figure 4:
Figure 4:
Clonally expanded CD8+ T cells in PD-1 KO SMG display a unique transcriptional phenotype. (A) Volcano plot of differentially expressed genes in CD8 Activated 3 cluster compared to total CD8+ T cells. P-value cutoff = 10e-32, log2FC cutoff = 0.5. Genes highlighted in red meet both the threshold for p-value and log2FC, blue only p-value, green only log2FC, and grey neither. (B) Log-normalized RNA expression of Ccl5 (purple, left),GzmK (green, middle) and co-expression (cyan, right) across WT SMG T cells (top) and KO SMG T cells (bottom). (C) scRNA-seq subclusters within CD8 Activated 3 cluster after TCR chains were removed from the Variable Features list used for generating the UMAP. (D) Heatmap of differentially expressed genes via RNA-seq across subclusters generated within the CD8 Activated 3 population. (E) Total RNA-seq UMAP overlaid with the most enriched clonotypes identified using IMGT HighVQuest, highlighting where clones fall within CD8 Activated 3 cluster. (F) Using Immunarch, shared clonotypes between Seurat clusters were identified. Greater repertoire overlap between two clusters is indicated by dark blue. Comparisons of a cluster to itself were not calculated, and thus are greyed out along the diagonal. Hierarchical trees represent which clusters are most clonally similar. (G) Total RNA-seq UMAP split by sample overlaid with the third most abundant clone (TRAV9-4.TRAJ31.CAVSANSNNRIFF.TRBV13-2.TRBJ2-7.CASGDREEQYF), which appears to be clonally expanded in both PD-1 KO female samples 1 and 3.
Figure 5:
Figure 5:
Predicted overlap of antigen recognition in expanded clones via TCRdist3. (A) UMAP overlaid with clones from the most abundant TCRdist3 identified neighborhood (upper) and motif analysis of the highlighted quasi-public neighborhood (lower). (B) UMAP overlay and motif analysis of a second identified quasi-public neighborhood. (C) V gene segment usage and gene pairing landscapes of the top 100 most abundant TCR clones within WT (C) and PD-1 KO (D). Genes are ordered and colored by proportion within the repertoire, with red being the most frequent, then green, blue, cyan, magenta, etc. where the width of the curved connections are proportional to the number of clones in the gene pairing. (E) Proportion and (F) number CD8+ T cells of PD-1 KO mice treated with a cocktail of antibiotics in their drinking water from birth until 7–9 weeks of age, compared to PD-1 KO mice treated with control water. Data from 3 independent experiments, n =10–18. Statistical analysis utilized an unpaired t-test.

References

    1. Chaudhry MZ, Belz GT, Chameleon impersonation of NK cells and ILC1s. Nat Immunol 25, 1313–1315 (2024). - PubMed
    1. Cortez VS, Fuchs A, Cella M, Gilfillan S, Colonna M, Cutting Edge: Salivary Gland NK Cells Develop Independently of Nfil3 in Steady-State. The Journal of Immunology 192, 4487–4491 (2014). - PubMed
    1. Erick TK, Anderson CK, Reilly EC, Wands JR, Brossay L, NFIL3 Expression Distinguishes Tissue-Resident NK Cells and Conventional NK-like Cells in the Mouse Submandibular Glands. The Journal of Immunology 197, 2485–2491 (2016). - PMC - PubMed
    1. Erick TK, Brossay L, Phenotype and functions of conventional and non-conventional NK cells. Current Opinion in Immunology 38, 67–74 (2016). - PMC - PubMed
    1. Cortez VS, Cervantes-Barragan L, Robinette ML, Bando JK, Wang Y, Geiger TL, Gilfillan S, Fuchs A, Vivier E, Sun JC, Cella M, Colonna M, Transforming Growth Factor-beta Signaling Guides the Differentiation of Innate Lymphoid Cells in Salivary Glands. Immunity 44, 1127–1139 (2016). - PMC - PubMed

Publication types

LinkOut - more resources