. 2025 Jun 3;148(6):2075-2092.
doi: 10.1093/brain/awae404.

In-depth mass-spectrometry reveals phospho-RAB12 as a blood biomarker of G2019S LRRK2-driven Parkinson's disease

Affiliations

In-depth mass-spectrometry reveals phospho-RAB12 as a blood biomarker of G2019S LRRK2-driven Parkinson's disease

Adriana Cortés et al. Brain. .

Abstract

Leucine-rich repeat kinase 2 (LRRK2) inhibition is a promising disease-modifying therapy for LRRK2-associated Parkinson's disease (L2PD) and idiopathic PD. However, pharmacodynamic readouts and progression biomarkers for clinical trials aiming for disease modification are insufficient, given that no endogenous marker reflecting enhanced kinase activity of the most common LRRK2 G2019S mutation has yet been reported in L2PD patients. Using phospho-/proteomic analyses, we assessed the impact of LRRK2-activating mutations in peripheral blood mononuclear cells from an LRRK2 clinical cohort from Spain (n = 174). The study groups encompassed G2019S L2PD patients (n = 37), non-manifesting LRRK2 mutation carriers of G2019S (here termed G2019S L2NMCs) (n = 27), R1441G L2PD patients (n = 14), R1441G L2NMCs (n = 11), idiopathic PD patients (n = 40) and healthy controls (n = 45). We identified 207 differentially regulated proteins in G2019S L2PD compared with controls (39 upregulated and 168 downregulated) and 67 in G2019S L2NMCs (10 upregulated and 57 downregulated). G2019S downregulated proteins affected the endolysosomal pathway, proteostasis and mitochondria, e.g. ATIC, RAB9A or LAMP1. At the phospho-proteome level, we observed increases in endogenous phosphorylation levels of pSer106 RAB12 in G2019S carriers, which were validated by immunoblotting after 1 year of follow-up (n = 48). Freshly collected peripheral blood mononuclear cells from three G2019S L2PD, one R1441G L2PD, one idiopathic PD and five controls (n = 10) showed strong diminishment of pSer106 RAB12 phosphorylation levels after in vitro administration of the MLi-2 LRRK2 inhibitor. Using machine learning, we identified an 18-feature G2019S phospho-/protein signature discriminating G2019S L2PD, L2NMCs and controls with 96% accuracy that was correlated with disease severity, i.e. UPDRS-III motor scoring. Using easily accessible peripheral blood mononuclear cells from a LRRK2 clinical cohort, we identified elevated levels of pSer106 RAB12 as an endogenous biomarker of G2019S carriers. Our data suggest that monitoring pSer106 RAB12 phosphorylation could be a relevant biomarker for tracking LRRK2 activation, particularly in G2019S carriers. Future work might determine whether pSer106 RAB12 could help with patient enrichment and monitoring drug efficacy in LRRK2 clinical trials.

Keywords: Parkinson’s disease; biomarker; leucine-rich repeat kinase 2; non-manifesting carriers; peripheral blood mononuclear cells; phospho-/proteomics.


Conflict of interest statement

The authors report no competing interests.

Figures

Figure 1
Figure 1
Experimental workflow using peripheral blood mononuclear cells from a Spanish LRRK2 clinical cohort. (A) Processing of peripheral blood mononuclear cells (PBMCs) for different applications. Blood samples (40 ml) were taken from individuals in an LRRK2 clinical cohort from Spain (n = 174), encompassing G2019S LRRK2-associated Parkinson’s disease patients (L2PD, n = 37), non-manifesting LRRK2 mutation carriers of G2019S (G2019S L2NMCs, n = 27), R1441G L2PD patients (n = 14), R1441G L2NMCs (n = 11), idiopathic PD (iPD, n = 40) and controls (n = 45). (B) After PBMC isolation, homogenization and protein digestion, data-independent acquisition-MS (DIA-MS) identified a total of 3815 proteins and 10 288 phospho-sites after phospho-enrichment. For the group differential analysis, we considered only proteins and phospho-sites mapped by at least two different peptides (Spetronaut) and with <30% imputation, with a significance cut-off of log2 fold-change > |0.6| and a false discovery rate multiple-testing adjusted P < 0.05. Data deconvolution and interactive representation of findings were done using the Curtain/Curtain PTM Tool, and gene ontology was assessed by Metascape. Using machine learning, we identified an 18-feature G2019S phospho-/protein signature able to discriminate G2019S L2PD, G2019S L2NMCs and controls. By immunoblot, we assessed pSer106 RAB12/total RAB12 levels in PBMCs from a subset of subjects (n = 48) after 1 year of follow-up, including G2019S L2PD (n = 12), G2019S L2NMCs (n = 6), iPD (n = 15) and controls (n = 15). Lastly, in freshly isolated PBMCs from a second subset of subjects (n = 10) encompassing G2019S L2PD (n = 3), R1441G L2PD (n = 1), iPD (n = 1) and healthy controls (n = 5) treated with dimethyl sulphoxide or the MLi-2 LRRK2 inhibitor, we performed an LRRK2 kinase assay measuring pSer106 RAB12/total RAB12 levels. COVID = coronavirus disease 2019; LC-MS = liquid chromatography mass spectrometry; MoCA = Montreal Cognitive Assessment; PCA = principal component analysis; QC = quality control; ROC = receiver operating characteristic curve; UPDRS III = Unified Parkinson's Disease Rating Scale III.
Figure 2
Figure 2
Proteome overview and differential analyses in G2019S carriers. (A) Bar plots showing the numbers of differential proteins in different pairwise comparisons involving G2019S carriers, R1441G carriers, idiopathic Parkinson's disease (iPD) and controls, with upregulated proteins in dark grey and downregulated proteins in light grey. All cohorts were run in parallel, with balanced study groups per run, blind to the operator, and using one quantile normalization (Limma). The significance cut-off was set at a log2 fold-change (FC) > |0.6| and a false discovery rate multiple-testing adjusted P < 0.05. (B) Volcano plot of the proteome differential analysis in G2019S LRRK2-associated PD (L2PD) patients versus healthy controls, with Curtain weblinks to access raw and differential analysis data, showing proteins upregulated in G2019S L2PD as red dots on the right and proteins upregulated in controls (i.e. downregulated in G2019S L2PD) as red dots on the left (Curtain). A colour code key applying to all panels is shown at the bottom of the figure, depicting statistically significant hits as red dots. (C) Volcano plot of the proteome differential analysis in G2019S carriers as a whole, i.e. L2PD and non-manifesting LRRK2 mutation carriers (L2NMCs), versus healthy controls (Curtain). (D) Volcano plot showing the proteome differential analysis between G2019S L2NMCs and healthy controls (Curtain). (E) Volcano plot representing the proteome comparison between G2019S L2NMCs and G2019S L2PD. A Venn diagram at the bottom of the figure shows the overlap of differential hits in PD-manifesting and non-manifesting G2019S carriers (Curtain). Curtain weblinks provide access to the differential analyses.
Figure 3
Figure 3
Phospho-proteome differential analyses of G2019S carriers. (A) Volcano plot of the phospho-proteome differential analysis of G2019S LRRK2-associated Parkinson's disease (L2PD) patients versus controls, and Curtain weblinks to raw and differential analysis data, representing hyperphosphorylated proteins in G2019S L2PD as red dots on the right with a single hit, elevated pSer106 RAB12 levels in G2019S L2PD, emerging as a differential phospho-peptide at a log2 fold-change (FC) > |0.6| and a false discovery rate multiple-testing adjusted P < 0.05 (Curtain PTM). A colour code key applying to all the panels shows categorization of hits by statistical significance. (B) Volcano plot showing phospho-protein hits in G2019S carriers as a whole, PD-manifesting and non-manifesting, compared with controls (Curtain PTM). (C) Phospho-proteome differences in G2019S non-manifesting LRRK2 mutation carriers (L2NMCs) versus controls (Curtain PTM). (D) Volcano showing phospho-proteome differences in G2019S L2NMCs versus G2019S L2PD (Curtain PTM). (E) Quality control crude non-imputed (bar plot, bottom), non-normalized (violin plot, top) MS data from pSer106 RAB12 levels across all study groups showing higher pSer106 phosphorylation levels in G2019S L2PD and G2019S L2NMCs with respect to the rest of the groups. The adjusted P-values and FC on top of the violin plot correspond to those from the differential analysis. (F) A similar analysis to E, with G2019S L2PD and G2019S L2NMCs grouped into a single group of G2019S carriers. Curtain weblinks provide access to the differential analyses.
Figure 4
Figure 4
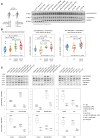
One-year follow-up of pSer106 RAB12 by immunoblot and MLi-2 response. Immunoblot assessment of pSer106 RAB12 phosphorylation levels in >1-year follow-up peripheral blood mononuclear cell (PBMC) samples from part of the LRRK2 subcohort from Clínic-Barcelona (n = 48), including G2019S LRRK2-associated Parkinson's disease (L2PD, n = 12), G2019S non-manifesting LRRK2 mutation carriers (L2NMCs, n = 6), idiopathic PD (iPD, n = 15) and controls (n = 15). (A) Schematic workflow of immunoblot assessment and representative blot from five different blots shown in the Supplementary material. *Intergel control. (B) Dot plots comparing pSer106 RAB12/total RAB12 levels obtained by data-independent acquisition-MS (DIA-MS) at the entire LRRK2 clinical cohort (n = 174) on the left and by immunoblot of part of the Clínic-Barcelona cohort after 1-year of follow-up (n = 48) in G2019S carriers on the right. In each plot, overall intergroup differences were assessed using the Kruskal–Wallis test followed by Dunn’s post hoc test to evaluate for pSer106 RAB12/total RAB12 differences in G2019S carriers. (C) Representative immunoblot analysis of pSer106 RAB12/total RAB12 and pThr73 RAB10/Total RAB10 using technical replicates from additional freshly collected PBMCs from one R1441G L2PD, one G2019S L2PD, one iPD and three controls (expanded to a total n = 10 subjects in the Supplementary material), treated with dimethyl sulphoxide or the MLi-2 LRRK2 inhibitor (200 nM, 30 min), showing a diminishment of pSer106 RAB12 phosphorylation levels after LRRK2 inhibition by MLi-2 treatment.
Figure 5
Figure 5
Identification of an 18-feature phospho-/protein classifier for G2019S carriers. After comparing the performance of several models, we applied supported vector machine (SVM) learning, adjusted by unbalanced groups using the synthetic minority over-sampling technique (SMOTE), corrected from overfitting with 5-fold cross-validation, identified cross-group differential proteins and phospho-proteins by ANOVA and recursive feature elimination with cross-validation, and refined informative combinations to the minimal numbers of features yielding the maximal balanced accuracy by the Monte Carlo tree search (MCTS) method. (A) Eighteen-feature G2019S phospho-/protein best classifier identified in G2019S carriers, Parkinson's disease (PD)-manifesting and non-manifesting subjects and healthy controls. Red dots indicate individual features correlating with disease severity (UPDRS-III) (see Fig. 6). (B) Relative contribution of the different proteins (n = 15) and phospho-sites (n = 3), including pSer106 RAB12, from the 18-feature G2019S classifier on the top bar plot; Metascape gene ontology enrichment analysis of the 18-features G2019S signature bottom bar plot. (C) Receiver operating curve analysis of the 18-feature G2019S phospho-/protein signature showing an overall balanced accuracy of 0.957 to discriminate G2019S LRRK2-associated PD (L2PD), G2019S non-manifesting LRRK2 mutation carriers (L2NMCs) and controls, specifically with an area under the curve of 1.00 between G2019S L2PD and controls, 0.99 between G2019S L2NMCs and controls, and 0.98 between G2019S L2PD and G2019S L2NMCs. (D) Principal component analysis based on the 18-feature G2019S phospho-/protein classifier in G2019S carriers and healthy controls, showing distinct group profiles based on LRRK2 mutation and disease status, with G2019S L2NMCs in between G2019S L2PD and controls, consistent with their disease status. UPDRS III = Unified Parkinson's Disease Rating Scale III.
Figure 6
Figure 6
Association between differential LRRK2 phospho-/proteins and disease severity. Correlation analysis of differential proteins and phospho-proteins [log2 fold-change (FC) > |0.6|, adjusted P < 0.05] and UPDRS-III motor scores from LRRK2-associated Parkinson's disease (L2PD) patients and healthy controls with statistical significance set at a Spearman’s correlation coefficient ρ > |0.5| and a false discovery rate multiple-testing adjusted P < 0.05. (A and B) Correlation plots between differential proteins in G2019S L2PD versus controls (A) and R1441G L2PD versus controls (B) showing differential hits correlating with UPDRS-III in red. (C) Scatter plots of 10 hits from the 18-feature G2019S phospho-/protein signature correlating with UPDRS-III in G2019S L2PD patients represented as orange dots and healthy controls as blue dots, including PDCD6, ARHGAP45, ATIC, SCLY, PSMC5, NDUFB8, LAMP1, HSD17B10, RAB9A and pSer106 RAB12. UPDRS III = Unified Parkinson's Disease Rating Scale III.

References

    1. Sheng Z, Zhang S, Bustos D, et al. Ser1292 autophosphorylation is an indicator of LRRK2 kinase activity and contributes to the cellular effects of PD mutations. Sci Transl Med. 2012;4:164ra161. - PubMed
    1. Steger M, Tonelli F, Ito G, et al. Phosphoproteomics reveals that Parkinson’s disease kinase LRRK2 regulates a subset of Rab GTPases. Elife. 2016;5:e12813. - PMC - PubMed
    1. Steger M, Diez F, Dhekne H, et al. Systematic proteomic analysis of LRRK2-mediated rab GTPase phosphorylation establishes a connection to ciliogenesis. Elife. 2017;6:e31012. - PMC - PubMed
    1. Taylor M, Alessi DR. Advances in elucidating the function of leucine-rich repeat protein kinase-2 in normal cells and Parkinson’s disease. Curr Opin Cell Biol. 2020;63:102–113. - PMC - PubMed
    1. Zimprich A, Biskup S, Leitner P, et al. Mutations in LRRK2 cause autosomal-dominant parkinsonism with pleomorphic pathology. Neuron. 2004;44:601–607. - PubMed

Substances