. 2025 Feb:79:103458.
doi: 10.1016/j.redox.2024.103458. Epub 2024 Dec 11.

Inhibiting de novo lipogenesis identifies a therapeutic vulnerability in therapy-resistant colorectal cancer

Affiliations

Inhibiting de novo lipogenesis identifies a therapeutic vulnerability in therapy-resistant colorectal cancer

Eeshrita Jog et al. Redox Biol. 2025 Feb.

Abstract

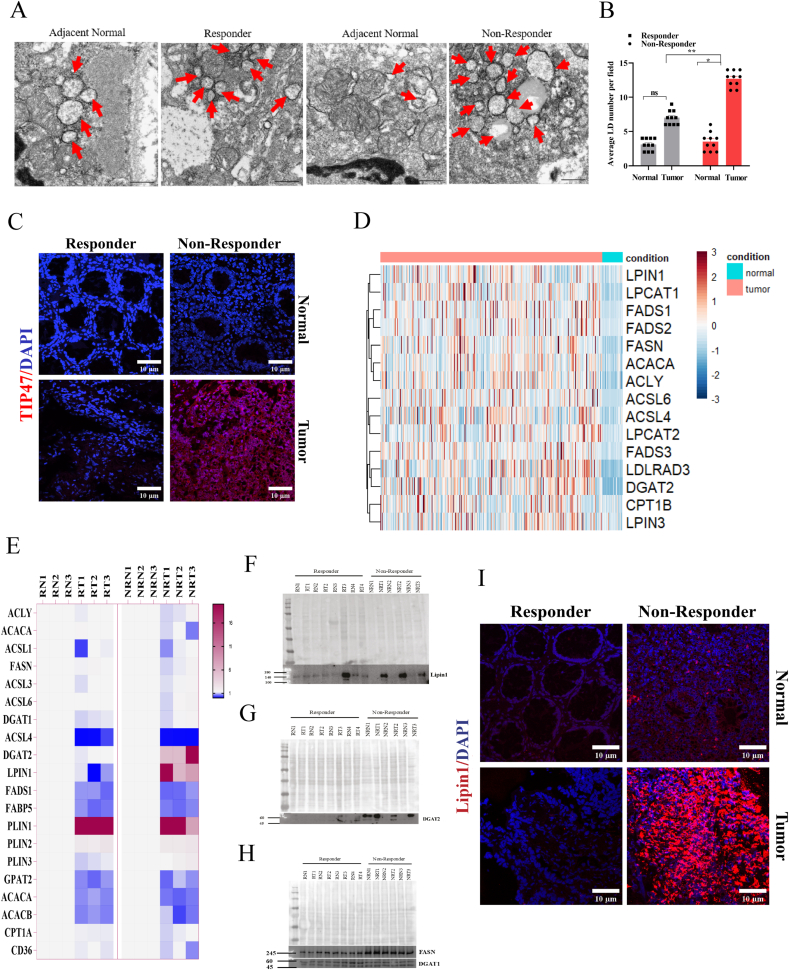
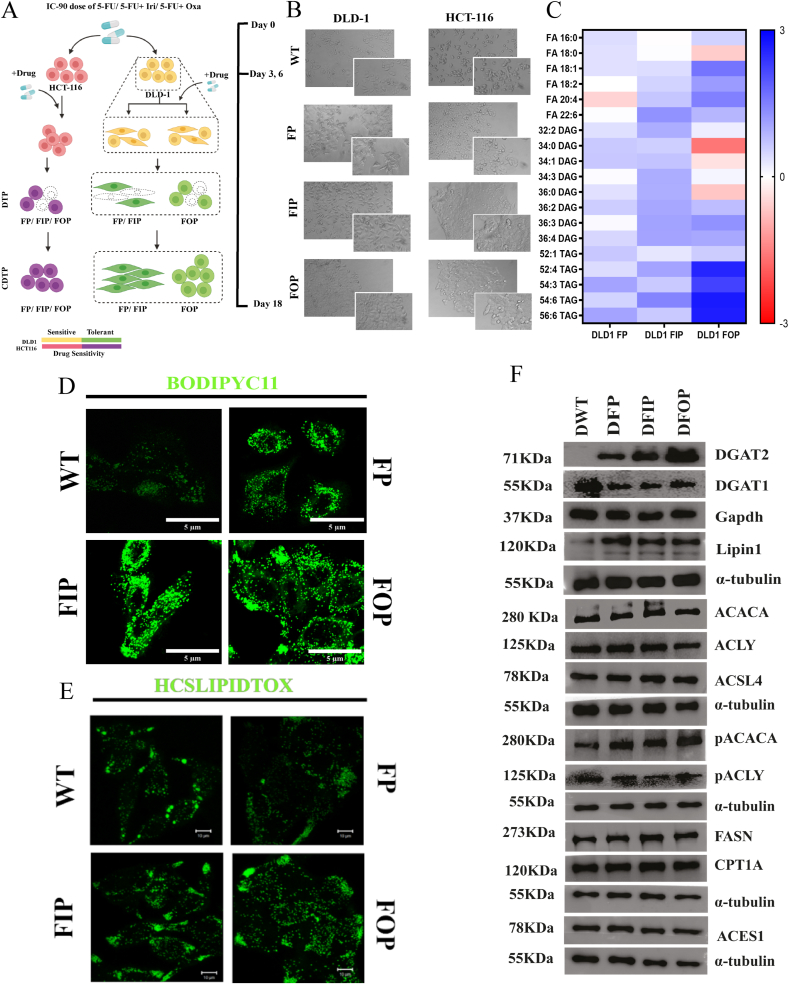
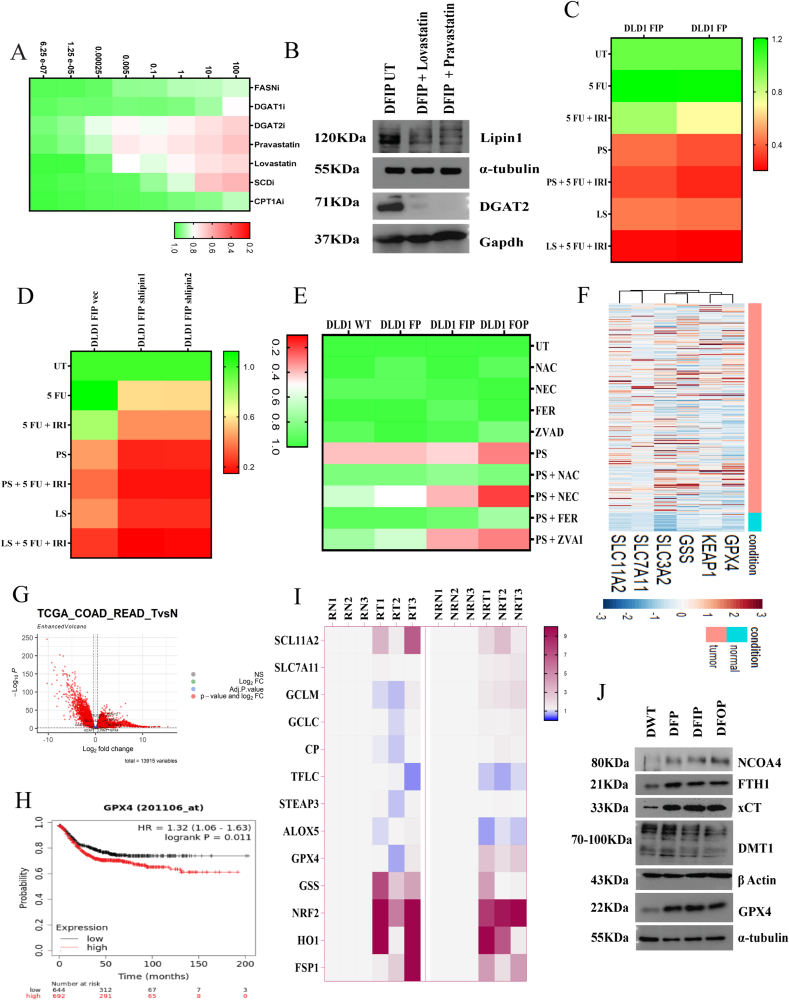
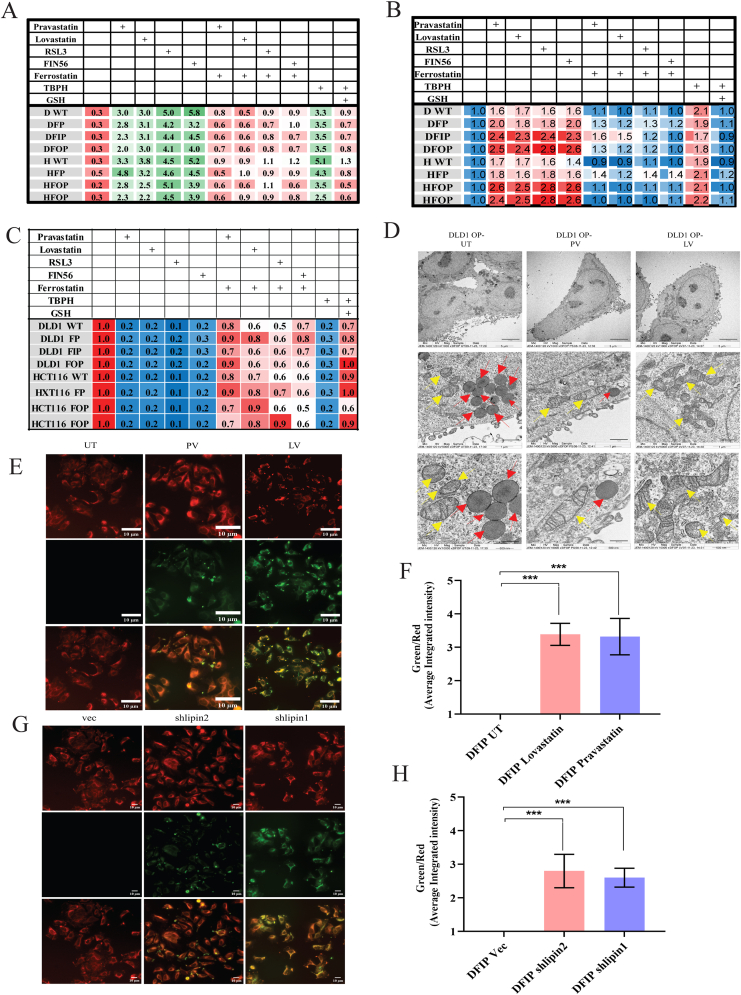
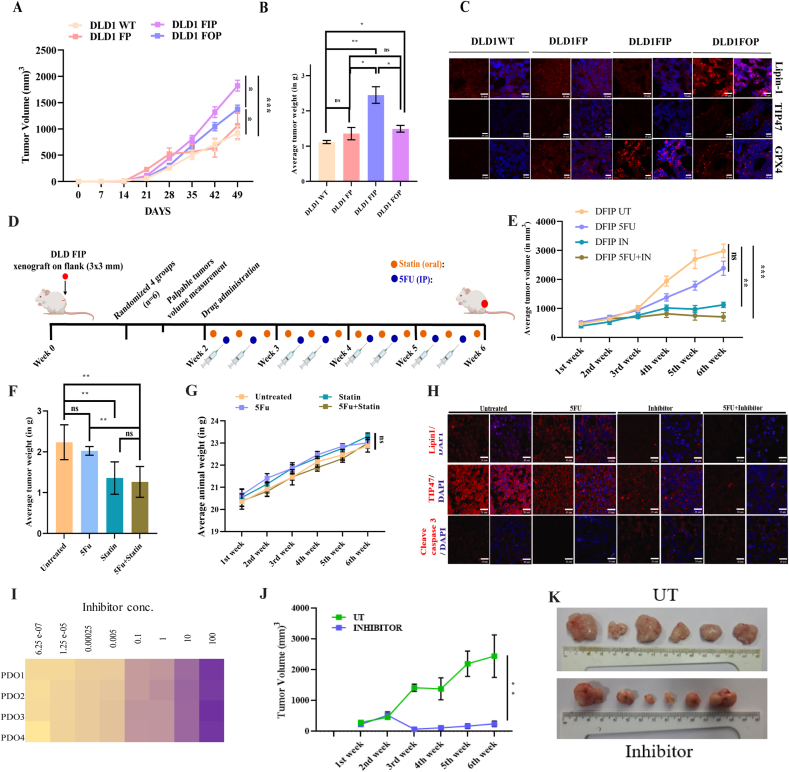
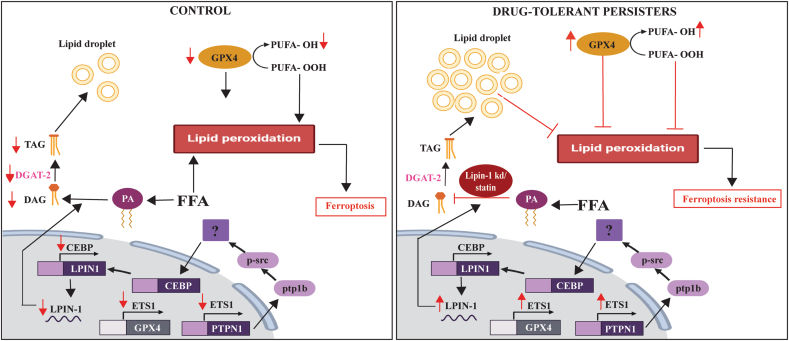
A significant clinical challenge in patients with colorectal cancer (CRC), which adversely impacts patient survival, is the development of therapy resistance leading to a relapse. Therapy resistance and relapse in CRC is associated with the formation of lipid droplets (LD) by stimulating de novo lipogenesis (DNL). However, the molecular mechanisms underlying the increase in DNL and the susceptibility to DNL-targeted therapies remain unclear. Our study demonstrates that colorectal drug-tolerant persister cells (DTPs) over-express Lipin1 (LPIN1), which facilitates the sequestration of free fatty acids into LDs. The increased expression is mediated by the ETS1-PTPN1-c-Src-CEBPβ pathway. Blocking the conversion of free fatty acids into LDs by treatment with statins or inhibiting lipin1 expression disrupts lipid homeostasis, leading to lipotoxicity and ferroptotic cell death in both DTPs and patient-derived organoids (PDOs) in vitro. Ferroptosis inhibitors or N-acetylcysteine (NAC) can alleviate lipid ROS and cell death resulting from lipin1 inhibition. This strategy also significantly reduces tumor growth in CRC DTP mouse xenograft and patient-derived xenograft (PDX) models. Our findings highlight a new metabolic vulnerability in CRC DTPs, PDO, and PDX models and provide a framework for the rational repurposing of statins. Targeting the phosphatidic acid (PA) to diacylglycerol (DAG) conversion to prevent lipid droplet formation could be an effective therapeutic approach for therapy-resistant CRC.

Keywords: De novo lipogenesis; Drug tolerant persister cells; Ferroptosis; Lipid droplet; Lipin1; Non-responder.


Conflict of interest statement

Declaration of competing interest The authors declare that they have no known competing financial interests or personal relationships that could have appeared to influence the work reported in this paper.

Figures

Fig. 1
Fig. 1
CRC non-responders exhibit abundant lipid droplets and increased LPIN1 expression, correlating with poor patient survival and therapy resistance. (A) Representative transmission electron microscopy images of the LD in adjacent normal, responder, and non-responder rectal patient tumor samples. Scale bar 500 nm. Red arrows indicate LD. Note that the number of lipid droplets is higher in the non-responders than in the responders. (B) Average number of LD per field (n = 10 images) (C) Representative IF staining of LDs via TIP47 antibody in human colorectal responder/non-responders tumor samples and its adjacent normal samples. The nuclei were stained with DAPI. Scale bar, 10 μm. (D) Heat map depict normalized expression levels of a lipid metabolism-related gene signature (KEGG, 15 genes) in colorectal cancer patients from the TCGA dataset, clustered by gene expression profiles. The bar at the top of the heatmap indicates adjacent normal and tumor samples (E) Real-time PCR was performed on Responder and Non-responder rectal patient samples for genes found to be upregulated in tumor samples compared with normal samples to verify the most significant DEGs, ultimately, 3 stable DEGs were screened out. (F–H) Protein extracts from matched normal and tumor samples were resolved on SDS-PAGE gels, and western blotting was performed for (F) Lipin1, (G) DGAT2, (H)FASN, and DGAT1. (I) Representative IF staining of LDs via Lipin1 antibody in human colorectal responder/non-responders tumor and its adjacent normal samples. The nucleus was stained with DAPI. Scale bar 10 μm.
Fig. 2
Fig. 2
CRC DTPs show abundant lipid droplet formation with an increase in Lipin1 levels (A) Schematic representation of the development of CRC DTP cells (FP- 5 FU persisters, FIP- 5 FU + Irinotecan persisters, FOP- 5 FU + Oxaliplatin persisters) through chemotherapy treatment of parental cells, PC. The proliferation of dormant residual tumor cells was observed after a long-term drug holiday. (B) Representative phase contrast images (20x magnification) of the different CRC DTP cell lines. (C) Heatmap of log2 fold changes in representative lipids in DFP, DFIP, and DFOP DTP cells of DLD1 analyzed by LC-MS. DAG, Diacylglycerol; TAG, Triacylglycerol. (DE) Fluorescence imaging of lipid droplets stained with (D) BODIPY 493/503 and (E) HCS LipidTox™ in DLD1 WT and persister cells. Scale bar 5 μm. (F) Protein extracts were prepared from the indicated cell lines and resolved on SDS-PAGE, followed by western blotting with antibodies against the indicated proteins. Notably, lipin1 and DGAT2 levels are higher in DTP cells than in parental cells. Western blots for α tubulin served as a loading control.
Fig. 3
Fig. 3
Targeting the PA to DAG conversion step with statins or lipin1 knockdown induces ferroptosis in CRC DTPs. (A) Heatmap illustrating the impact of various de novo lipogenesis (DNL) inhibitors on the viability of colorectal DTPs. WT and DTP cells were treated with specified drug doses for 72 h, followed by cell titer Glo assay. The color intensity denotes viability based on MTT assay readings ranging from 0 (red, cytotoxic) to 1 (green, growth). The drug concentrations are in μM. (B) DFIP persister cells were treated with Pravastatin or Lovastatin and protein extracts were prepared and were resolved on SDS-PAGE gels, followed by Western blots with antibodies to the indicated proteins. Western blots for GAPDH served as a loading control. (C) The indicated cell lines were treated with the following drugs in the absence or presence of statin. Cell viability (2D cell titer glo) is presented as a percentage of untreated cells. The mean values of the three experiments are shown. (D) Lipin1 was knocked down in the DFIP cells and then treated with the following drugs in the absence or presence of statin. Cell viability (2D cell titer glo) is presented as a percentage of untreated cells. The mean values of the three experiments are shown. (E) The indicated cell lines were pretreated with the indicated cell death inhibitors for 1 h and then for an additional 72 h in the absence or presence of pravastatin. Cell viability (2D cell titer glo) is presented as a percentage of untreated cells. The mean values of the three experiments are shown. Note: Ferroptosis inhibitors rescue cell death induced by Pravastatin. (F) Heatmaps depict normalized expression levels of a Ferroptosis-related gene signature (KEGG, 6 genes) in colorectal cancer patients from the TCGA dataset, categorized by unsupervised clustering of gene expression. The bar above the heatmap indicates adjacent normal and tumor samples. (G) Volcano blot showing the abundance of ferroptosis inhibition gene in colon patient samples. (H) Survival blot of patients showing high and low levels of GPX4. (I) Real-time PCR analysis was conducted on Responder and non-responder patient samples to validate significantly differentially expressed ferroptosis genes compared with those in normal tissue. (J) Protein extracts were prepared from the indicated cell lines and were resolved on SDS-PAGE gels followed by Western blots with antibodies to the indicated proteins. Note that GPX4 levels are higher in DTP cells. Western blots for α tubulin served as a loading control.
Fig. 4
Fig. 4
Colorectal Drug tolerant persister cells show increased ferroptosis upon inhibition of Lipid droplets: (A)A heatmap displays lipid reactive oxygen species (ROS) levels in cells treated with pravastatin or lovastatin, with or without ferroptosis inhibitors for 12 h, stained with C11 BODIPY dye (10 μM). The green-to-red ratio indicates lipid ROS intensity, with TBPH (100 μM, 3 h) used as a positive control. (B) The heatmap shows the effects of total ROS on cells treated either with pravastatin or lovastatin with or without inhibitors of Ferroptosis for 12 h. The mean and SD are plotted. (C) Another heatmap shows the levels of glutathione (GSH) in cells treated as described in (F) using the GSH Glo kit for 12 h 0 (Red, high GSH) to 1 (Blue, low GSH). (D) Representative TEM imaging (n = 20 images in total) of the Lipid droplets and mitochondria in CRC DFIP treated with/without Pravastatin (2 μM) or Lovastatin (2 μM) or Src inhibitor (1 μM) for 24 h. Scale bars, 5 or 10 μm, as indicated. Red arrows indicate Lipid droplets, and yellow arrows indicate mitochondria. (EH) Representative fluorescence microscopy images (20x magnification) acquired by IncuCyte live-cell analysis system and average integrated intensity to detect lipid peroxidation after exposure to (EF) Pravastatin (2 μM), Lovastatin (2 μM) or Src inhibitor (1 μM) for 4 h or (GH) lipin1 knockdown in DFIP cells followed by incubation with lipid probe BODIPY 581/591 in CRC DFOP. A red-to-green shift in fluorescence shows lipid peroxidation. The drug concentrations are in μM. Where indicated, the p-value was determined by the student's t-test (∗∗∗p < 0.001, ∗∗p < 0.01, ∗p < 0.05).
Fig. 5
Fig. 5
Colorectal DTPs upregulate lipid droplets via the PTPN1- c-Src-CEBPβ-LPIN1 pathway. (A) Protein extracts were prepared from the WT and the persister cell lines and were resolved on SDS-PAGE gels followed by western blots with ETS1 antibody. Note that ETS1 levels are increased in the CRC DTP cells. Western blots for GAPDH served as a loading control. (B) Protein extracts were prepared from the WT and the persister cell lines and were resolved on SDS-PAGE gels followed by Western blotting with p-Src (Y416) antibody. Note that Increased p-Src levels are observed in CRC DTP cells. Western blots for GAPDH served as a loading control. (C) Protein extracts were prepared from the DFOP and DFIP persister cell lines treated with Src inhibitor for 24 h and were resolved on SDS-PAGE gels followed by western blotting with the indicated antibodies. Western blots for α-tubulin served as a loading control. (D) Protein extracts were prepared from the WT and the persister cell lines and were resolved on SDS-PAGE gels followed by Western blots with PTP1B antibody. Note that PTP1B levels are increased in the CRC DTP cells. Western blots for α-tubulin served as a loading control. (E) ChIP assays were performed using either a non-specific rabbit IgG (IgG) or ETS1 antibody from the indicated cell, followed by qPCR to detect the PTP1B (PTPN1) promoter. The mean and SD are plotted. (F) ETS1 was knocked down in the DFIP persister; protein extracts were prepared and were resolved on SDS-PAGE gels, followed by western blotting with the indicated antibodies. Note that Knockdown of ETS1 in DFIP persister cells reduces lipin1 and PTP1B levels. Western blots for GAPDH served as a loading control. (G) Protein extracts were prepared from the WT and the persister cell lines and were resolved on SDS-PAGE gels, followed by western blotting with anti CEBPβ antibody. Note that increased CEBPβ levels are observed in CRC DTP cells. Western blots for GAPDH served as a loading control. (H) Protein extracts were prepared from the DFIP persister cell lines treated with Src inhibitor for 24 h and were resolved on SDS-PAGE gels followed by western blotting with the CEBPβ antibody. Western blots for GAPDH served as a loading control. (I) ChIP assays were performed using either a non-specific rabbit IgG (IgG) or CEBPβ antibodies from the indicated cell, followed by qPCR to show enrichment of CEBPβ on the LPIN1 promoter. The mean and SD are plotted. (J) CEBPβ was knocked down in the DFIP persister cells, and protein extracts were prepared and resolved on SDS-PAGE gels, followed by western blotting with the indicated antibodies. Note that Knockdown of CEBPβ in DFIP persister cells reduces Lipin1 levels. Western blots for GAPDH served as a loading control. (K) Effects of simvastatin, lovastatin, and src inhibitors on CRC DTP spheroid growth. Representative images (20x magnification) of day 12 old spheroids (n = 6 spheroids) are shown. Scale bar, 100 μm. The average mean area of 12-day DFP, DFIP, and DFOP spheroids treated with simvastatin (2 μM), Lovastatin (2 μM), or Src inhibitor (1 μM) are shown. Where indicated, the p-value was determined by the student's t-test (∗∗∗p < 0.001, ∗∗p < 0.01, ∗p < 0.05).
Fig. 6
Fig. 6
Colorectal DFIP and DFOP persister cells show increased tumor growth, and inhibiting PA to DAG conversion by repurposing statin reduces CRC DTP tumor growth in vivo and induces ferroptosis. 2∗ 106 cells of the DLD1 WT and persister cells were injected into immunocompromised mice, and (A) The tumor volume was monitored for 7 weeks. The mean and SEM are plotted on the Y-axis. p values were determined using a student's t-test. n = 6/group. (B) After 7 weeks, animals were sacrificed, and the tumors were excised and weighed. The mean and SEM are plotted on the Y-axis. p values were determined using a student's t-test. (ns = not significant). (C) Sections from the respective WT and persister-derived tumors were stained with antibodies against lipin1, GPX4, and TIP47. Note that the levels were elevated in mice injected with DFIP and DFOP as compared to mice injected with DFP or WT mice. Scale bar: 5 μm. (D) Schematic showing tumor implantation and drug administration schemes for the NOD SCID mouse tumor xenograft model. Immunocompromised mice were injected subcutaneously in the dorsal flank with 2 × 106 cells of the DLD1 FIP cells. Once the tumors reached a specific size (50–100 mm3), the mice were either injected with the vehicle control (PBS) or 30 mg/kg 5-FU (IP) thrice a week for 2 weeks with or without statin (120 mg/kg/day, oral gavage) and (E) the tumor volume was monitored for 6 weeks. The mean and SEM are plotted on the Y-axis. p values were determined using a student's t-test. n = 6/group. (F) After 6 weeks, animals were sacrificed, and the tumor was excised and weighed. The mean and SEM are plotted on the Y-axis. p values were determined using a student's t-test. (ns = not significant). (G) Animal weight was taken every week for 6 weeks. Note: that the average animal weight was not significantly different between groups, indicating that the treatments did not cause significant toxicity. (H) Sections from the respective WT and persister-derived tumors were stained with antibodies to Lipin1, GPX4, and TIP47. Notably, the levels were elevated in the mice injected with DFIP and DFOP as compared to mice injected with DFP or WT mice. Scale bar: 5 μm. (I) The heat map displays the drug response of C3 organoids to different statins at various concentrations. The luminescence was normalized to day 0, ranging from 0 (Blue, cytotoxic) to 1 (Green, growth). Drug concentrations are in μM. (J) CRC PDX was developed, and the mice were divided into 2 groups. Tumor volume of mice treated with different combinations for 6 weeks. The mean and SEM are plotted on the Y-axis. p values were determined using a student's t-test. (ns = not significant). n = 6/group. (K) Representative images of the tumors excised from treated and untreated PDX models. Where indicated, the P-value was determined by the student's t-test (∗∗∗P < 0.001, ∗∗P < 0.01, ∗P < 0.05).
Fig. 7
Fig. 7
Schematic model illustrating the function of lipin1 in regulating lipid homeostasis and the cytotoxic effects mediated by ferroptosis resulting from its inhibition directly or through statin in colorectal persister cells.

References

    1. Mármol I., et al. Colorectal carcinoma: a general overview and future perspectives in colorectal cancer. Int. J. Mol. Sci. 2017;18(1):197. - PMC - PubMed
    1. Briffa R., et al. Colorectal Cancer-Diagnosis. Screening and Management; 2017. Acquired and intrinsic resistance to colorectal cancer treatment; pp. 57–81.
    1. Vallam K.C., et al. Adenocarcinoma of the rectum—a composite of three different subtypes with varying outcomes? Clin. Colorectal Cancer. 2016;15(2):e47–e52. - PubMed
    1. Cheng C., et al. Lipid metabolism reprogramming and its potential targets in cancer. Cancer Commun. 2018;38(1):1–14. - PMC - PubMed
    1. Guo D., Bell E.H., Chakravarti A. Lipid metabolism emerges as a promising target for malignant glioma therapy. CNS oncology. 2013;2(3):289–299. - PMC - PubMed

MeSH terms

Substances