. 2025 Jan 14;20(1):102377.
doi: 10.1016/j.stemcr.2024.11.007. Epub 2024 Dec 19.

Swift induction of human spinal lower motor neurons and robust ALS cell screening via single-cell imaging

Affiliations

Swift induction of human spinal lower motor neurons and robust ALS cell screening via single-cell imaging

Selena Setsu et al. Stem Cell Reports. .

Abstract

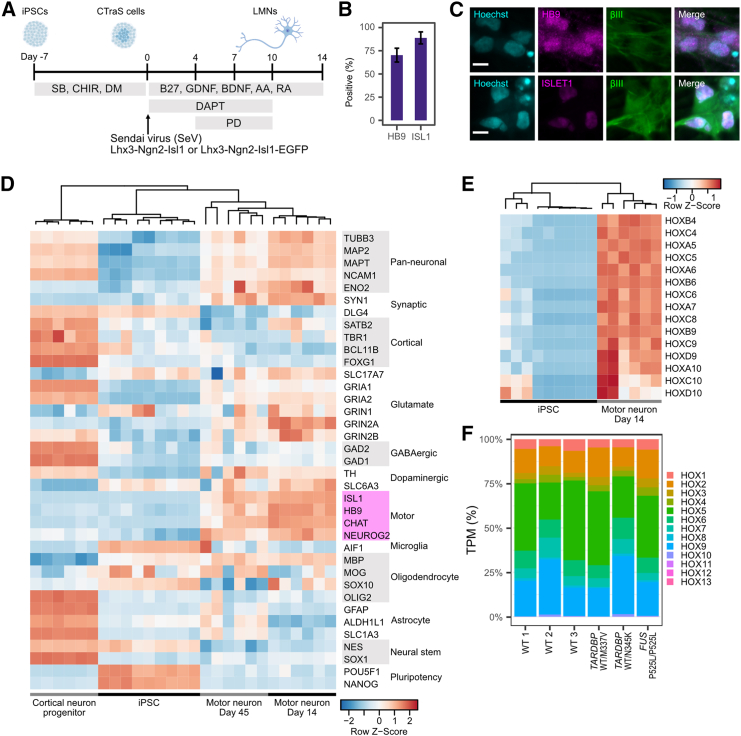
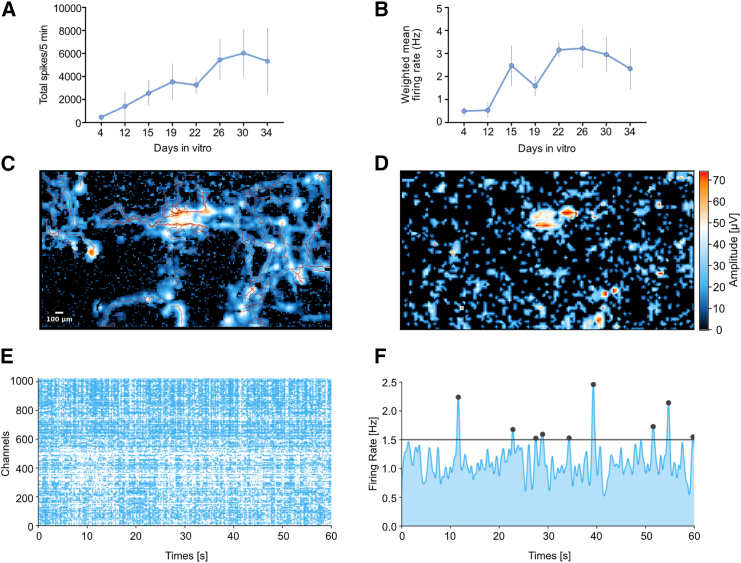
This study introduces a novel method for rapidly and efficiently inducing human spinal lower motor neurons (LMNs) from induced pluripotent stem cells (iPSCs) to eventually elucidate the pathomechanisms of amyotrophic lateral sclerosis (ALS) and facilitate drug screening. Previous methods were limited by low induction efficiency, poor LMN purity, or labor-intensive induction and evaluation processes. Our protocol overcomes these challenges, achieving around 80% induction efficiency within just two weeks by combining a small molecule-based approach with transcription factor transduction. Moreover, to exclude non-LMN cells from the analysis, we utilized time-lapse microscopy and machine learning to analyze the morphology and viability of iPSC-derived LMNs on a single-cell basis, establishing an effective pathophysiological evaluation system. This rapid, efficient, and streamlined protocol, along with our single-cell-based evaluation method, enables large-scale analysis and drug screening using iPSC-derived motor neurons.

Keywords: ALS; disease modeling; iPSC; image analysis; machine learning; motor neuron; single-cell analysis.


Conflict of interest statement

Declaration of interests H.O. reports grants and personal fees from K Pharma Inc and SanBio Co. Ltd., outside the submitted work.

Figures

Figure 1
Figure 1
High efficiency and accuracy in differentiating spinal lower motor neurons (A) Schematic illustration of the differentiation protocol. Sendai viruses were applied at MOI 5. (B) Differentiation efficiency at day 7 based on immunocytochemistry of HB9 and ISLET. Error bar is the standard deviation. n = 8 biological replicates (different cell lines). (C) Representative immunocytochemistry image of induced LMNs stained for HB9 (magenta), ISLET1 (magenta), and TUBB3 (green), and counterstained with Hoechst (cyan). Day 7 is shown. Scale bar, 10 μm. (D) Expression profile of major marker genes in accordance with RNA-seq analysis. Data of cortical neuron progenitors and iPSCs were downloaded from the Sequence Read Archive (SRA) dataset. BioProject IDs are PRJNA660028, PRJNA801842, and PRJNA803470. Cell lines used for MN day 14 and 45 are three WT lines (201B7, WD39, and 414C2) and three ALS lines (A3411 (TARDBPWT/M337V), SM4-4-5 (TARDBPWT/N345K), and FUS-008-1-E6 (FUSP525L/P525L)). Marker genes for motor neuron are highlighted in magenta. (E) Expression profile of major HOX regional marker genes for spinal cord in accordance with RNA-seq analysis. (F) Hox gene expression pattern was calculated based on TPM. TPM expression of each group of Hox genes was summed and divided by total Hox gene expression.
Figure 2
Figure 2
LMN showed spontaneous functional activity (A) Total number of spikes that correspond to local field potential activity was measured within 5 min of MEA recording. Plot shows mean ± SEM from 3 independent wells. (B) The weighted mean firing rates were computed as the average firing rates corrected for the number of active electrodes. Plot shows mean ± SEM from 3 independent wells. (C) Axon tracking analysis by using the MaxOne MEA system, correspond to Table S2. (D) Network activity map measured by MaxOne MEA, showing strong action potential activity. (E) Representative raster plot from one of the active neuron sites; the plot above each raster plot shows each spike detected for each electrode over a 1 min recording period. (F) Mean firing rate activity was measured over a 1 min recording period.
Figure 3
Figure 3
Spinal lower motor neurons derived from ALS-iPSCs exhibit distinct protein aggregation (A) Representative images of the granule recognition strategy. Each cell was recognized based on Hoechst staining. The soma was defined by the collar function, and granules were recognized by the robust puncta function of IN Carta. The last image shows segmented cells with nuclei (cyan), soma (gray), and granules (pink). Misrecognized dead cells or HB9-negative cells, such as a–c in the image, were removed from analysis by defining them using Phenoglyphs of IN Carta. In the figure a–c are dead cells with fragmented small nuclei and d–f are live positive cells. Scale bar, 10 μm. (B) Representative images of TDP-43 and FUS granule recognition in each cell line. Scale bar, 10 μm. (C) Mean cytosolic granule area per cell. Results were from three to four independent experiments. Two-tailed Dunnett’s test was performed. p < 0.05, ∗∗p < 0.01; ∗∗∗p < 0.001; ns, non-significant.
Figure 4
Figure 4
Spinal lower motor neurons derived from ALS-iPSCs show reduced outgrowth of neurites (A) Representative image of neurite (green) and soma (randomly assigned color) recognition based on EGFP florescence on days 7 and 13. Scale bar, 160 μm. (B) Total neurite length of each well was normalized by dividing by the corresponding neurite length at day 3. n = 3–5 independent experiments. Normalized maximum neurite length was compared and tested using Dunnett’s test. (C) Total cell number of each well was normalized by dividing by the cell number on day 3. n = 3–5 independent experiments. Normalized minimum cell number was compared and tested using Dunnett’s test. For (B) and (C), error bars represent standard error. p < 0.05; ∗∗p < 0.01; ∗∗∗p < 0.001; ns, non-significant.
Figure 5
Figure 5
Single-cell tracking and survival analysis revealed that ALS-iPSC-induced LMN dies faster than WT controls (A) Experimental scheme. (B) Representative image of cell tracking. The white arrowhead indicates the tracked cell. (Top) EGFP images are overlaid on phase contrast images. (Down) EGFP images. (C) Survival curves were compared between ALS cell lines and WT control cell lines (201B7 and WD39). p values were calculated by the log rank test corrected with the Benjamini-Hochberg procedure.

References

    1. Arai T., Hasegawa M., Akiyama H., Ikeda K., Nonaka T., Mori H., Mann D., Tsuchiya K., Yoshida M., Hashizume Y., Oda T. TDP-43 is a component of ubiquitin-positive tau-negative inclusions in frontotemporal lobar degeneration and amyotrophic lateral sclerosis. Biochem. Biophys. Res. Commun. 2006;351:602–611. doi: 10.1016/j.bbrc.2006.10.093. - DOI - PubMed
    1. Baxi E.G., Thompson T., Li J., Kaye J.A., Lim R.G., Wu J., Ramamoorthy D., Lima L., Vaibhav V., Matlock A., et al. Answer ALS, a large-scale resource for sporadic and familial ALS combining clinical and multi-omics data from induced pluripotent cell lines. Nat. Neurosci. 2022;25:226–237. doi: 10.1038/s41593-021-01006-0. - DOI - PMC - PubMed
    1. Bonaventura G., Iemmolo R., Attaguile G.A., La Cognata V., Pistone B.S., Raudino G., D’Agata V., Cantarella G., Barcellona M.L., Cavallaro S. iPSCs: A Preclinical Drug Research Tool for Neurological Disorders. Int. J. Mol. Sci. 2021;22:4596. doi: 10.3390/ijms22094596. - DOI - PMC - PubMed
    1. Campbell B.C., Nabel E.M., Murdock M.H., Lao-Peregrin C., Tsoulfas P., Blackmore M.G., Lee F.S., Liston C., Morishita H., Petsko G.A. mGreenLantern: a bright monomeric fluorescent protein with rapid expression and cell filling properties for neuronal imaging. Proc. Natl. Acad. Sci. USA. 2020;117:30710–30721. doi: 10.1073/pnas.2000942117. - DOI - PMC - PubMed
    1. Castillo Bautista C.M., Sterneckert J. Progress and challenges in directing the differentiation of human iPSCs into spinal motor neurons. Front. Cell Dev. Biol. 2023;10 doi: 10.3389/fcell.2022.1089970. - DOI - PMC - PubMed

Publication types

MeSH terms