. 2025 Feb 20;85(4):770-786.e7.
doi: 10.1016/j.molcel.2024.11.025. Epub 2024 Dec 19.

RNA sensing induced by chromosome missegregation augments anti-tumor immunity

Affiliations

RNA sensing induced by chromosome missegregation augments anti-tumor immunity

Nobunari Sasaki et al. Mol Cell. .

Abstract

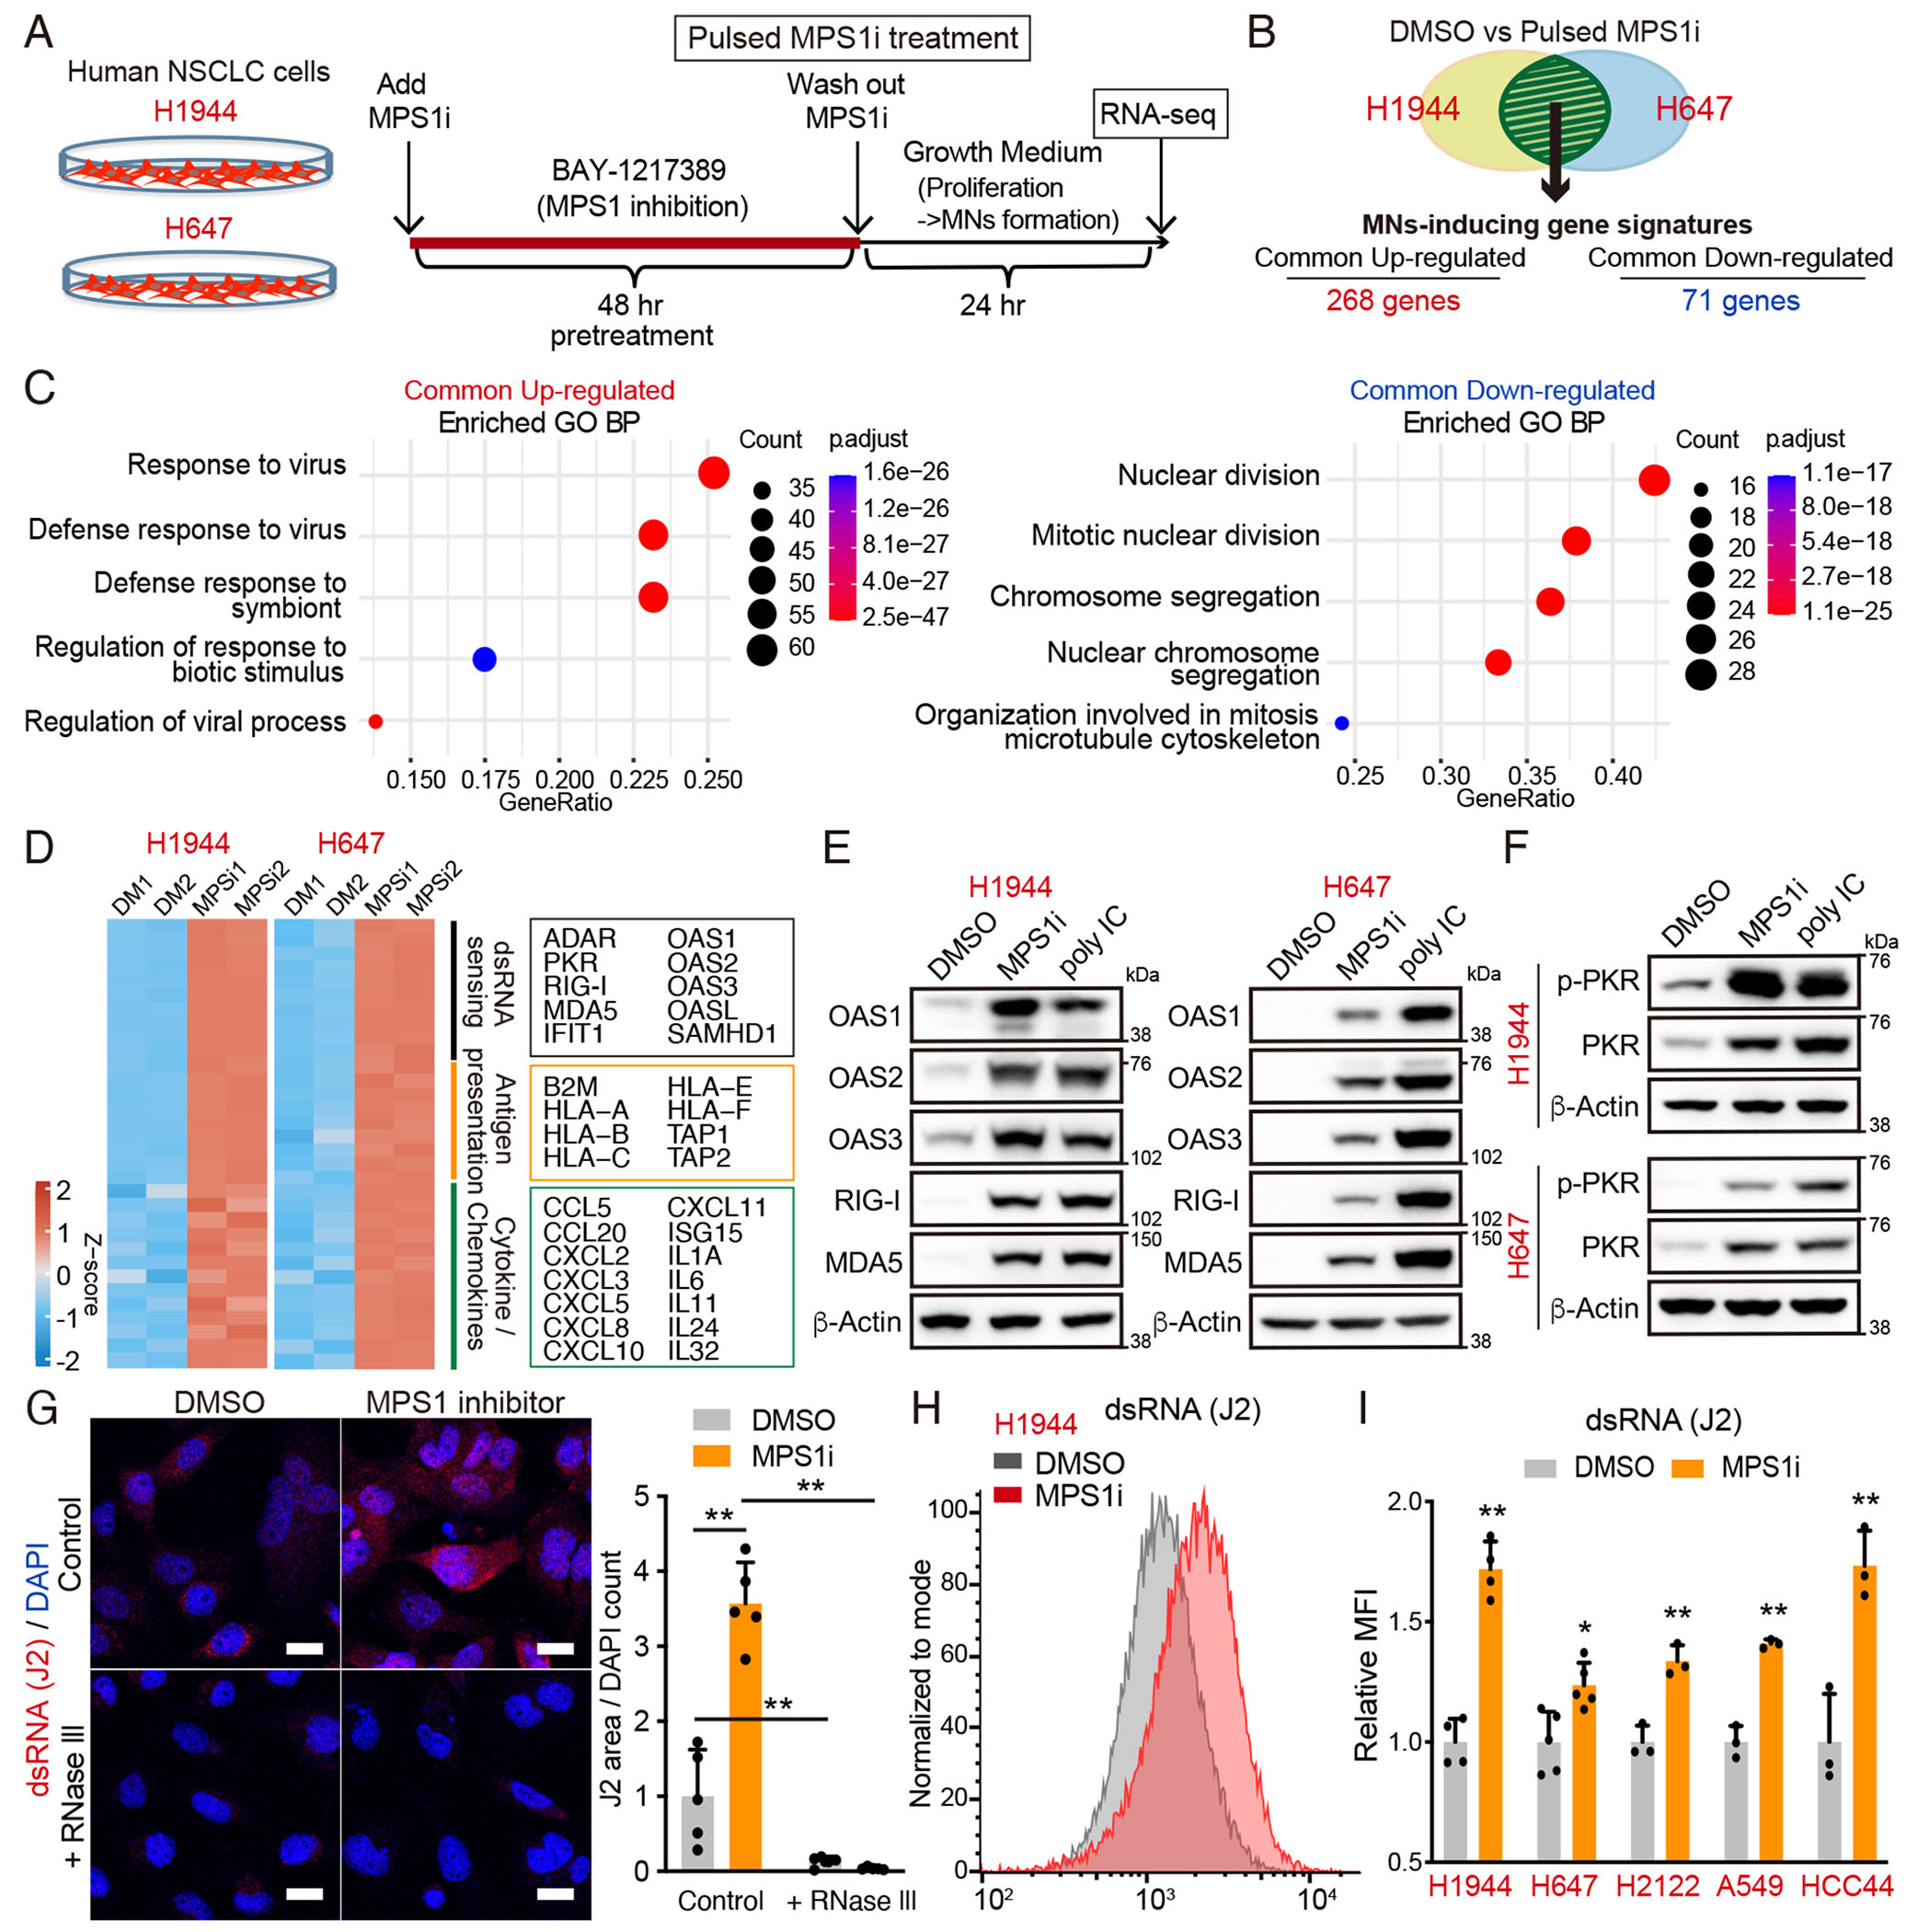
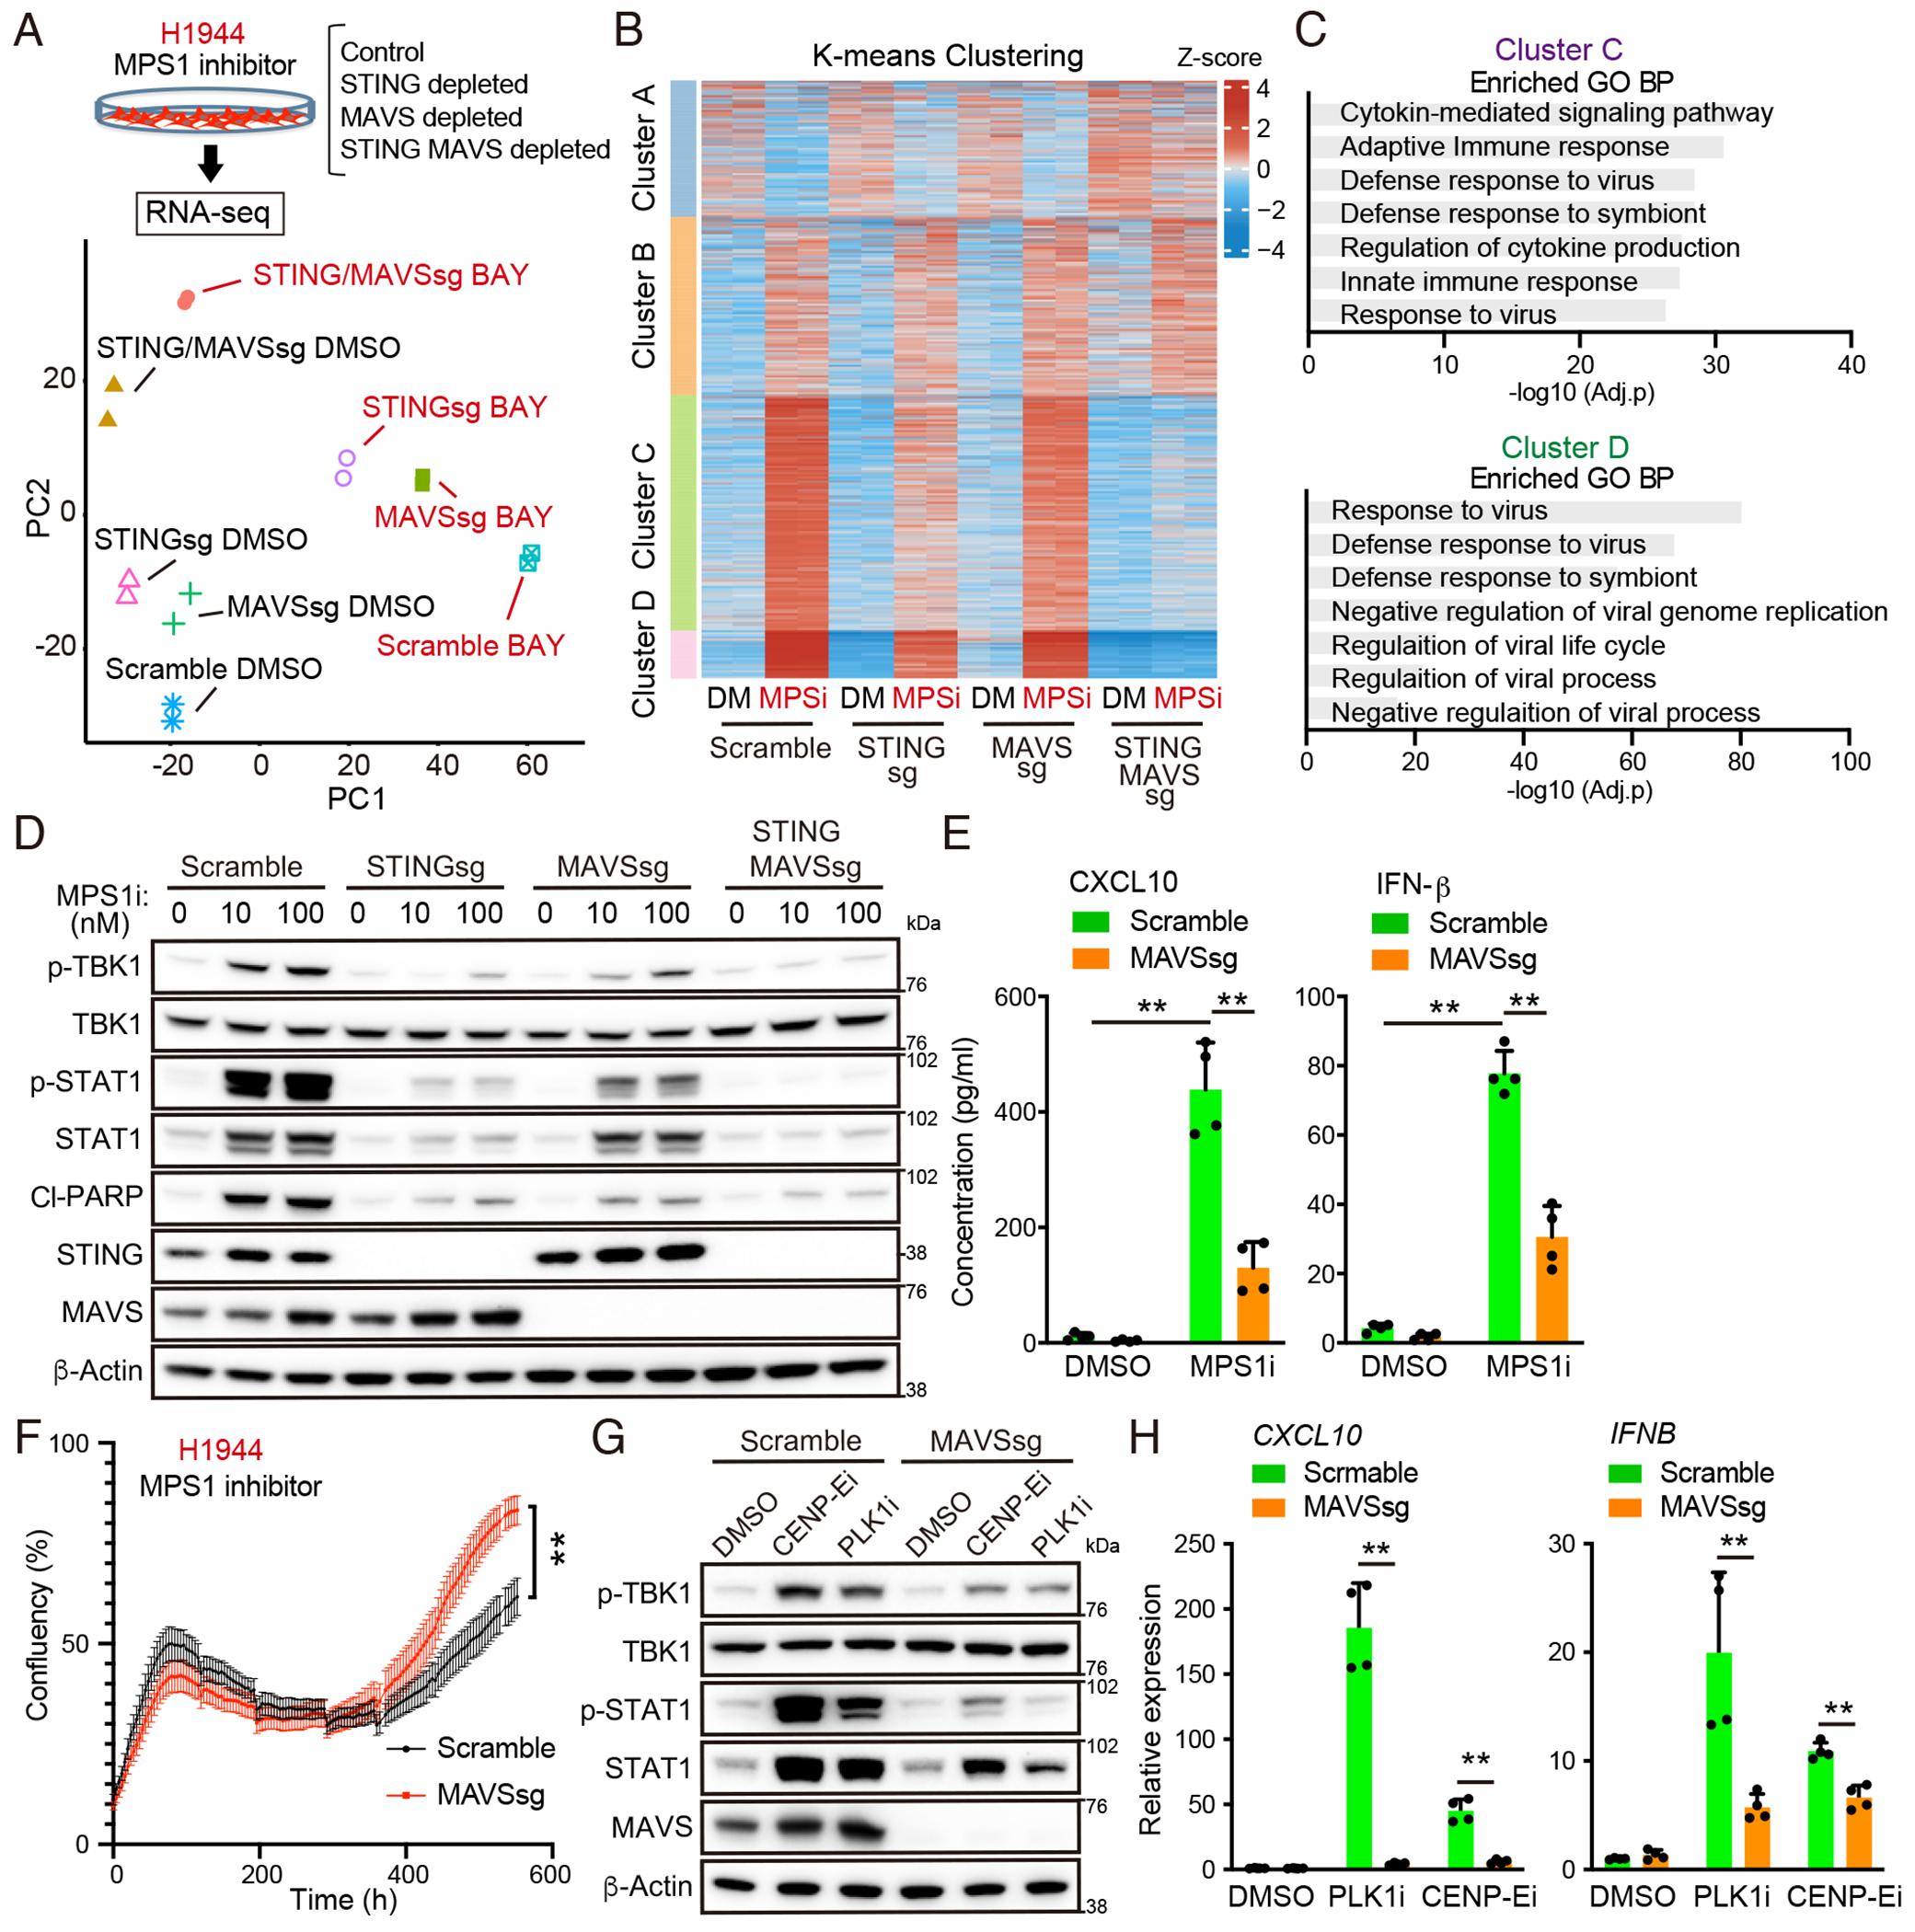
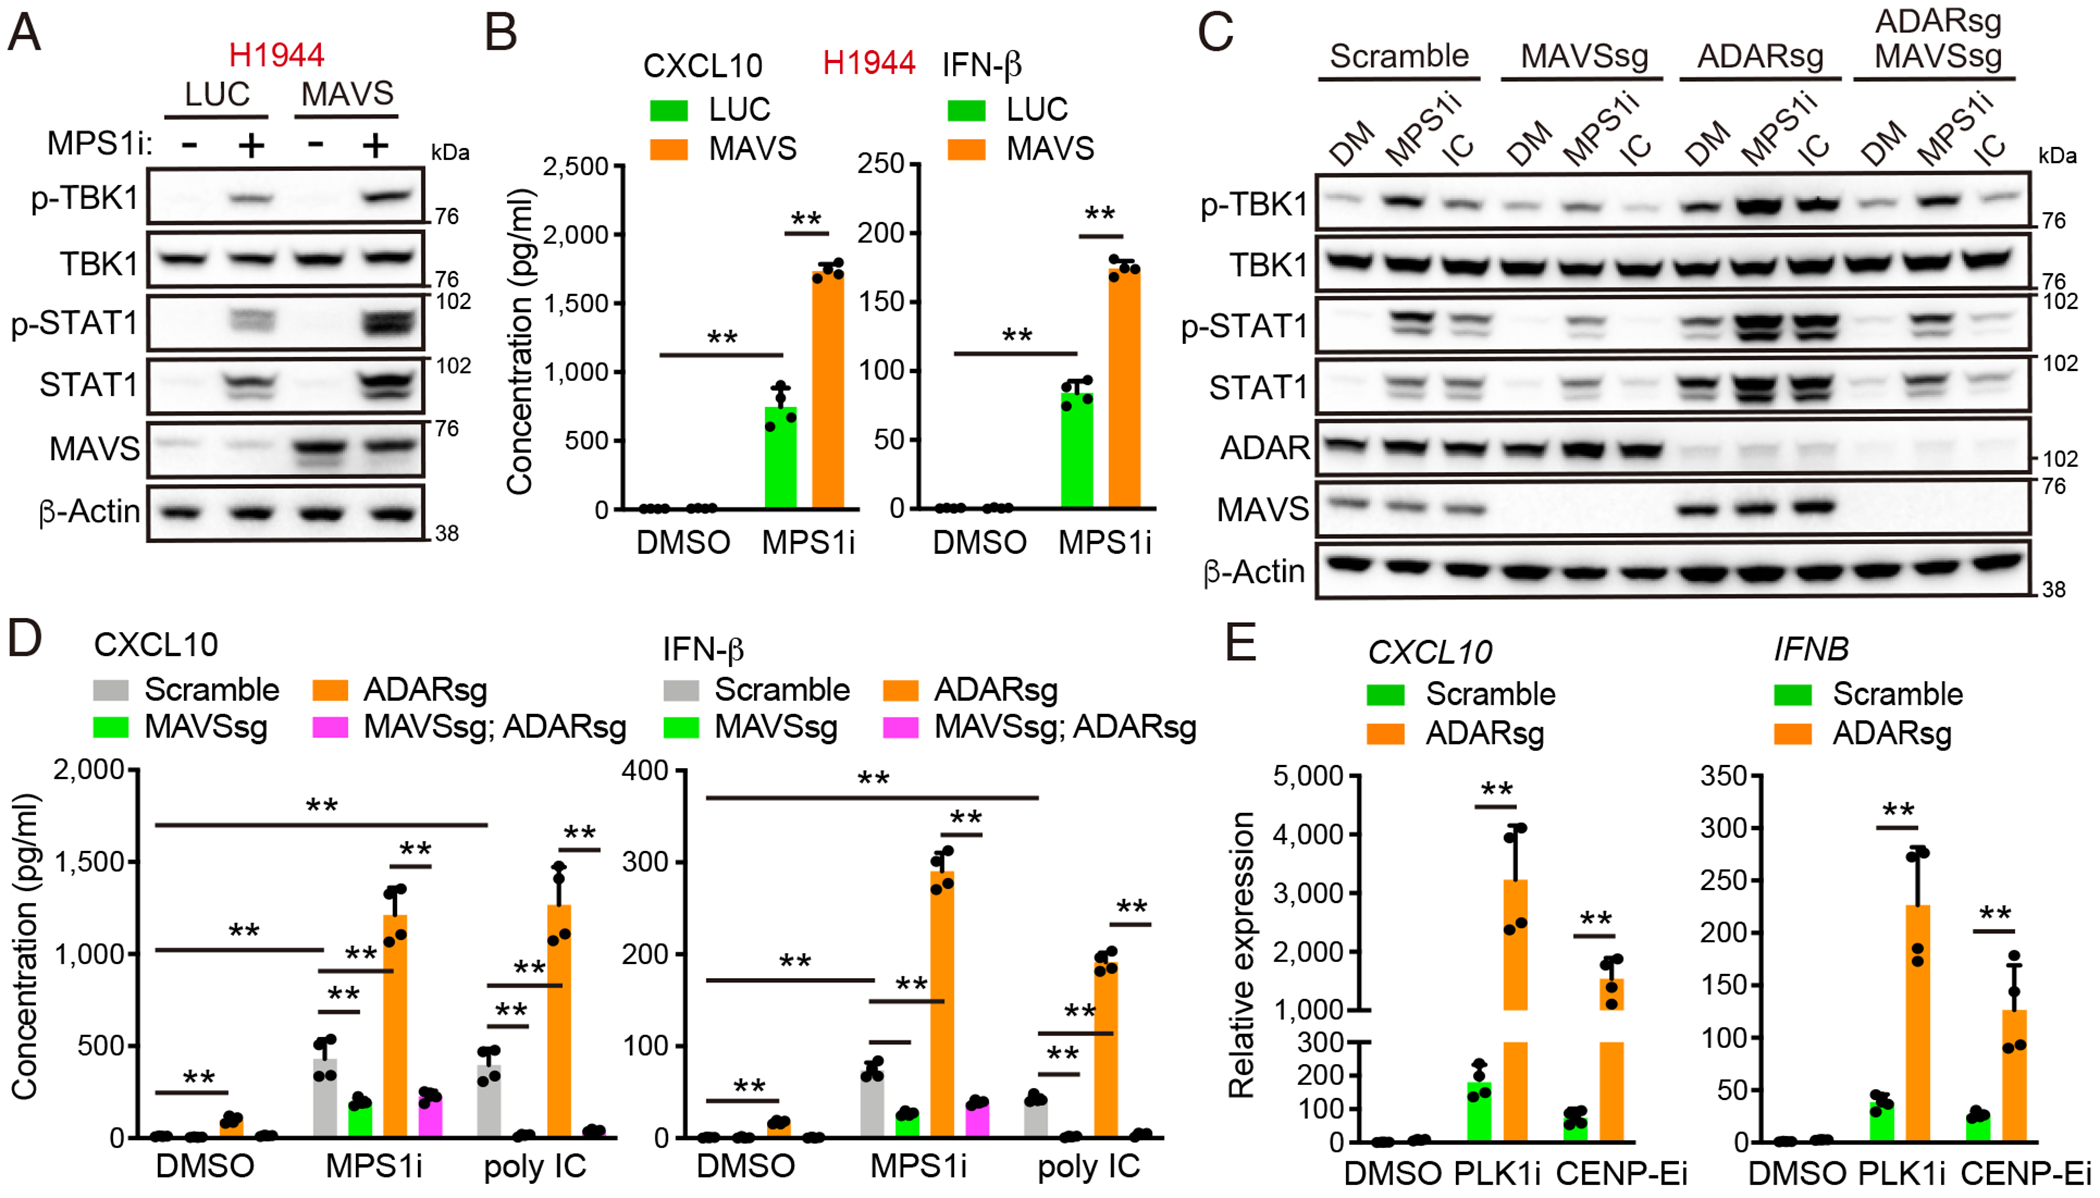
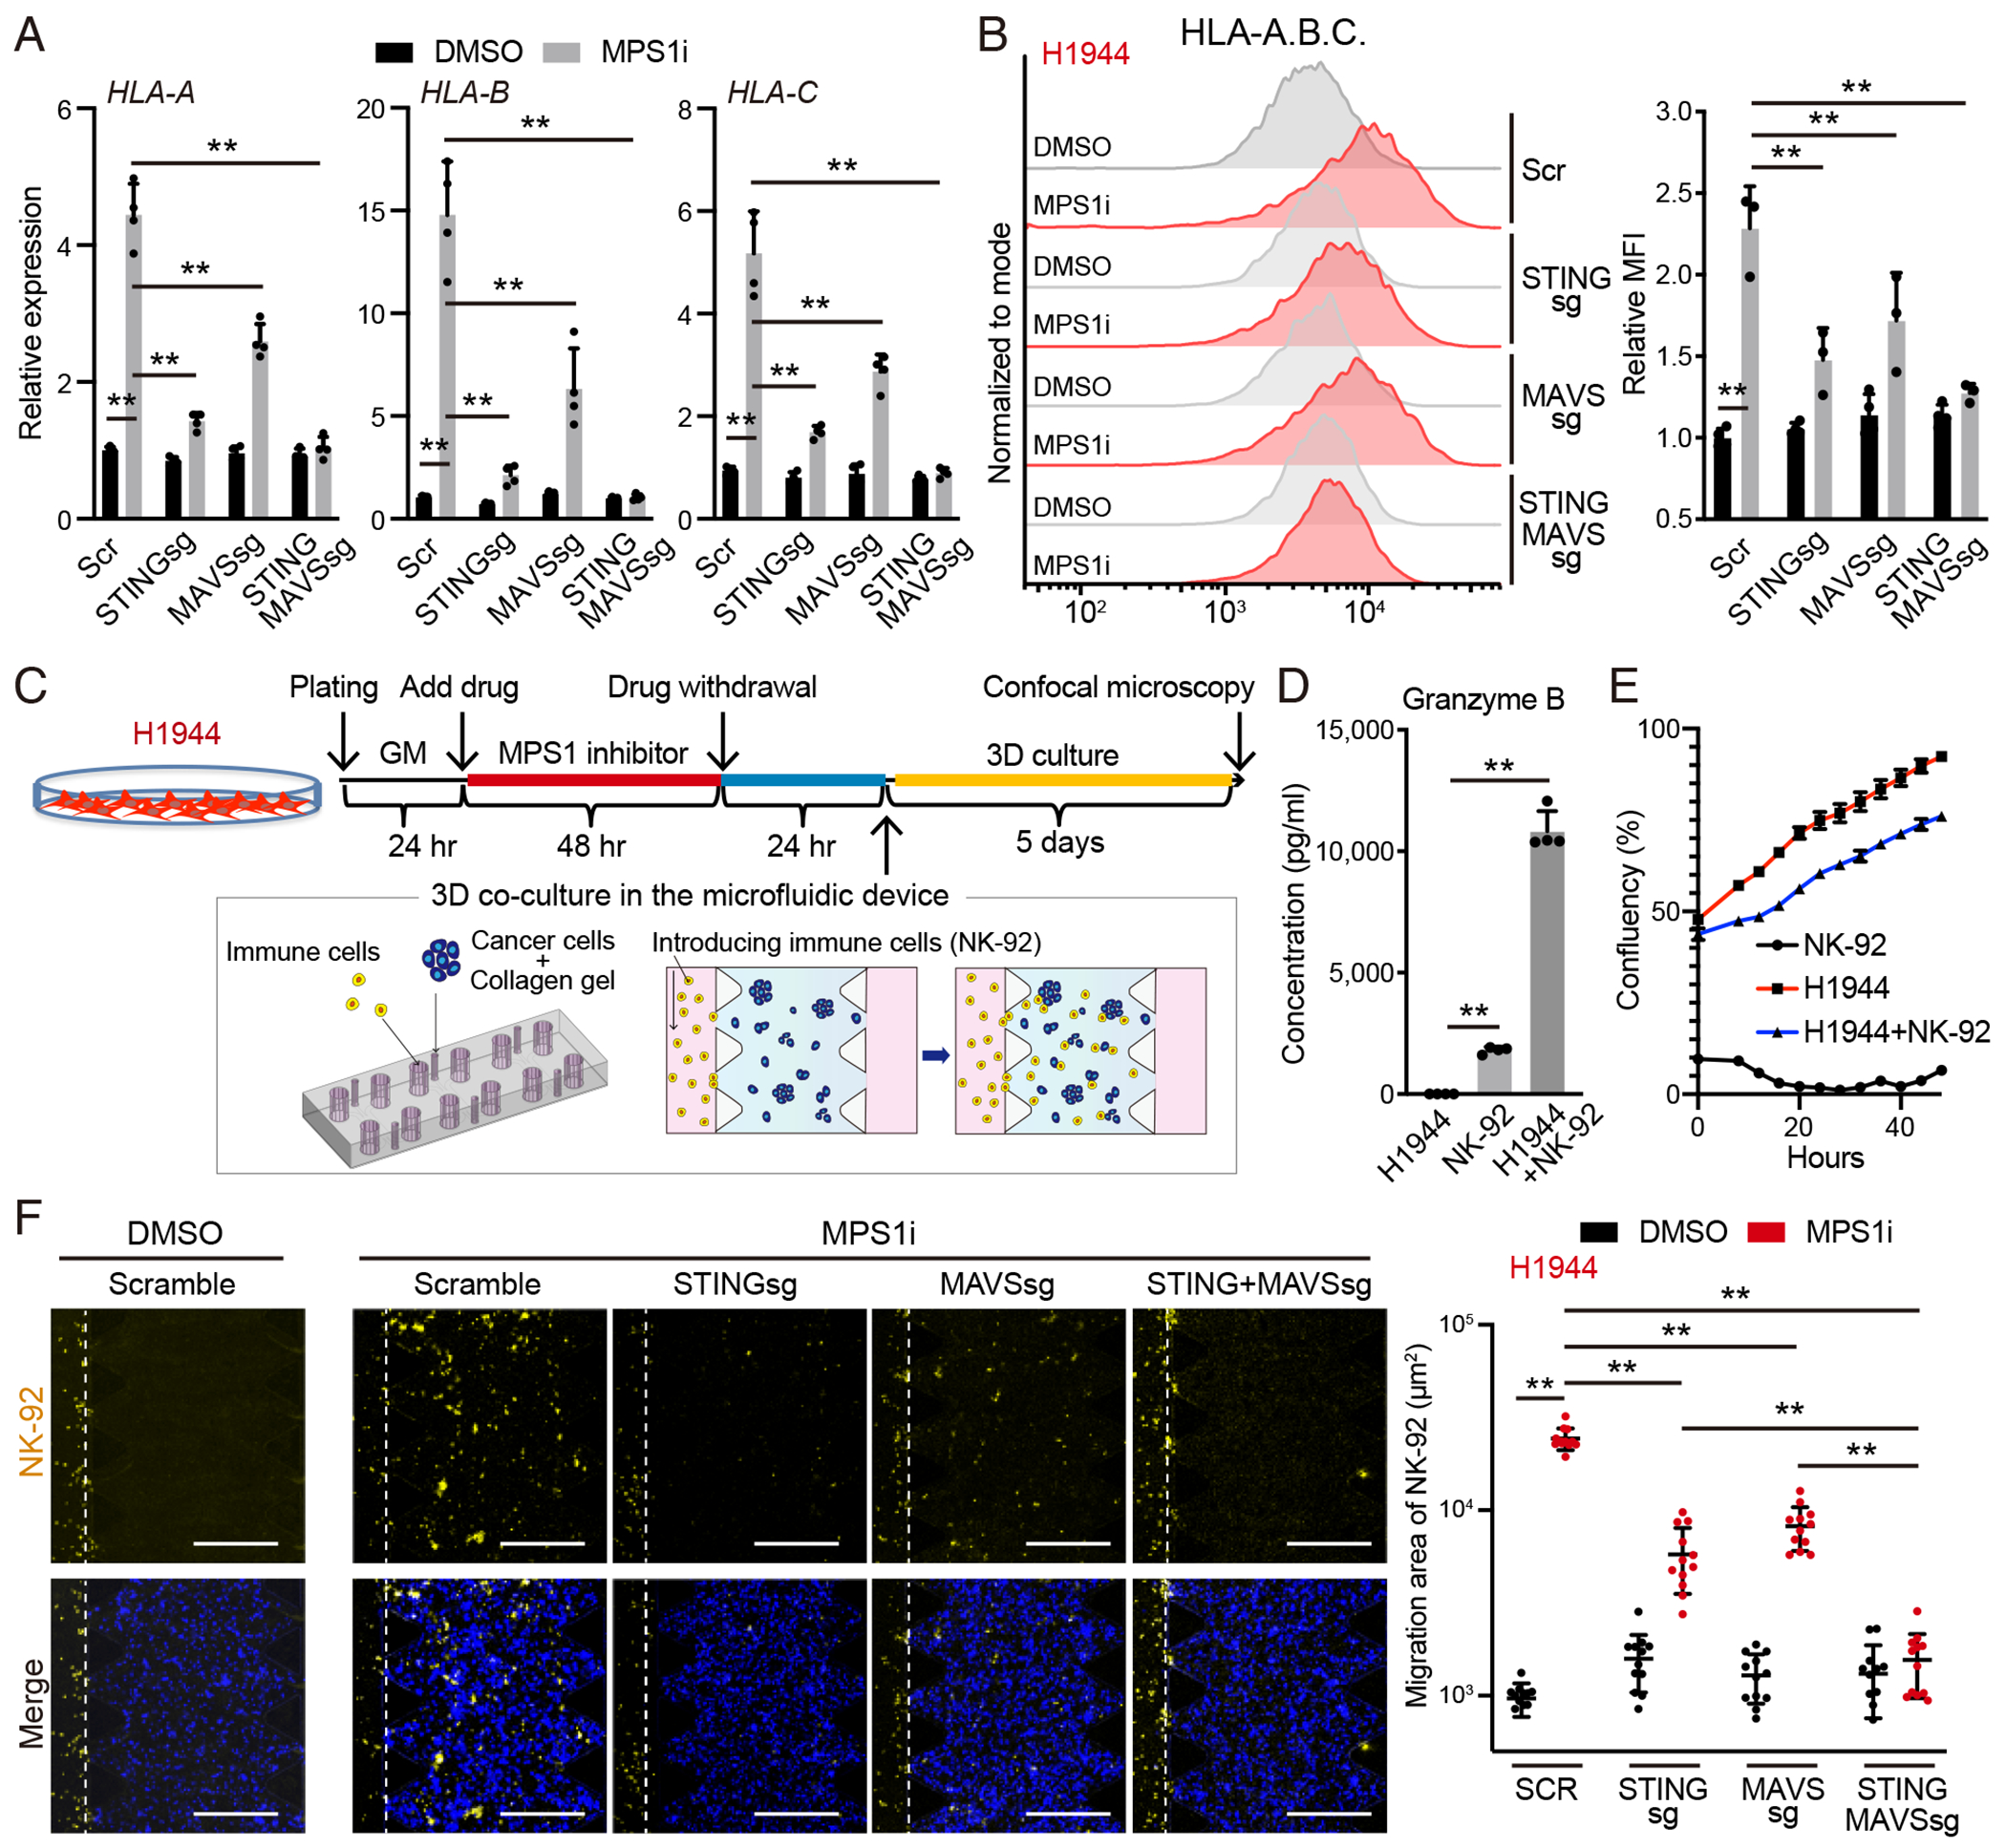
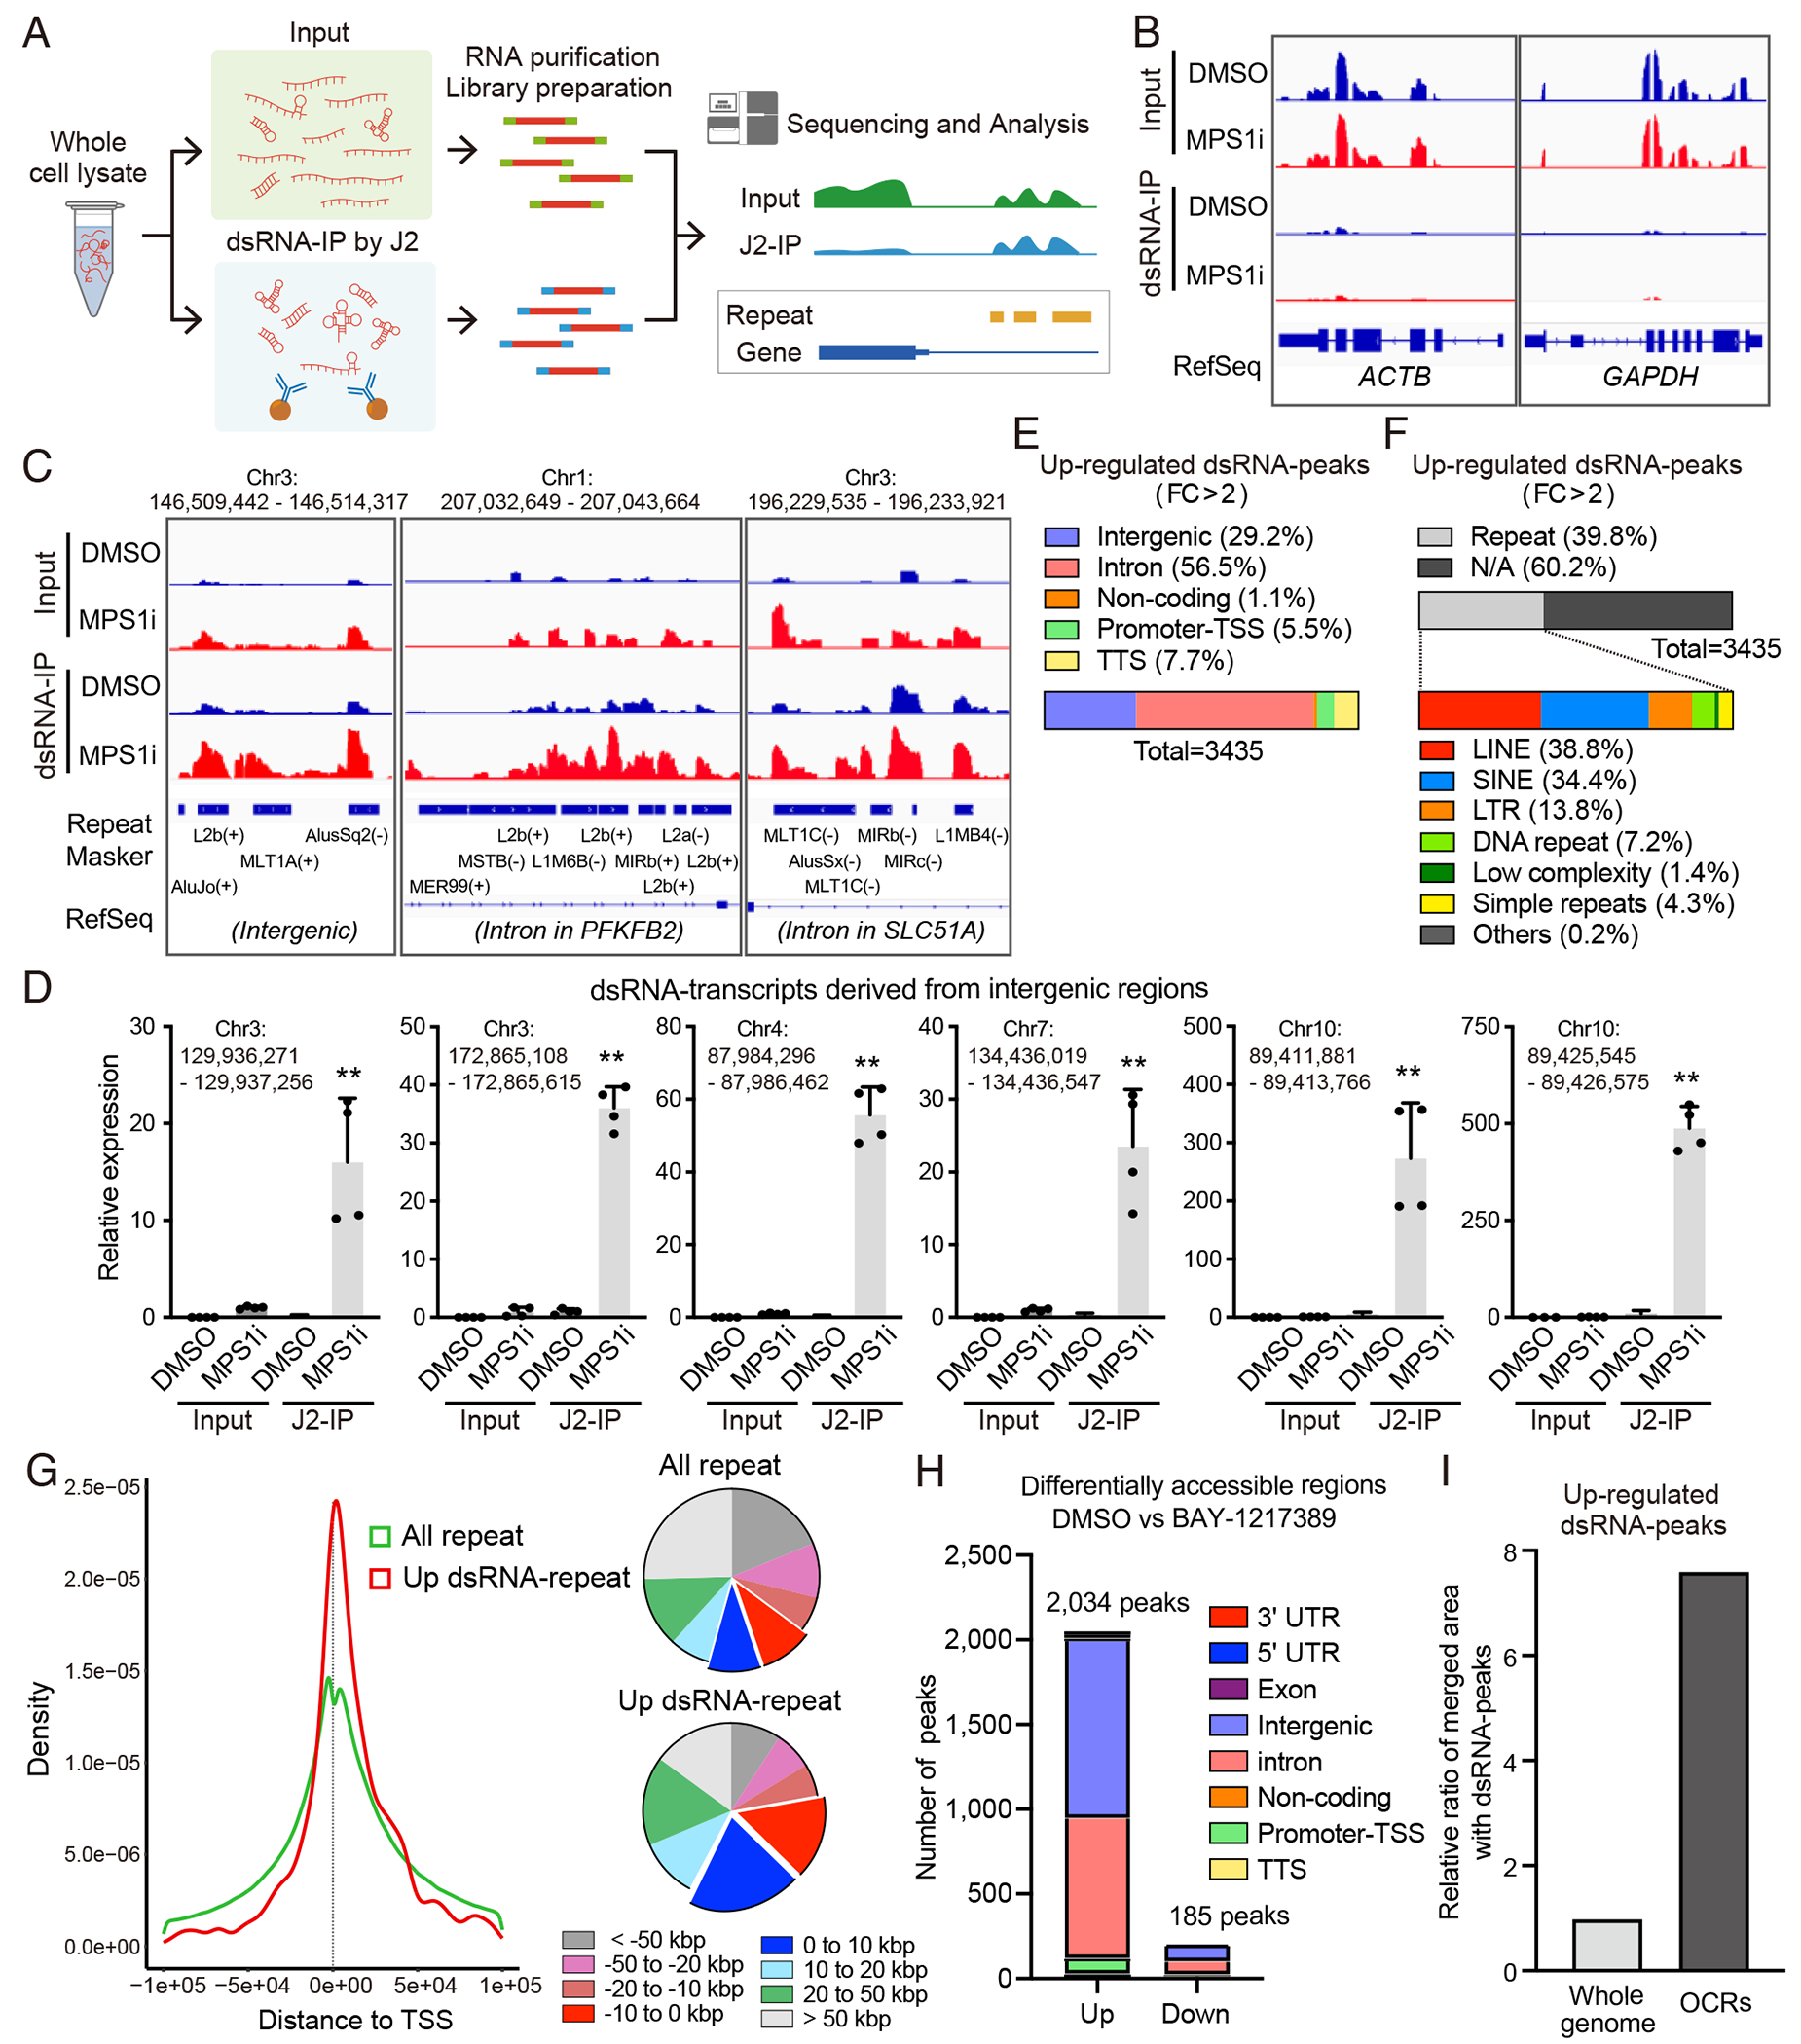
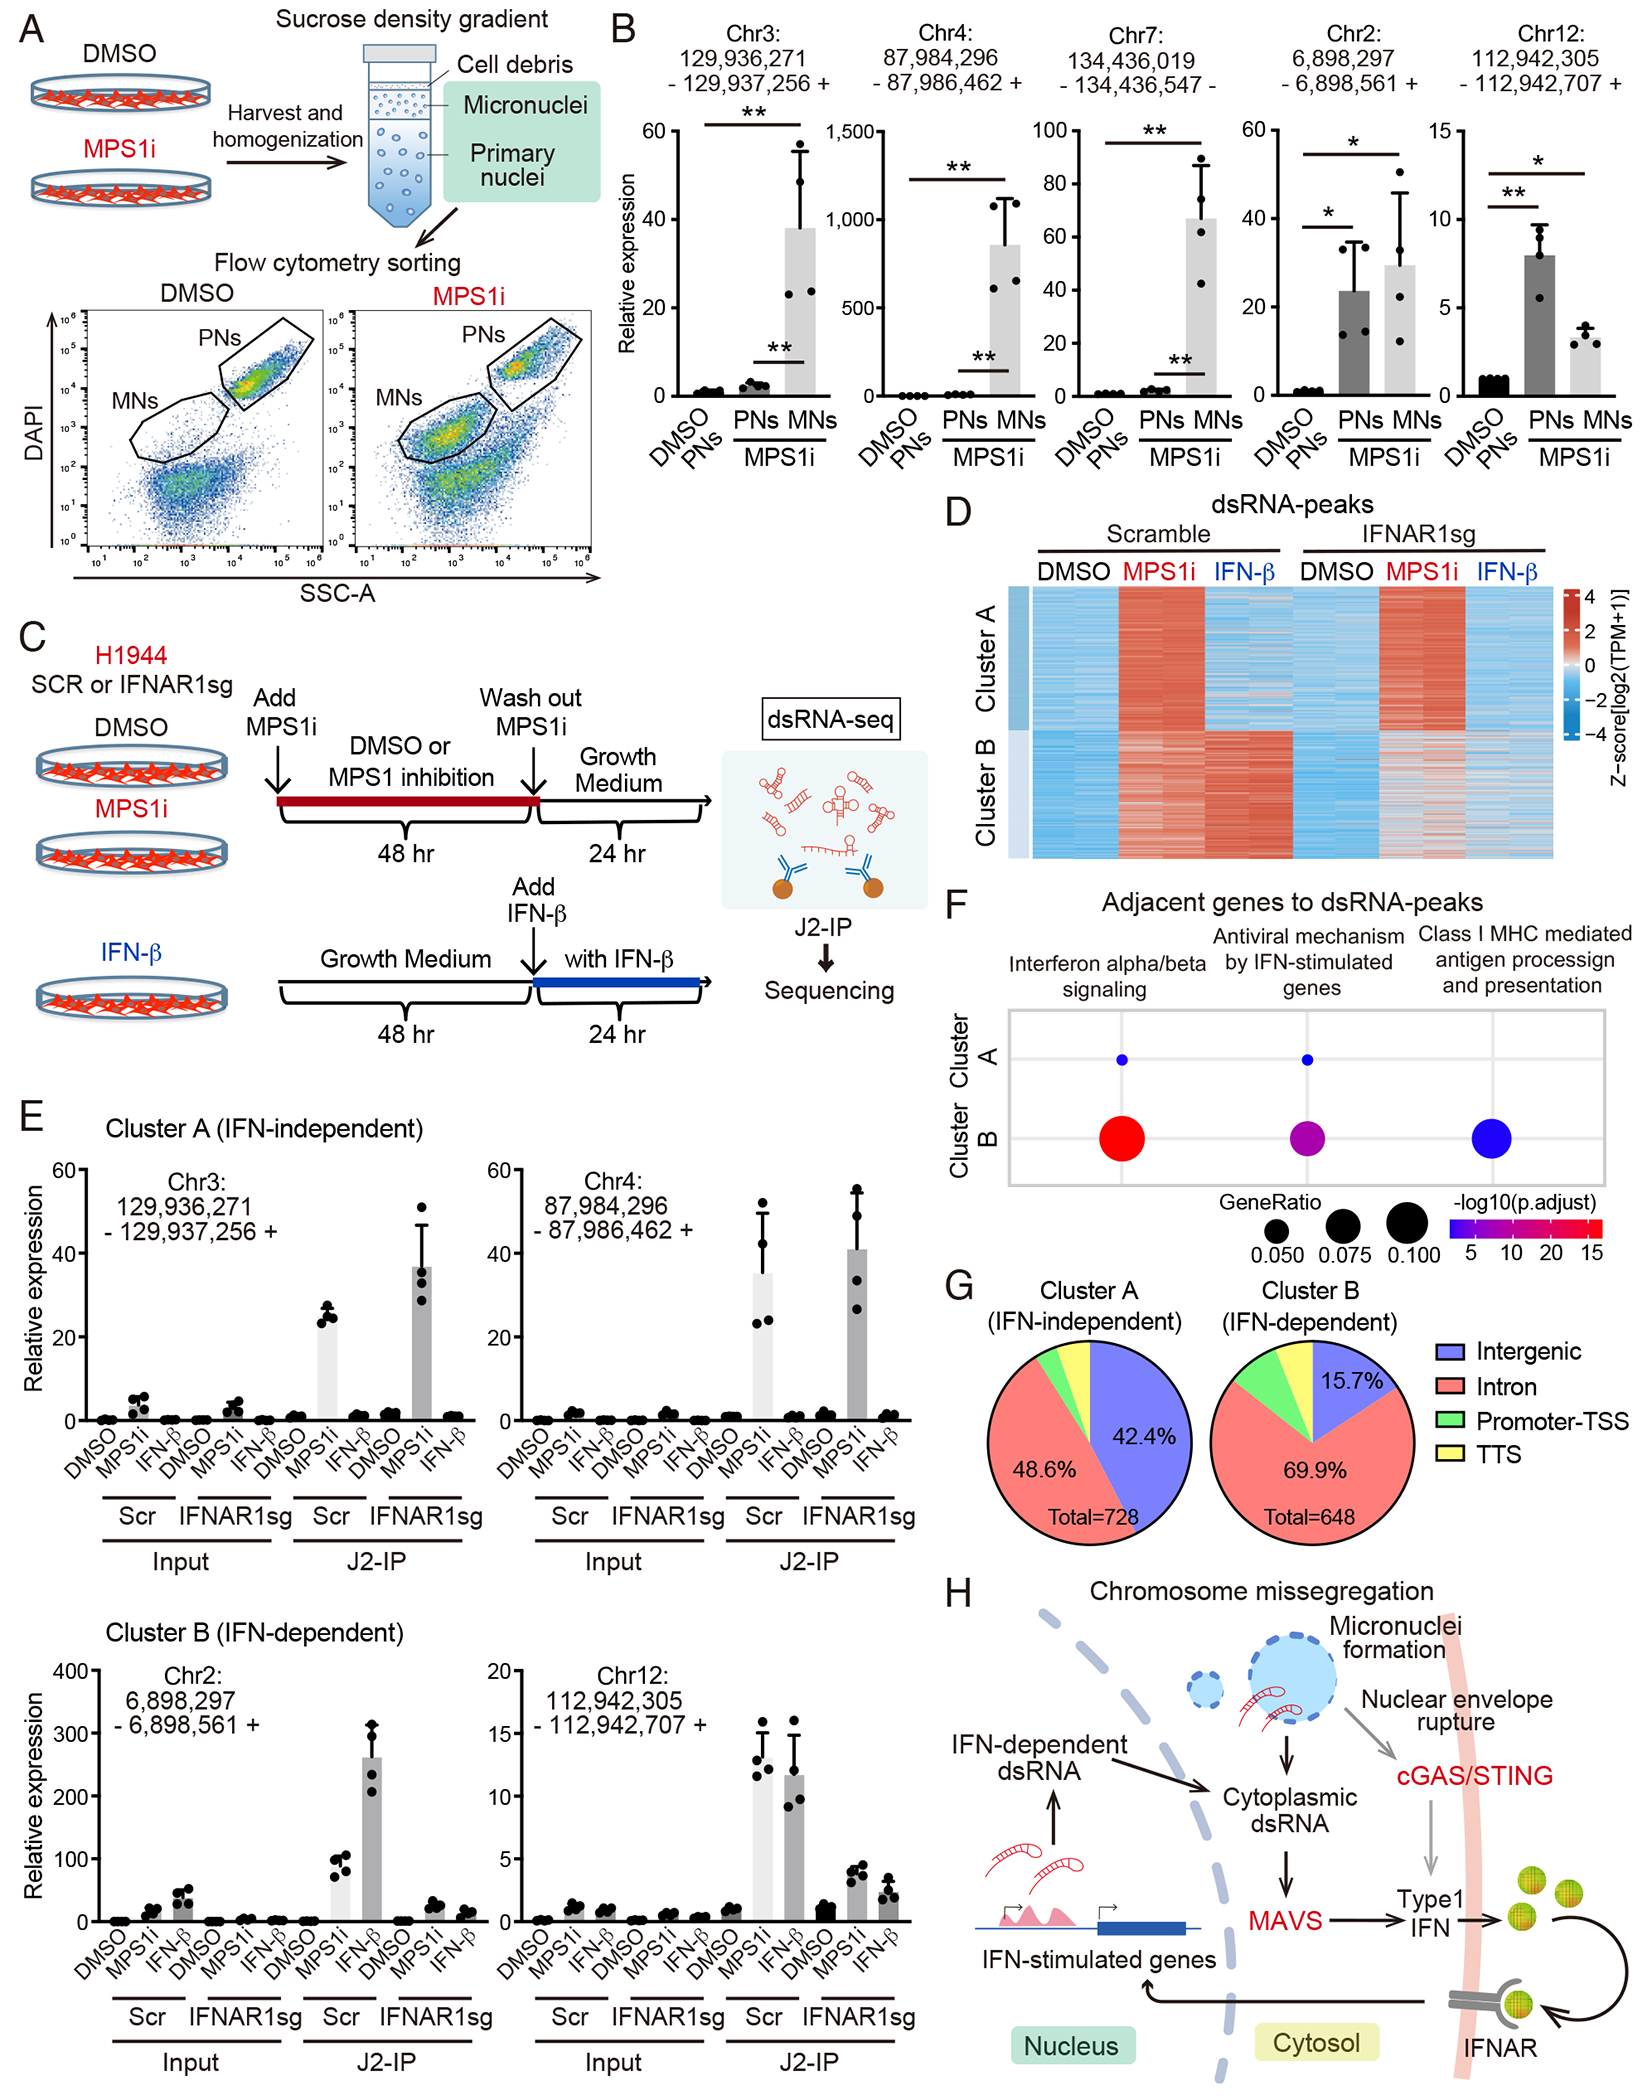
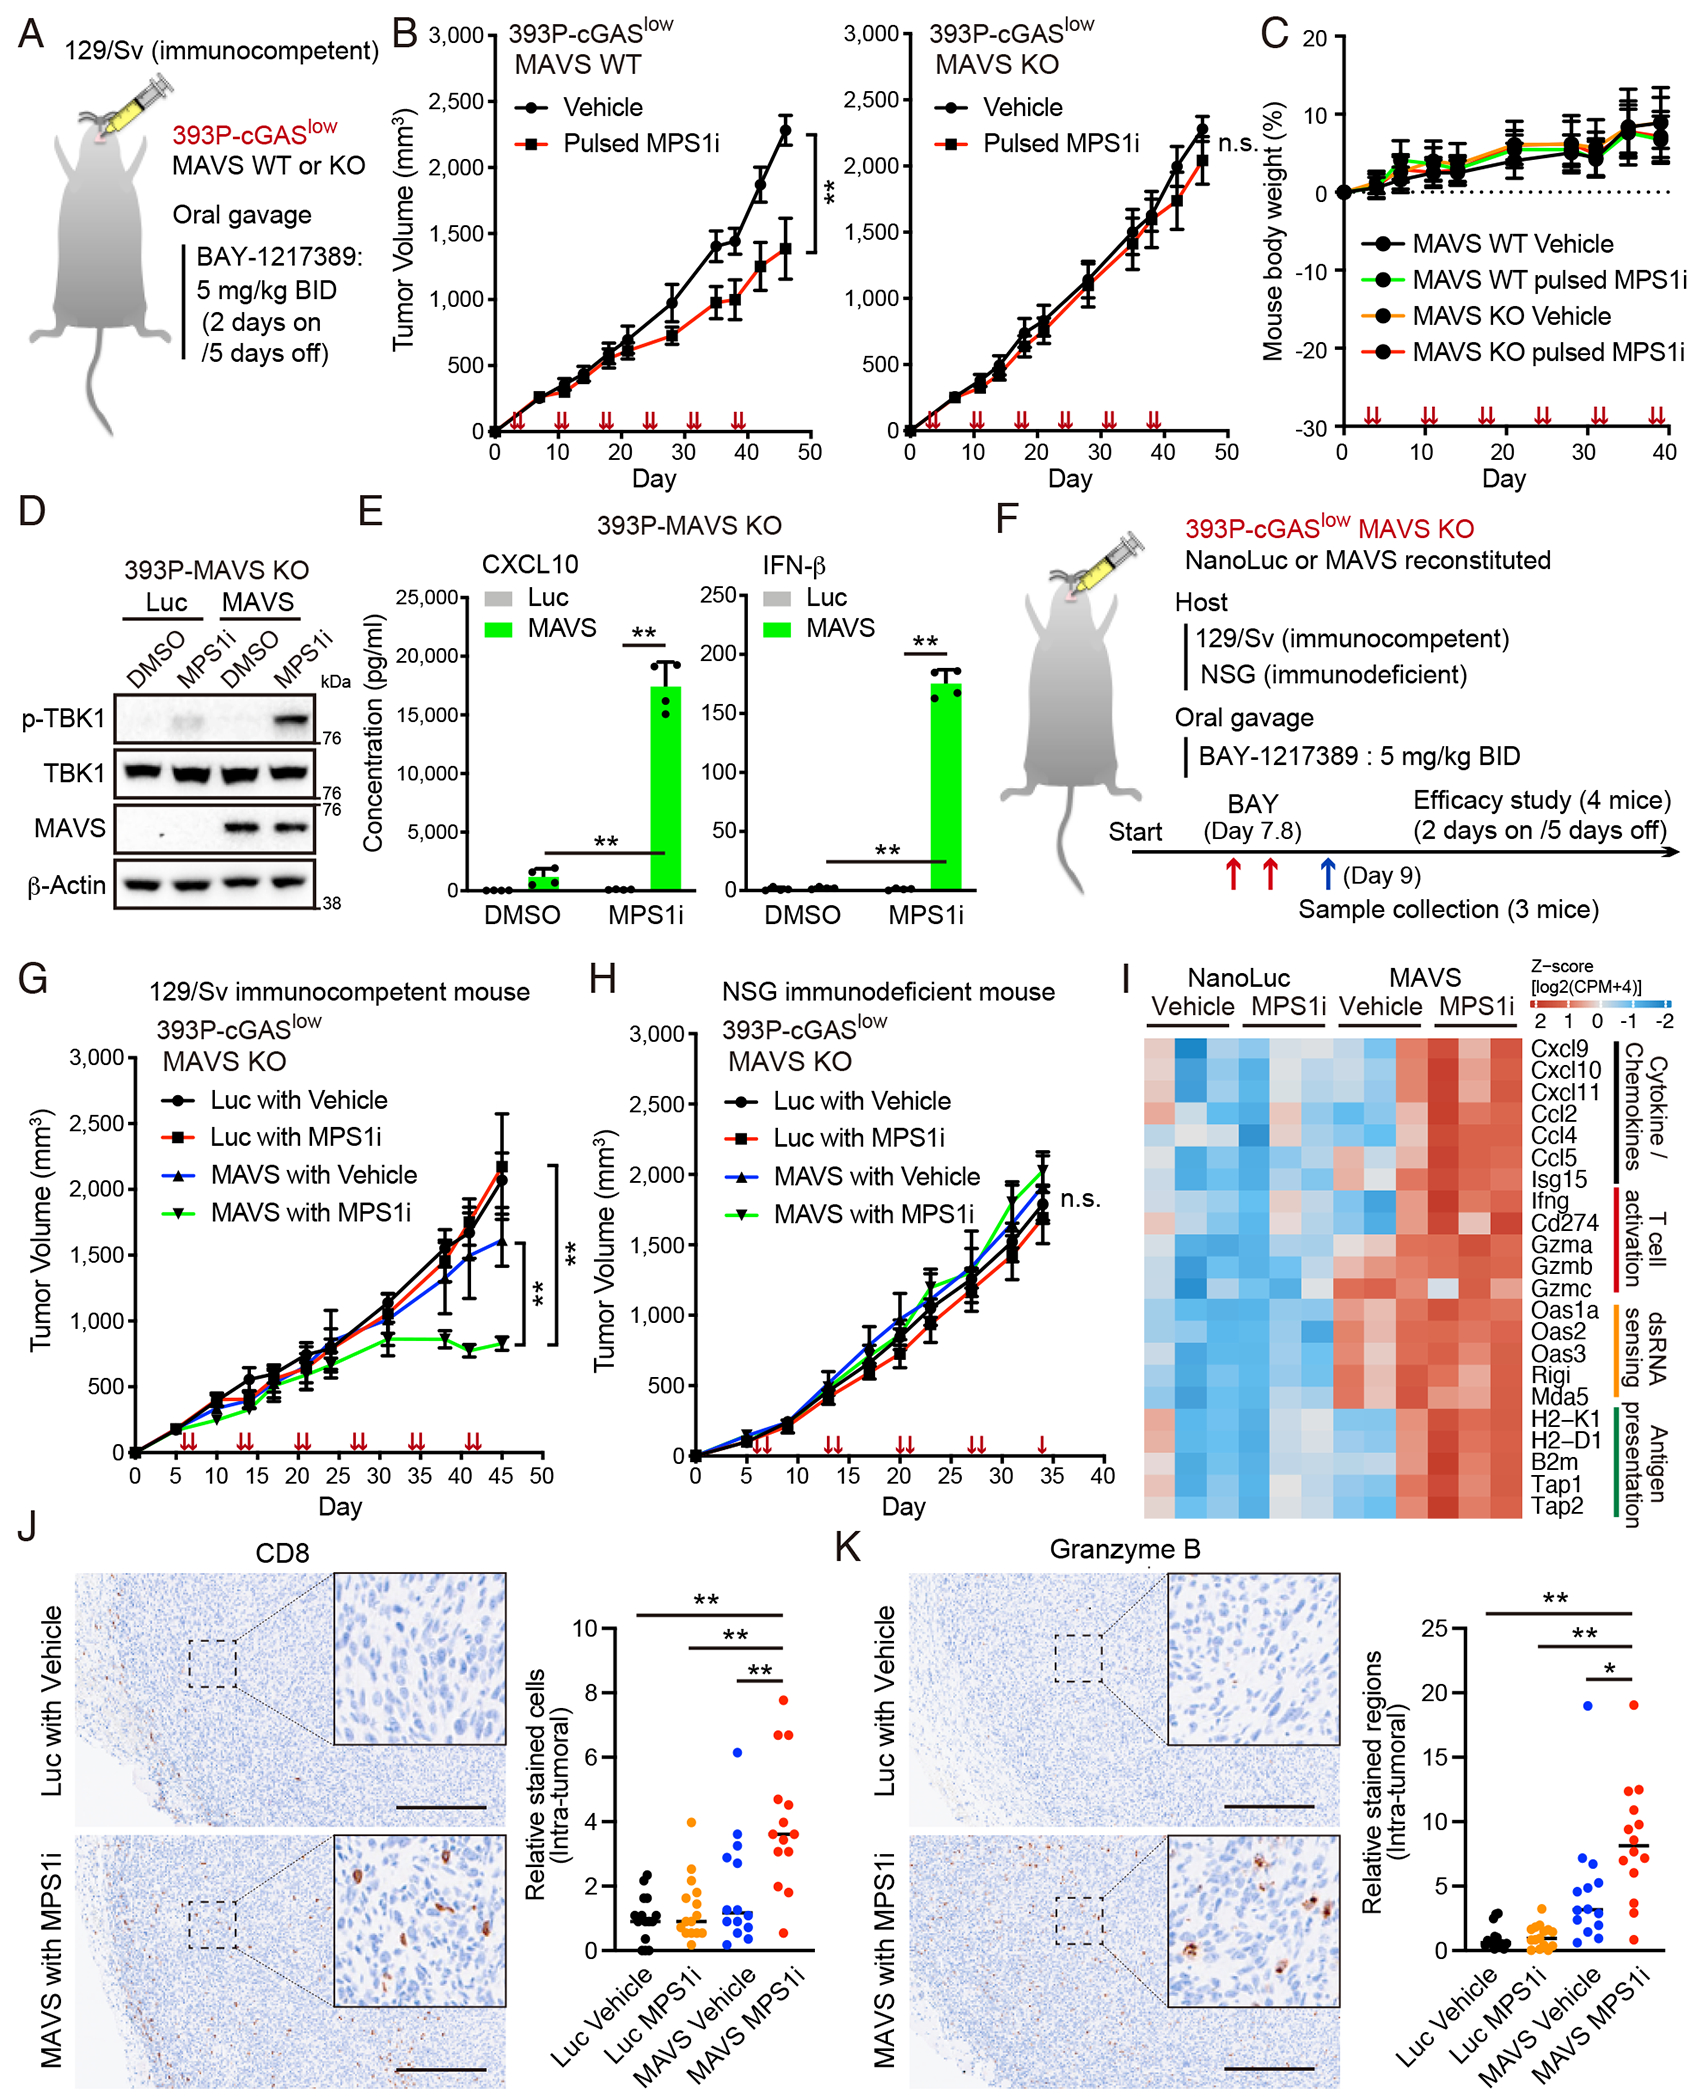
Viral mimicry driven by endogenous double-stranded RNA (dsRNA) stimulates innate and adaptive immune responses. However, the mechanisms that regulate dsRNA-forming transcripts during cancer therapy remain unclear. Here, we demonstrate that dsRNA is significantly accumulated in cancer cells following pharmacologic induction of micronuclei, stimulating mitochondrial antiviral signaling (MAVS)-mediated dsRNA sensing in conjunction with the cyclic GMP-AMP synthase (cGAS)/stimulator of interferon genes (STING) pathway. Activation of cytosolic dsRNA sensing cooperates with double-stranded DNA (dsDNA) sensing to upregulate immune cell migration and antigen-presenting machinery. Tracing of dsRNA-sequences reveals that dsRNA-forming transcripts are predominantly generated from non-exonic regions, particularly in locations proximal to genes exhibiting high chromatin accessibility. Activation of this pathway by pulsed monopolar spindle 1 (MPS1) inhibitor treatment, which potently induces micronuclei formation, upregulates cytoplasmic dsRNA sensing and thus promotes anti-tumor immunity mediated by cytotoxic lymphocyte activation in vivo. Collectively, our findings uncover a mechanism in which dsRNA sensing cooperates with dsDNA sensing to boost immune responses, offering an approach to enhance the efficacy of cancer therapies targeting genomic instability.

Keywords: MAVS; Mps1; STING; cGAS; chromosome missegregation; dsRNA; micronuclei; tumor immunity; type I interferon.


Conflict of interest statement

Declaration of interests S.K. has a sponsored research agreement with Boehringer Ingelheim. D.A.B. is a consultant for N of One/Qiagen and Tango Therapeutics; is a founder and shareholder in Xsphera Biosciences; has received honoraria from Merck, H3 Biomedicine/Esai, EMD Serono, Gilead Sciences, Abbvie, and Madalon Consulting; and has received research grants from BMS, Takeda, Novartis, Gilead, and Lilly.

Figures

Figure 1.
Figure 1.. Cytoplasmic dsRNA is accumulated due to chromosome missegregation.
(A) Schedule of drug treatment for the RNA-seq. MNs, micronuclei. (B) Venn diagram showing the overlap of differentially expressed genes following the treatment with BAY-1217389 (MPS1i) in H1944 and H647 cells. (C) Gene Ontology (GO) analysis of MPS1i-inducing gene signatures. Top-ranked gene signatures in GO biological process (BP) derived from differentially expressed genes are represented. (D) Heatmap of gene expression in the indicated pathway in H1944 and H647 cells treated with DMSO or BAY-1217389. (E, F) Immunoblot (IB) of the indicated proteins in H1944 and H647 cells treated with 100 nM BAY-1217389 or poly (I:C). (G) Immunofluorescence images of dsRNA (red) staining in H1944 cells treated with 10 nM BAY-1217389 (treated w/wo RNase III). Nuclei were counterstained with DAPI. Scale bars, 20 μm. (H) The amount of intracellular dsRNA in H1944 cells treated with 100 nM BAY-1217389 was analyzed by flow cytometry. Representative data from four independent experiments are shown. (I) Relative Mean fluorescence intensity (MFI) of dsRNA in indicated cells was quantified by FlowJo (n = 4). All quantitative data are represented as mean ± S.D. P values were calculated by twoway ANOVA followed by Sidak’s post hoc test (G), or unpaired two-tailed Student’s t-test (I), *p < 0.05, **p < 0.01.
Figure 2.
Figure 2.. The dsRNA-sensing pathway is activated following chromosome missegregation in a MAVS-dependent manner.
(A) Schematic of RNA-seq (upper). H1944 cells were treated with BAY-1217389 according to the schedule shown in Fig. 1a. PCA was performed for each condition and the resulting scores were plotted (lower). (B) K-means clustering was performed on differentially expressed genes in H1944 cells transduced with the indicated vectors, and treated with 100 nM BAY-1217389. (C) Pathway analysis using the GO term on genes in clusters C and D. (D) IB of the indicated proteins in H1944 cells transduced with the indicated vectors, and treated with 10 nM or 100 nM BAY-1217389. (E) ELISA of human CXCL10 or IFN-β levels in CM derived from H1944 cells transduced with the indicated vectors, and treated with 10 nM BAY-1217389. (F) Cell proliferation analysis of H1944 cells transduced with the indicated vectors and treated with 100 nM BAY-1217389 for 48 hr and followed by culture in growth medium using IncuCyte® Live Cell Imaging. Area confluence rate (%) on the y-axis and time (hours) on the x-axis (n = 3). (G) IB of the indicated proteins and (H) qRT-PCR of CXCL10 or IFNB in H1944 cells transduced with the indicated vectors, and treated with 25 nM volasertib or 62.5 nM GSK-923295 (n = 4). All quantitative data are represented as mean ± S.D. P values were calculated by unpaired two-tailed Student’s t-test (F), or two-way ANOVA followed by Sidak’s post hoc test (E, H), **p < 0.01.
Figure 3.
Figure 3.. Deregulation of the dsRNA-sensing pathway enhances innate immune signaling induced by chromosomal missegregation.
(A) IB of the indicated proteins in H1944 cells transduced with the indicated vectors, and treated with 10 nM BAY-1217389. (B) ELISA of human CXCL10 or IFN-β levels in CM derived from H1944 cells transduced with the indicated vectors, and treated with 10 nM BAY-1217389. (C) IB of the indicated proteins in H1944 cells transduced with the indicated vectors, and treated with 10 nM BAY-1217389, or transfected with 0.05 μg poly (I:C). (D) ELISA of human CXCL10 or IFN-β levels in CM derived from H1944 cells transduced with the indicated vectors, and treated with 10 nM BAY-1217389, or transfected with 0.05 μg poly (I:C). (E) qRT-PCR of CXCL10 or IFNB in H1944 cells transduced with the indicated vectors, and treated with 25 nM volasertib or 62.5 nM GSK-923295 (n = 4). All quantitative data are represented as mean ± S.D. P values were calculated by two-way ANOVA followed by Sidak’s post hoc test (B, D, E), **p < 0.01.
Figure 4.
Figure 4.. Activation of the dsRNA-sensing pathway due to chromosome missegregation enhances HLA expression and immune cell chemotaxis.
(A) qRT-PCR of HLA-A, HLA-B, and HLA-C in H1944 cells transduced with the indicated vectors, and treated with 10 nM BAY-1217389 (n = 4). (B) HLA-A.B.C expression on the cell surface in H1944 cells transduced with the indicated vectors, and treated with 10 nM BAY-1217389. Data are representative of three independent experiments (left). MFI was quantified by FlowJo (right). (C) Schedule of drug treatment for migration assay and schematic of NK cell migration assay using a 3D microfluidic device with tumor spheroids embedded in a central collagen-filled channel and with immune cells co-cultured in a side channel. (D) ELISA of human granzyme B in CM derived from NK92 cells co-cultured with H1944 cells (n = 4). (E) Cell proliferation analysis of indicated cells with percentage (%) area measured by IncuCyte® live-cell imaging over 48 hours (n = 3). (F) Representative images of NK-92 cell migration (left). Immune cell infiltration into the peri-tumor region is quantified binarization and segmentation image, computed by ImageJ (n = 12, Four viewpoints for each of the three devices) (right). Scale bars, 500 μm. All quantitative data are represented as mean ± S.D. P values were calculated by one-way ANOVA followed by Dunnet’s post hoc test (D, F), or two-way ANOVA followed by Sidak’s post hoc test (A, B), **p < 0.01.
Figure 5.
Figure 5.. Transcripts derived from non-exonic regions form dsRNA following chromosome missegregation.
(A) Schematics of dsRNA-seq utilizing J2 immunoprecipitation. (B, C) dsRNA-seq signals visualized by integrative genome viewer (IGV) at ACTB and GAPDH loci (B) and dsRNA-forming transcripts in non-exonic regions (C) in H1944 cells treated with 100 nM BAY-1217389. (D) Validation by qRT-PCR for up-regulation of dsRNA-forming transcripts following pulsed MPS1i treatment using input and J2-IP samples. (E, F) Stacked bar charts representing positional information (E) and the repetitive sequence information (F) found in up-regulated peaks of dsRNA-seq in non-exonic regions following pulsed MPS1i treatment. (G) Density plot (left) and pie chart (right) representing the distribution of repetitive sequence positions relative to the transcriptional start site (TSS). All repetitive sequences in RepeatMasker (green) and the repetitive sequences merged with up-regulated dsRNA-peaks following MPS1 inhibition (red) in the density plot. (H) Stacked bar charts representing the number and positional information of differentially accessible regions in H1944 cells treated with 100 nM BAY-1217389. (I) Ratio of the dsRNA-forming transcripts merged with open chromatin regions characterized by ATAC-seq. The whole genome information (GRCh38) was used for the normalization. OCRs: open chromatin regions. All quantitative data are represented as mean ± S.D. P values were calculated by one-way ANOVA followed by Dunnet’s post hoc test (D), **p < 0.01.
Figure 6.
Figure 6.. Autocrine IFN signaling forms a feedforward loop that amplifies endogenous dsRNA production upon micronuclei formation.
(A) Schematics of Micronuclei (MNs) and Primary nuclei (PNs) purification utilizing sucrose density gradient centrifugation followed by flow cytometry sorting. (B) Validation by qRT-PCR for up-regulation of dsRNA-forming transcripts in sorted MNs or PNs following pulsed MPS1i treatment. (C) Schedule of drug treatments for H1944 cells with or without IFNAR1 depletion for dsRNA-seq. (D) K-means clustering was performed on dsRNA-peaks of H1944 cells transduced with the indicated vectors, and treated with 10 nM BAY-1217389 or 5 ng/ml IFN-β. Upregulated dsRNA-peaks (FC > 2, p.adjust < 0.05) in H1944 Scramble cells treated with MPS1i are shown. (E) dsRNA-forming transcripts after pulsed MPS1i or IFN-β treatment, classified as cluster A (IFN-independent, above) and cluster B (IFN-dependent, lower), were validated by qRT-PCR. (F) GO analysis of genes adjacent to dsRNA-peaks in Cluster A and B for IFN-stimulated gene signatures in Reactome. (G) Pie chart representing positional information of dsRNA-peaks in Cluster A and B. (H) Schematic diagram of the mechanisms of dsRNA production through cell intrinsic machineries and autocrine IFN signaling after chromosomal missegregation. All quantitative data are represented as mean ± S.D. P values were calculated by one-way ANOVA followed by Dunnet’s post hoc test (B), *p < 0.05, **p < 0.01.
Figure 7.
Figure 7.. Activation of the dsRNA-sensing pathway following pulsed MPS1 inhibition drives anti-tumor immunity.
(A) Schematic of efficacy study with MPS1 inhibitor in syngeneic murine lung cancer model. (B, C) Mean tumor volume of MAVS WT or KO 393P-cGASlow cells (B) and mouse body weight (C) after subcutaneous inoculation into syngeneic 129S2/SvPasCrl mice treated with BAY-1217389 following the schedule shown in Fig. 7A (n = 8). Red arrows, BAY-1217389 treatment. n.s., not significant. (D) IB of the indicated proteins in MAVS KO 393P cells introduced with Luc or MAVS, and treated with 10 nM BAY-1217389. (E) ELISA of mouse Cxcl10 or Ifn-β levels in CM derived from MAVS KO 393P cells introduced with Luc or MAVS, and treated with 10 nM BAY-1217389. (F) Schematic of efficacy study with MPS1 inhibitor against MAVS KO 393P cells introduced with Luc or MAVS in 129S2/SvPasCrl (immunocompetent) and NSG (immunodeficient) mice. (G, H) Mean tumor volume of MAVS KO 393P-cGASlow cells introduced with Luc or MAVS after subcutaneous inoculation into syngeneic 129S2/SvPasCrl mice (G) or NSG mice (H) treated with BAY-1217389 following the schedule shown in Figure 7F (n = 8). Red arrows, BAY-1217389 treatment. n.s., not significant. (I) Heatmap of gene expression in the indicated pathway in tumor tissues inoculated into 129S2/SvPasCrl mice treated with vehicle or BAY-1217389. (J, K) Representative CD8 (J) and Granzyme B (K) images of immunohistochemistry (IHC) (left) and quantification (right) of tumors derived from MAVS KO 393P-cGASlow cells introduced with Luc or MAVS treated with BAY-1217389. Inset highlights positive cells. Scale bar, 250 μM. All quantitative data are represented as mean ± S.D (C, E) or S.E (B, G, H). P values were calculated by one-way ANOVA followed by Dunnet’s post hoc test (J, K), or two-way ANOVA followed by Sidak’s post hoc test (B, E, G, H), *p < 0.05, **p < 0.01.

References

    1. He X, Sun Y, Lu J, Naz F, Ma S, and Liu J (2023). Cytoplasmic DNAs: Sources, sensing, and roles in the development of lung inflammatory diseases and cancer. Front Immunol 14, 1117760. 10.3389/fimmu.2023.1117760. - DOI - PMC - PubMed
    1. Guey B, and Ablasser A (2022). Emerging dimensions of cellular cGAS-STING signaling. Curr Opin Immunol 74, 164–171. 10.1016/j.coi.2022.01.004. - DOI - PubMed
    1. Hopfner KP, and Hornung V (2020). Molecular mechanisms and cellular functions of cGAS-STING signalling. Nat Rev Mol Cell Biol 21, 501–521. 10.1038/s41580-020-0244-x. - DOI - PubMed
    1. Chen C, and Xu P (2023). Cellular functions of cGAS-STING signaling. Trends Cell Biol 33, 630–648. 10.1016/j.tcb.2022.11.001. - DOI - PubMed
    1. Konno H, Yamauchi S, Berglund A, Putney RM, Mule JJ, and Barber GN (2018). Suppression of STING signaling through epigenetic silencing and missense mutation impedes DNA damage mediated cytokine production. Oncogene 37, 2037–2051. 10.1038/s41388-017-0120-0. - DOI - PMC - PubMed

MeSH terms