. 2025 Feb 6;188(3):778-795.e18.
doi: 10.1016/j.cell.2024.11.017. Epub 2024 Dec 19.

Synthetic organizer cells guide development via spatial and biochemical instructions

Affiliations

Synthetic organizer cells guide development via spatial and biochemical instructions

Toshimichi Yamada et al. Cell. .

Abstract

In vitro development relies primarily on treating progenitor cells with media-borne morphogens and thus lacks native-like spatial information. Here, we engineer morphogen-secreting organizer cells programmed to self-assemble, via cell adhesion, around mouse embryonic stem (ES) cells in defined architectures. By inducing the morphogen WNT3A and its antagonist DKK1 from organizer cells, we generated diverse morphogen gradients, varying in range and steepness. These gradients were strongly correlated with morphogenetic outcomes: the range of minimum-maximum WNT activity determined the resulting range of anterior-to-posterior (A-P) axis cell lineages. Strikingly, shallow WNT activity gradients, despite showing truncated A-P lineages, yielded higher-resolution tissue morphologies, such as a beating, chambered cardiac-like structure associated with an endothelial network. Thus, synthetic organizer cells, which integrate spatial, temporal, and biochemical information, provide a powerful way to systematically and flexibly direct the development of ES or other progenitor cells in different directions within the morphogenetic landscape.

Keywords: developmental biology; differential adhesion; gastruloid; morphogen gradient; regenerative medicine; signaling center; synCAMs; synthetic biology; synthetic cell adhesion molecules; synthetic embryos; synthetic organizer.


Conflict of interest statement

Declaration of interests B.G.B. is a founder and shareholder of Tenaya Therapeutics. W.A.L. is a shareholder of Gilead Sciences, Intellia Therapeutics, Allogene Therapeutics, and SciFi Foods. W.A.L. has been an advisor to Cell Design Labs, Kite Therapeutics, Allogene Therapeutics, and SciFi Foods; is on the Board of the Burroughs Wellcome Fund; and is on the Editorial Board of Cell. T.Y., C.T., J.M.B., A.J.S., O.D.K., and W.A.L. have applied for patents related to this work.

Figures

Figure 1.
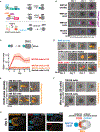
Figure 1.. Programming synthetic organizer architectures to spatially guide development
(A) Concept of self-assembling synthetic organizer cells to guide in vitro development. Endogenous development (left) takes place within complex microenvironments with spatially precise morphogen signals to drive robust and complex development. By contrast, most in vitro protocols (center) rely on systemic morphogen stimulation that lacks spatial information. Here, we create synthetic organizer cells (red/blue) programmed to self-assemble around the progenitor cells (gray), providing spatially directed morphogen signals to drive more reliable and complex morphogenesis. (B) Cell adhesion engineering toolbox to build synthetic organizer architectures of L929 fibroblasts (red/blue) around mESCs (gray). mESCs express surface nfGFP ligand. L929 cells expressing anti-GFP synCAM with integrin β2 (ITGB2) intracellular domain (blue) form a shell, while L929 cells expressing PCAD and anti-GFP synCAM with ICAM intracellular domain form a node anchored to the mESCs embryoid. (C) Combinatorial synthetic organizer architectures built from shell and node organizer cells. (D) Bright-field images exemplifying synthetic organizer architectures (blue or red L929 cells) around a mESC embryoid. Scale bar: 200 μm. (E) Live imaging of organizer self-assembly. Node cells (blue) self-organize with mESCs (red) in ~12 h (middle, Video S1). Preformed organizer node leads to more rapid and reliable assembly (right, Video S1). Shell self-assembly kinetics (left, Video S1). Scale bar: 200 μm. See Figure S1 for a more complete analysis of self-assembly properties of L929 organizer cells expressing a broader range of synCAMs.
Figure 2.
Figure 2.. Local node organizers generate morphogen gradients and symmetry breaking
(A) Genetic circuits that enable temporal and amplitude control of morphogen induction from synthetic organizer cells. WNT3A is induced by doxycycline (DOX), DKK1 by grazoprevir (GRZ), and iCasp9-based suicide switch by AP20187. The bottom shows the timeline of organizer-induced morphogen production used in this study. (B) Time-lapse images of representative pTCF-mCherry signal (magenta; WNT activity reporter) in each condition. Initial seeding: 300 mESCs, 30 organizer cells for WNT3A shell or node (or 30 cells for neutral node making no morphogen). On day 1, WNT3A is induced with 200 ng/mL DOX. For WNT3A in media, 160 ng/mL was used. Scale bar: 200 μm. (C) Quantification of embryoid elongation over time for each condition. Shaded area shows SD from multiple experiments. Scale bar: 200 μm. (D) Representative time-lapse images of Brachyury-mCherry reporter (orange) in each condition. Scale bar: 200 μm. Initial seeding: 200 SBR ESCs, 30 organizer cells for WNT3A node and DKK1 node. WNT3A (continuous) is induced on day 1 by adding 200 ng/mL DOX. Gastruloid generation involves a 3 μM CHIR pulse between days 2 and 3. For DKK1 node with CHIR pulse, DKK1 (continuous) is induced on day 1 by adding 1 μM GRZ, with 3 μM CHIR pulse between days 2 and 3. (E) Representative images of Brachyury reporter (orange) on day 5, 2 days after the 3 μM CHIR pulse. White arrows indicate Brachyury+ poles. Seeding: 100 (top) or 300 SBR mESCs (bottom). Scale bar: 200 μm. (F) Representative images of Brachyury reporter (orange) on day 3, 2 days after induction of WNT3A from the organizer node. Starting conditions: 30 organizer cells with 100 (top) or 300 (bottom) SBR mESCs. Scale bar: 200 μm. (G) Confocal sections of WNT3A node embryoid on day 4 (initial seeding: 300 WT mESCs, 30 WNT3A node, with 200 ng/mL DOX after day 1). Staining shows distribution of BRACHYURY (orange), CDX2 (red), and FOXA2 (cyan) (nuclei: gray). Scale bar: 50 mm. Each image is representative of ~10 replicates. Right illustration shows primitive streak-like structure formation in WNT3A node-induced embryoid, including distinct anterior and posterior regions. See Figure S2 for detailed characterization of WNT3A node properties. Figure S3 includes replicates of (C)–(E).
Figure 3.
Figure 3.. Combinations of opposing synthetic organizers (WNT3A vs. DKK1) reshape morphogen gradients, yielding different ranges of anterior-posterior cell lineages
(A) Comparison of pTCF-mCherry WNT activity reporter in mESC embryoids induced by different WNT3A sources, including WNT3A in media, WNT3A shell, WNT3A node, and their combinations. In each condition, WNT3A and/or DKK1 are induced starting on day 1 by adding 200 ng/mL DOX for WNT3A or 1 μM GRZ for DKK1, respectively. Representative images and intensity profiles of pTCF-mCherry fluorescence on day 4 are shown. The bold line represents the mean of individual profiles (n = 10–13 per condition). Scale bar: 100 μm. Note that DKK1 node-induced embryoid shows considerably less growth, resulting in smaller length. (B) Anterior-posterior axis formation in embryoids induced by WNT3A node, WNT3A/DKK1 dual nodes, and DKK1 node (initial seeding: 300 mESCs, 30 node cells for each node.). Top: a schematic of WNT activity gradient for each condition is shown in purple (based on A). Middle: confocal sections of BRACHYURY and SOX2 staining distributions for each condition on day 4. Bottom: cTnT (cardiac marker) and OTX2 (neural marker) staining distribution for day 8 embryoids (see Video S2 for live imaging of beating). Inset for DKK1 node-induced embryoid shows zoomed view of OTX2-postive cells adjacent to DKK1 node. Scale bar: 200 μm (inset: 50 μm). (C) Quantification of relative position of beating cardiac domain along the long axis of WNT3A node or dual-node-induced embryoids. p value: 4.81 × 10⁻⁶ (n = 11), unpaired t test. See Figure S4 for optimizing conditions using reporter lines.
Figure 4.
Figure 4.. Cell-type diversity in synthetic organizer-induced embryoids
(A) UMAP graph representing cell clusters identified in scRNA-seq of WNT3A node embryoid (35,974 sequenced cells), WNT3A/DKK1 dual nodes embryoid (9,902 sequenced cells), and DKK1 node embryoid (4,464 sequenced cells) on day 8. See Table S1 for key maker genes used to annotate cell identity in each cluster. (B) An alluvium plot comparing cell lineage diversity across conditions. The Wnt and dual-node embryoid datasets were down-sampled to match the number of cells in the DKK1 node embryoid dataset. WNT3A node embryoid contains mostly mesodermal lineages, whereas DKK1 node embryoid mostly has ectodermal cells. Only dual nodes embryoid has matured linages from both mesodermal and ectodermal cells. See also Figures S5A and S5B for the distribution of three germline lineages.
Figure 5.
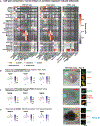
Figure 5.. Cell-type comparison between mouse embryo and synthetic organizer-induced embryoids and spatial characterization of key lineages
(A) Similarity heatmap between expression profiles of cell lineages in synthetic organizer-induced embryoids and mouse embryo (E6.5–E8.0). Plot is organized by germline lineages (color-coded on left axis); endo, endoderm; meso, mesoderm; ecto, ectoderm; NED, neuroectoderm; NT, neural tube; NMPs, neuromesodermal progenitors; prec., precursors; and prog., progenitors. (B) Feature plots (left) and immunostaining (right) of hematopoietic markers. RUNX1/2/3 (green) and GATA1 (red) expressing cells show a localized cluster within WNT3A node-induced embryoid on day 8, analogous to early blood island. Node is shown in cyan. Scale bar: 200 μm (inset: 20 μm). (C) Feature plots (left) and immunostaining (right) of primordial germ cell (PGC) markers. Nanog (green) and BLIMP1 (red) expressing cells form a localized cluster within WNT3A node-induced embryoid on day 8. Scale bar: 200 μm (inset: 20 μm). (D) Feature plots (left) and immunostaining (right) of myocardial markers. NKX2.5 (green) and cTnT (red) within WNT3A node-induced embryoid shows localized expression only around the heart-like chamber. Scale bar: 200 μm (inset: 50 μm). See Video S3 for 3D reconstructed image.
Figure 6.
Figure 6.. Shallow gradient from single WNT3A node yields development of beating and chambered cardiac structure
(A) WNT3A node generates a much shallower gradient (dark) compared with WNT3A/DKK1 dual node (light), potentially providing higher-resolution positional information. (B) Time-lapse imaging of Kdr-EGFP mESC reporter line treated with WNT3A node (top) or WNT3A in media (bottom), from days 4 to 8. Both conditions are seeded with 300 mESCs. The WNT3A node is seeded with 30 cells and induced with 200 ng/mL DOX on day 1. For the WNT3A in media condition, 160 ng/mL of mouse WNT3A is added to the media on day 1. Scale bar: 200 μm. (C) Kdr-EGFP distribution on day 8 in WNT3A node-induced embryoid. Kdr-positive cells are localized on the opposite side of the WNT3A node and form vascular-like network and a beating chamber. See Video S4 for live imaging. (D) Pie chart depicting distribution of beating phenotypes. About 73% of WNT3A node-induced embryoids showed localized beating regions, and 12% showed clear beating chamber structure. (E) Distribution of actin (stained with phalloidin-Alexa 488) and nucleus (stained with DRAQ5) showed heart-like chamber is fully enclosed and has no internal cellular structures. See Video S5 for 3D reconstructed image. Scale bar: 200 μm. (F) Calcium imaging of a beating domain on day 8 using a Fluo-4 AM calcium dye. See Video S6 for live imaging. (G) An intensity profile of Fluo-4 AM dye shows regular oscillation of calcium concentration in the beating domain. (H) Feature plots (left) and immunostaining (right) of cardiac and vascular endothelial markers. Cardiomyocytes (cTnT-positive cells, orange) are localized around the chamber. The vascular network (PECAM1-positive cells, green) extends out from the base of the cardiac chamber into the rest of the embryoid. Scale bar: 200 μm (inset: 20 μm). See also Figure S6 for reproducibility and further analysis on cardiac beating phenotypes.
Figure 7.
Figure 7.. Synthetic organizers provide platform to flexibly direct and tune in vitro development
(A) Lineage-specific differentiation: ESCs are differentiated into specific lineages using defined differentiation protocol. This method generates a uniform population of a specific cell lineage and does not involve self-organization. (B) Synthetic embryos (e.g., iETX embryos and gastruloids): these approaches are aimed at generating a broad spectrum of lineages that self-organize in a manner that mimics natural embryogenesis. (C) Synthetic organizers: this approach provides tunable and directed control over the range of lineages and further cell, including associated lineages that can self-organize into more complex multi-cell-type structures. Synthetic organizers may offer enhanced flexibility and control in in vitro developmental processes.

References

    1. Shahbazi MN, Siggia ED, and Zernicka-Goetz M (2019). Self-organization of stem cells into embryos: A window on early mammalian development. Science 364, 948–951. 10.1126/science.aax0164. - DOI - PMC - PubMed
    1. Trentesaux C, Yamada T, Klein OD, and Lim WA (2023). Harnessing synthetic biology to engineer organoids and tissues. Cell Stem Cell 30, 10–19. 10.1016/j.stem.2022.12.013. - DOI - PMC - PubMed
    1. Spemann H, and Mangold H (1924). über Induktion von Embryonalanlagen durch Implantation artfremder Organisatoren. Arch. Für Mikrosk. Anat. Entwicklungsmechanik 100, 599–638. 10.1007/BF02108133. - DOI
    1. Fuchs E, Tumbar T, and Guasch G (2004). Socializing with the Neighbors: Stem Cells and Their Niche. Cell 116, 769–778. 10.1016/S0092-8674(04)00255-7. - DOI - PubMed
    1. Briscoe J, and Small S (2015). Morphogen rules: design principles of gradient-mediated embryo patterning. Development 142, 3996–4009. 10.1242/dev.129452. - DOI - PMC - PubMed

Substances

LinkOut - more resources