. 2025 Jan 23;188(2):515-529.e15.
doi: 10.1016/j.cell.2024.11.012. Epub 2024 Dec 19.

Digital phenotyping from wearables using AI characterizes psychiatric disorders and identifies genetic associations

Affiliations

Digital phenotyping from wearables using AI characterizes psychiatric disorders and identifies genetic associations

Jason J Liu et al. Cell. .

Abstract

Psychiatric disorders are influenced by genetic and environmental factors. However, their study is hindered by limitations on precisely characterizing human behavior. New technologies such as wearable sensors show promise in surmounting these limitations in that they measure heterogeneous behavior in a quantitative and unbiased fashion. Here, we analyze wearable and genetic data from the Adolescent Brain Cognitive Development (ABCD) study. Leveraging >250 wearable-derived features as digital phenotypes, we show that an interpretable AI framework can objectively classify adolescents with psychiatric disorders more accurately than previously possible. To relate digital phenotypes to the underlying genetics, we show how they can be employed in univariate and multivariate genome-wide association studies (GWASs). Doing so, we identify 16 significant genetic loci and 37 psychiatric-associated genes, including ELFN1 and ADORA3, demonstrating that continuous, wearable-derived features give greater detection power than traditional case-control GWASs. Overall, we show how wearable technology can help uncover new linkages between behavior and genetics.

Keywords: AI; GWAS; brain; deep learning; digital phenotyping; genetics; genomics; personal health; psychiatry; wearable biosensors.


Conflict of interest statement

Declaration of interests The authors declare no competing interests.

Figures

Figure 1.
Figure 1.. Leveraging clinical, digital, and genetic data of the ABCD cohort to improve characterization of psychiatric disorders.
A) Framework schematic describing how digital phenotypes from wearable-derived data are leveraged to better understand the association between macrophenotype and genotype. The link between digital phenotype and macrophenotype serves as construct validity and aid in diagnostics. Wearable GWAS is performed through genotype-to-digital-phenotype association studies. B) The Adolescent Brain Cognitive Development (ABCD) cohort contains 11,878 individuals spanning nine different categorical macrophenotypes based on clinical diagnosis from the Kiddie Schedule for Affective Disorders and Schizophrenia-5. A breakdown of the counts of each disorder is shown in the bottom bar graph, with anxiety disorder and ADHD being the most prevalent. “Bipolar” refers to bipolar or psychotic disorders. (Details in Table S1.) C) Digital data from FitBit biosensors are collected for 5,339 individuals. The collected time series data are then processed into dynamic and static features, with information spanning various physiological and higher-order processes. D) Genetic data are collected by the ABCD consortium through Smokescreen genotyping array. Imputed genotypes are used for downstream GWAS analyses. The genotype arrays are subjected to best-practice processing and QC to ensure included individuals and SNPs are of high quality. PCA performed on 8,791 individuals and 157,556 genotyped SNPs reveals distinct ancestral clusters across the cohort and the inferred genotype principal components (PCs) are used as covariates in downstream analyses. (Details in Data S31-S34.) See also Figure S1.
Figure 2.
Figure 2.. Workflow for data processing, feature engineering, and model architecture.
A) ABCD cohort metadata including various demographic features, cognitive test scores, and clinical characteristics are used as covariates and represent the input features used in our baseline comparison model. Features shown in this plot correspond to the filtered set of individuals with wearable data. (Details in Data S1-S5.) B) Digital data collected by wearable biosensors are used to generate dynamic features after signal processing and imputation steps. Together with the processed covariates, these time series features represent the input features for the dynamic model. (Details in Data S10-S11 and Data S14.) C) Summary statistics applied to digital data collected by wearables are used to generate a total of 258 static features. In addition to the covariates, these are the input features used in the static model. The static model leverages the machine learning framework, XGBoost, for downstream tasks such as wearable combination score generation and classification. (Details in Data S9 and Table S2.) D) Hierarchical clustering of the static features yields seven distinct physiological clusters of wearable data. (Details in Data S12-S13.) E) The dynamic model is based on the Xception deep learning framework, and uses the generated 48 channels from the dynamic features and covariates as input into a convolution-like model. The architecture consists of six inception layers and residual connections. Global average pooling and a fully connected layer allow for similar downstream tasks as mentioned in C). See also Figure S2.
Figure 3.
Figure 3.. Performance and interpretability of psychiatric phenotype classification models.
A-B) Model performance for baseline, static, and dynamic models employed for classifying individuals with ADHD (blue, top) or individuals with anxiety disorder (purple, bottom) versus healthy controls. P values were calculated using one-sided t-test. (Details in Data S20-S23.) C-D) Feature importance based on ablation studies for the dynamic model for ADHD (blue, top) and anxiety disorder (purple, bottom) classification. Wearable-derived dynamic features are shown in red font and clinical features (covariates) are shown in black font. Feature importance is equivalent to the decrease in model performance (AUROC) after removal of the given feature. (Details in Data S24-S28.) E-F) Temporal importance during a 48-hour period for dynamic features in ADHD (blue, top) or anxiety disorder (purple, bottom) classification based on the GRAD-CAM interpretability module. Importance is represented as the GRAD-CAM score, based on each time point’s contribution towards model performance. (Details in Data S29-S30.) See also Figure S3.
Figure 4.
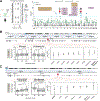
Figure 4.. Manhattan plots summarizing the results of multivariate and univariate GWAS for ADHD.
A) Left panel: Schematic describing for a given SNP the frequency of healthy controls or individuals with ADHD for each genotype. Right panel: Resulting Manhattan plot from a case-control GWAS on 1,191 individuals from the ABCD cohort. We employed the clinical diagnosis label as the binary univariate response variable for the GWAS (nADHD = 137, nControl = 1,054). No genetic variants passed the genome-wide significance threshold (p value < 5·10−8; blue line). Genetic variants with a suggestive p value (< 10−5) are represented as green dots. In all panels, proximal genes related to ADHD are highlighted in dark blue, and genes related to other psychiatric disorders are highlighted in pink (evidence obtained from OpenTargets). Brain-related traits associated with genetic variants overlapping the genome-wide significant loci are highlighted in orange. GWAS associations were obtained from the EBI-NHGRI GWAS catalog. A detailed list of genome-wide significant loci for all panels is provided in Table 1, Table S3 and Table S4. In this figure, we only show results related to autosomal chromosomes. (Details in Data S50-S52.) B) Left panel: Schematic describing for a given SNP, the relationship between a multivariate set of n wearable-derived features (dependent/response variable) and an interaction term represented by the genotype and the disorder status of the individuals (independent/predictor variable). Right: Resulting Manhattan plot using clusters of wearable-derived features as the multivariate response variable in a GWAS that encodes the interaction term genotype:disorder (where disorder is a binary feature such as 0 = Control, 1 = ADHD; gxm). The GWAS was performed on the same set of 1,191 individuals as in panel A. We identified 2 and 174 loci passing the p value thresholds of 5·10−8 and 1·10−5, respectively. Locus chr6:53,240,429–53,356,412 is proximal to genes CILK1, ELOVL5, FBXO9 (highlighted in dark blue), which have been associated with ADHD previously. The inset panel shows that individuals with ADHD exhibit different levels of residualized (i.e., covariate-adjusted) sedentary time (maximum) depending on the genotype at lead variant rs186003 (chr6:53,320,326). In contrast, healthy control individuals show no difference among genotype groups (***: p < 0.001, **: 0.001 ≤ p < 0.01, *: 0.01 ≤ p < 0.05, ns: p ≥ 0.05; two-sided Wilcoxon Rank-Sum test) (Details in Data S38-S39 and Table S2). C) Left: Schematic showing the relationship between the wearable combination score (dependent/response variable) and genotype (independent/predictor variable). Right: Resulting Manhattan plot using the wearable combination scores (trained on classification of individuals with ADHD) as the response variable in a GWAS for ADHD. The GWAS was performed on the same set of 1,191 individuals as in panel A. We identified 10 and 414 loci passing the p value thresholds of 5·10−8 and 1·10−5, respectively. Loci chr1:111,372,165–111,482,359, chr17:7,101,607–7,101,608, and chr17:32,256,997–32,283,356 are proximal to genes ADORA3 (72 Kb), DLG4 (86 Kb) and PSMD11 (174 Kb) (highlighted in dark blue) respectively, which have been previously associated with ADHD. See also Figure S4.
Figure 5.
Figure 5.. Exploring the genetic-physiological-psychiatric axis with wearable GWAS.
A) Using the 258 wearable-derived static features as a continuous multivariate response variable, the GWAS was performed by pooling a set of 2,410 individuals (both healthy controls and individuals with any disorder). We identified 4 and 198 loci passing the p value thresholds of 5·10−8 and 1·10−5, respectively. A detailed list of genome-wide significant loci is provided in Table 1 and Table S5. Neuropsychiatric-related genes proximal to the identified loci are highlighted in pink. Brain-, and heart-related traits with associated variants overlapping these 4 loci are highlighted in orange. B) Left panel: rs365990 (chr14:23,392,602, A/G) is located in exon 25 of MYH6 and is associated with changes in wearable-derived heart rate features (multivariate GWAS p value = 5.33E-09). The boxplots show distributions of covariate-adjusted mean and interday coefficient of variation (CV) for heart rate across genotype groups at rs365990 (AA n individuals = 1,228; AG n individuals = 1,509; GG n individuals = 519). p values for each pairwise comparison are also displayed, encoded as follows: ***: p < 0.001, **: 0.001 ≤ p < 0.01, *: 0.01 ≤ p < 0.05, ns: p ≥ 0.05 (two-sided Wilcoxon Rank-Sum test). For visualization purposes, outliers are not shown. Right panel: enrichment, displayed as odds-ratio (log2(OR); y-axis) of the minor allele (G) in individuals with different psychiatric disorders (x-axis) compared to healthy controls. OR estimates and 95% confidence interval (error bar) are displayed. The red horizontal dashed line indicates no enrichment. The G allele is significantly more enriched in individuals with bipolar/psychotic disorder compared to healthy controls (two-sided Fisher test p value: 8.00E-03; FDR-adjusted p value: 7.00E-02). C) Similar representation for rs113525298 (chr7:1,791,353; AA n individuals = 2,294; AG n individuals = 101; GG n individuals = 15). rs113525298 is located 125 Kb from ELFN1, a gene that encodes for a postsynaptic protein involved in the temporal dynamics of interneuron recruitment., Elfn1 mutant mice exhibit hyperactivity that is treatable by psychostimulant medication., The G allele at rs113525298 is associated with increased minimum number of first-out-of-bed minutes and decreased minimum number of total-vigorously-active minutes (multivariate GWAS p value = 5.09E-09), and is significantly more enriched in healthy controls compared to individuals with ADHD (two-sided Fisher test p value: 9.00E-04; FDR-adjusted p value: 6.00E-03). (Details in Data S45-48 and Table S2). See also Figure S5.

Update of

References

    1. Zablotsky B, Terlizzi EP, and National Center for Health Statistics (U.S.) Mental health treatment among children aged 5–17 years : United States, 2019. NCHS data brief,. - PubMed
    1. UNICEF (2021). Impact of COVID-19 on poor mental health in children and young people ‘tip of the iceberg’ – UNICEF. https://www.unicef.org/philippines/press-releases/impact-covid-19-poor-m....
    1. CDC (2023). Data and Statistics on Children’s Mental Health. https://www.cdc.gov/childrensmentalhealth/data.html.
    1. McGorry PD, and Nelson B. (2019). Transdiagnostic psychiatry: premature closure on a crucial pathway to clinical utility for psychiatric diagnosis. World Psychiatry 18, 359–360. 10.1002/wps.20679. - DOI - PMC - PubMed
    1. Hartmann JA, McGorry PD, Destree L, Amminger GP, Chanen AM, Davey CG, Ghieh R, Polari A, Ratheesh A, Yuen HP, and Nelson B. (2020). Pluripotential Risk and Clinical Staging: Theoretical Considerations and Preliminary Data From a Transdiagnostic Risk Identification Approach. Front Psychiatry 11, 553578. 10.3389/fpsyt.2020.553578. - DOI - PMC - PubMed

LinkOut - more resources