. 2024 Dec 20;15(1):10711.
doi: 10.1038/s41467-024-54740-x.

Nuclear microRNA 9 mediates G-quadruplex formation and 3D genome organization during TGF-β-induced transcription

Affiliations

Nuclear microRNA 9 mediates G-quadruplex formation and 3D genome organization during TGF-β-induced transcription

Julio Cordero et al. Nat Commun. .

Abstract

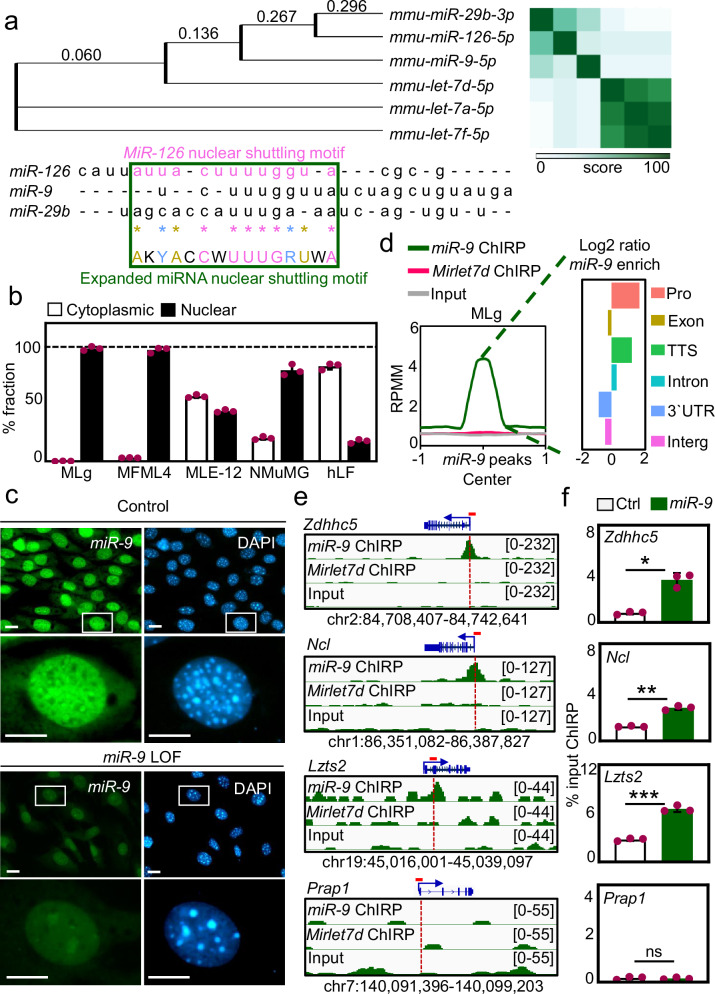
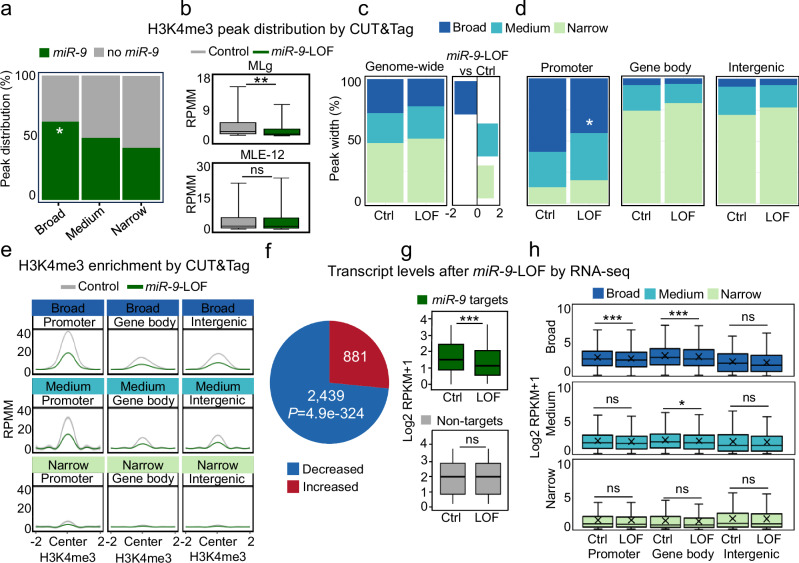
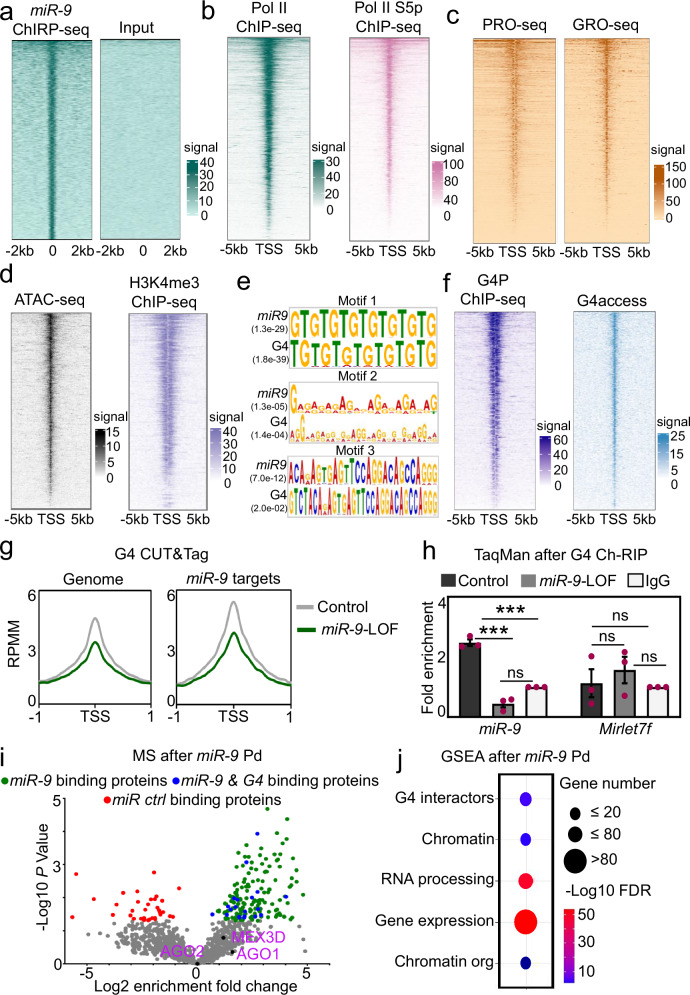
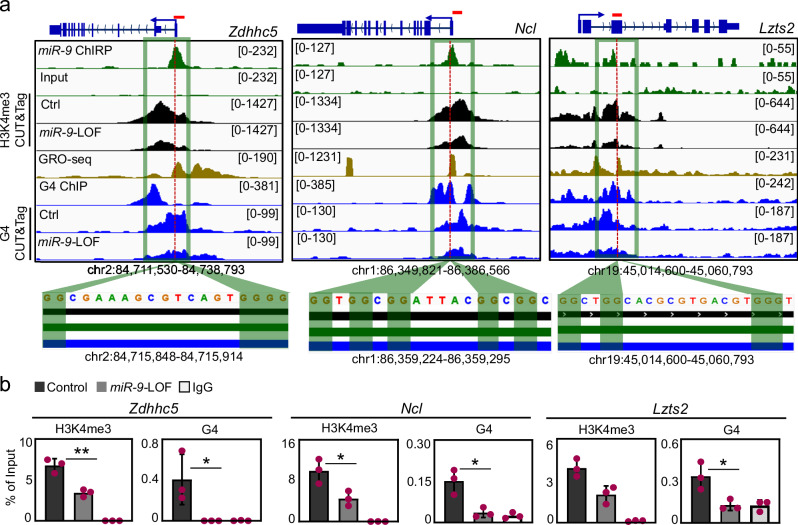
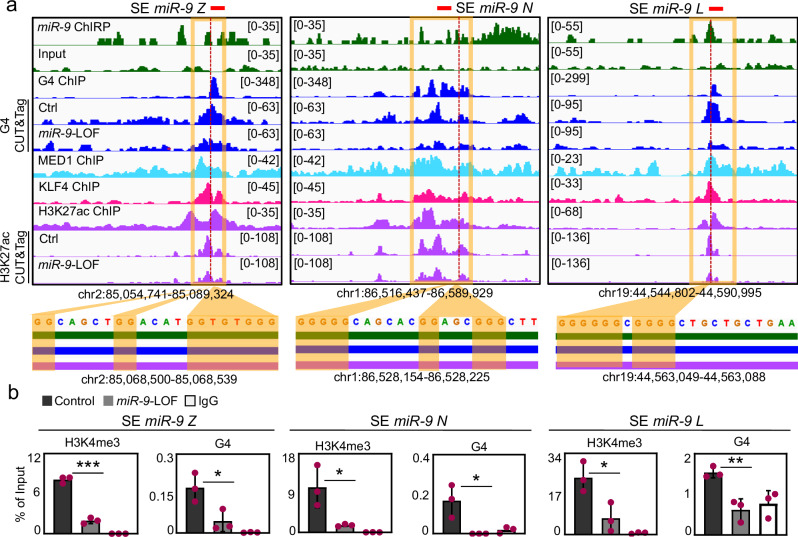
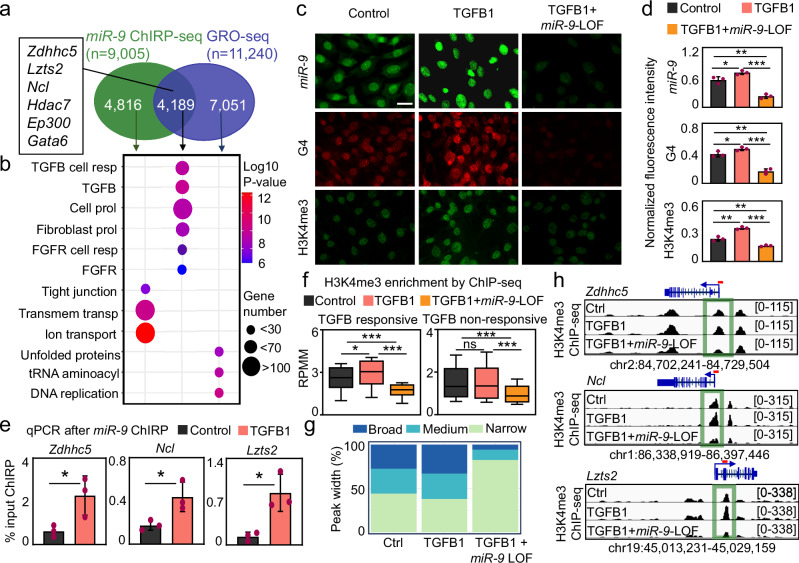
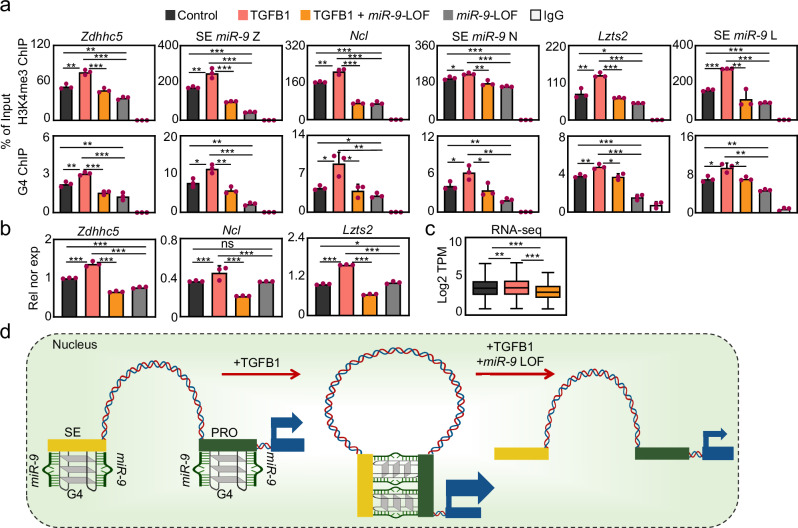
The dynamics of three-dimensional (3D) genome organization are essential to transcriptional regulation. While enhancers regulate spatiotemporal gene expression, chromatin looping is a means for enhancer-promoter interactions yielding cell-type-specific gene expression. Further, non-canonical DNA secondary structures, such as G-quadruplexes (G4s), are related to increased gene expression. However, the role of G4s in promoter-distal regulatory elements, such as super-enhancers (SE), and in chromatin looping has remained elusive. Here we show that mature microRNA 9 (miR-9) is enriched at promoters and SE of genes that are inducible by transforming growth factor beta 1 (TGFB1) signaling. Moreover, we find that miR-9 is required for formation of G4s, promoter-super-enhancer looping and broad domains of the euchromatin histone mark H3K4me3 at TGFB1-responsive genes. Our study places miR-9 in the same functional context with G4s and promoter-enhancer interactions during 3D genome organization and transcriptional activation induced by TGFB1 signaling, a critical signaling pathway in cancer and fibrosis.


Conflict of interest statement

Competing interests: The authors declare no competing interests.

Figures

Fig. 1
Fig. 1. Mature miR-9 is detected in the cell nucleus enriched at promoters and introns.
a Phylogenetic tree (left) and heat map (right) generated using sequences of indicated mature mouse miRNAs. Numbers, distance score. Bottom, sequence alignment of indicated mature mouse miRNAs highlighting the published miR-126 nuclear shuttling motif (magenta) and the expanded miRNA nuclear shuttling motif (green square) using IUPAC nucleotide code. Pink letters, conserved among all sequences; golden, conserved in at least 2 sequences; blue, conserved type of base (either purine or pyrimidine). b Mature miR-9-specific TaqMan assay following cellular fractionation of indicated cell lines. c Fluorescence microscopy of MLg cells after RNA FISH confirmed nuclear localization of endogenous miR-9. Cells were transiently transfected with control (top) or miR-9-specific antagomiR probes (bottom) to induce a miR-9 loss-of-function (LOF). Representative images from three independent experiments. Squares are shown at higher magnification. DAPI, nucleus. Scale bars, 10 µm. d Left, enrichment plot after miR-9-, or Mirlet7d-specific ChIRP-seq in MLg cells. Mirlet7d-specific probe was used as negative control. RPMM, read count per million mapped reads. Right, genome-wide distribution of miR-9 peaks by ChIRP-seq in MLg cells in different genomic regions and represented as Log2 ratios. Pro, promoters; TTS, transcription termination sites; Intron, intronic regions; 3´UTR, 3´untraslated regions; Interg, intergenic regions. e Visualization of selected miR-9 target genes using IGV genome browser showing miR-9 or Mirlet7d enrichment in MLg cells. ChIRP-seq reads were normalized using RPKM (reads per kilobase of transcript per million mapped reads) and are represented as log2 enrichment over inputs. Images show the indicated gene loci with genomic coordinates. Arrows, direction of genes; blue boxes, exons; red line, regions selected for single gene analysis in (f). f Analysis of selected putative miR-9 target genes by ChIRP using chromatin from MLg cells and control (Ctrl) or miR-9-specific biotinylated antisense oligonucleotides. In all bar plots data are presented as means; error bars, s.e.m (n = 3 biologically independent experiments); asterisks, P-values after two-tailed t-test, ***P ≤ 0.001; **P ≤ 0.01; *P ≤ 0.05; ns, non-significant. See also Supplementary Figs. 1 and 2. Source data are provided as a Source Data file.
Fig. 2
Fig. 2. MiR-9 is required for H3K4me3 broad domains, and basal transcriptional activity.
a Genome-wide distribution of H3K4me3 peaks by CUT&Tag in MLg cells, relative to broad (≥2.7 kb), medium (≥2 kb and <2.7 kb) and narrow (<2 kb) H3K4me3 domains that are also enriched with miR-9 or not (no miR-9). b Box plots showing the levels of H3K4me3 in MLg and MLE-12 cells that were transiently transfected with control (Ctrl) or miR-9-specific antagomiR probes to induce miR-9 loss-of-function (LOF). RPMM, read count per million mapped reads. Bar plots displaying the broadness of H3K4me3 domains genome-wide (c) or in different genomic regions (d) in MLg cells that were transfected as in (b). Square in (c) shows H3K4me3 enrichment in different domains as Log2 ratios of MLg cells after miR-9-LOF versus Ctrl transfected cells. Promoter (Peaks -/+ 2 kb from TSS), Gene body (exon and intron regions outside the −/+2 kb TSS) and Intergenic (peaks not located in previous regions). e Aggregate plots showing H3K4me3 enrichment at the indicated genomic regions and relative to indicated H3K4me3 domains in MLg cells transfected as in (b). Data were normalized using RPMM. f Total RNA-seq in MLg cells transfected as in (b). Pie chart shows distribution of significantly, differentially expressed transcripts (n = 3320) in decreased (n = 2439) and increased transcripts (n = 881) after miR-9-LOF. g, h Box plots of RNA-seq-based expression analysis of transcripts with non-significantly changed levels (non-targets; n = 324) and significantly decreased levels after miR-9-LOF (miR-9 targets; n = 2439). In (h), data of significantly decreased transcripts (n = 2439) were separated into the indicated H3K4me3 domains, and into the indicated genomic regions. In all box plots, values were normalized using RPKM; represented as log2 RPKM + 1; and showed as median (middle line); 25th, 75th percentile (box) and 5th and 95th percentile (whiskers). In all plots asterisks represent P-values, ***P ≤ 0.001; *P ≤ 0.05; ns, non-significant. P-values were calculated after two-tailed t-test (box plots) or two-tailed Fisher exact test (bar plots). See also Supplementary Fig. 3. Source data are provided as a Source Data file.
Fig. 3
Fig. 3. MiR-9 is required for G-quadruplex formation at promoters.
a Heat map for miR-9 enrichment at the TSS ± 2 kb of miR-9 target genes as determined by RNA-seq in Fig. 2f, g. Heat maps for enrichment of total Pol II and Pol II S5p (b), nascent RNA by precision nuclear run-on assay (PRO-seq) and global run-on sequencing (GRO-seq) (c), chromatin accessibility by ATAC-seq and H3K4me3 by ChIP-seq (d), at the TSS ± 5 kb of miR-9 target genes. e Motif analysis of miR-9 target genes showed significant enrichment of nucleotide motifs that are similar to motifs found in loci form G4 as determined by G4 CUT&Tag. f Heat maps for G4 enrichment at the TSS ± 5 kb of the miR-9 target genes by G4P ChIP-seq (left) or G4access (right). g Enrichment plots after G4-specific CUT&Tag in MLg cells transiently transfected with control (Ctrl) or miR-9-specific antagomiR probes to induce miR-9 loss-of-function (LOF). Data were normalized using RPMM. h Mir-9- or Mirlet7f-specific TaqMan assays after chromatin-RNA immunoprecipitation (Ch-RIP) in MLg cells transfected as in (g) and using G4-specific antibodies or IgG. Bar plot shows fold enrichment over IgG as means; error bars, s.e.m (n = 3 biologically independent experiments); asterisks, P-values after two-tailed t-test, ***P ≤ 0.001; ns, non-significant. i Mass spectrometry-based analysis (MS) of proteins precipitated by miRNA pulldown (miR-Pd) from the nuclear fraction of MLg cells using biotinylated control miRNA (mirctrl) or miR-9 as baits. Volcano plot representing the significance (-log10 P-values after limma two-tailed t-test) vs. enrichment fold change (log2 enrichment ratios) between miR-9-Pd and mirctrl-Pd. Each dot represents a protein; green, proteins significantly enriched by miR-9; blue, proteins significantly enriched by miR-9 and interacting with G4s; red, proteins significantly enriched by mirctrl; gray and black, non-significantly bound proteins. Black dots show AGO1, AGO2 and MEX3D. j Gene set enrichment analysis (GSEA) of the proteins that were significantly binding miR-9 as identified in (i). G4 interactors, proteins interacting with G4s; Chromatin org, Chromatin organization; FDR, false discovery rate. See also Supplementary Fig. 4. Source data are provided as a Source Data file.
Fig. 4
Fig. 4. H3K4me3, nascent RNA and G4 are enriched at promoters of selected miR-9 target genes.
a Visualization of selected miR-9 target genes using IGV genome browser showing enrichment of miR-9 by ChIRP-seq (green), H3K4me3 by CUT&Tag in Ctrl and miR-9-specifc antagomiR transfected MLg cells (black), nascent RNA by GRO-seq (brown), G4 by G4P ChIP-seq in NIH/3T3 cells (blue), G4 by CUT&Tag in Ctrl and miR-9-specifc antagomiR transfected MLg cells (blue). Reads were normalized using reads per kilobase per million (RPKM) after bamCoverage. Images show the indicated gene loci with their genomic coordinates. Arrows, direction of the genes; blue boxes, exons; red lines, regions selected for single gene analysis in (b); green squares, regions with enrichment of miR-9, H3K4me3, nascent RNA and G4; dotted lines, regions shown at the bottom with high G content. Bottom, black line, H3K4me3 enrichment; green line, miR-9 enrichment; blue line, G4 enrichment. b Analysis of the promoter of selected miR-9 target genes by ChIP using chromatin from MLg cells transfected with control (Ctrl) or miR-9-specific antagomiR to induce miR-9 loss-of-function (LOF). Bar plots presenting data as means; error bars, s.e.m (n = 3 biologically independent experiments); asterisks, P-values after two-tailed t-test, **P ≤ 0.01; *P ≤ 0.05. See also Supplementary Fig. 5. Source data are provided as a Source Data file.
Fig. 5
Fig. 5. Nuclear miR-9 is enriched at super-enhancers.
a Alluvial plot showing loci with miR-9 enrichment (ChIRP-seq, green) also with enrichment of G4 (G4P ChIP-seq) and SE markers MED1 and H3K27ac (ChIP-seq). No-miR-9, loci without miR-9. b Venn diagram showing common loci (n = 3583) with miR-9 enrichment (ChIRP-seq, green), H3K27ac (ChIP-seq, purple) and MED1 (ChIP-seq, turquoise) and nascent RNA (GRO-seq, blue). c RNA biotype distribution of transcripts related to the common loci in (b) showing that 3423 transcripts (95.5%) were found in a database as enhancer RNAs. d Hockey stick plot after analysis using the ROSE algorithm and showing distribution of normalized H3K27ac CUT&Tag signal across typical enhancers (TYE) and super-enhancers (SE) in Ctrl (gray line) or miR-9 antagomir (green line) transfected MLg cells. e Bar plot showing percentage of TYE and SE with or without miR-9 in Ctrl-transfected MLg cells after cross analysis of the results obtained in (d) with the results obtained by miR-9 ChIRP-seq from Fig. 1d. f Heat map showing significant enrichment of the indicated proteins by ChIP-seq at SE and TYE that are also enriched with miR-9 (green) or not (No miR-9, gray). Values, z-Score of the normalized reads counts from annotatePeaks.pl from HOMER. Indicated proteins were previously related to SE in murine cells. All selected proteins showed a significant P-value (P < 0.001) after two-tailed Willcox test. g Bar plots showing H3K27ac peak distribution after ROSE analysis in MLg cells transfected as in (d) at SE and TYE divided by the size of the enhancers (SE-broad >3.2 kb, SE-medium >2.3 kb <3.2 kb, SE-narrow <2.3 kb, TYE-broad >0.9 kb, TYE-medium >0.6 kb <0.9 kb and TYE-narrow <0.6 kb). h Aggregate plots after CUT&Tag in MLg cells transfected as in (d) showing the enrichment of H3K27ac and G4 at SE and TYE. Data were normalized using RPMM. i Hockey stick plot after analysis of G4 CUT&Tag as in (d). In all plots, asterisks, P-values after two-tailed Willcox test (Hockey stick plots) or two-tailed Fisher´s exact test (bar plots), ***P ≤ 0.001; *P ≤ 0.05; ns, non-significant. See also Supplementary Fig. 6 and Supplementary Data 1. Source data are provided as a Source Data file.
Fig. 6
Fig. 6. Nuclear miR-9 is enriched at super-enhancers and is required for G-quadruplexes.
a Visualization of selected SE with miR-9 enrichment using IGV genome browser showing enrichment miR-9 by ChIRP-seq (green), G4 by G4P ChIP-seq in NIH/3T3 cells (blue), G4 by CUT&Tag in Ctrl and miR-9-specifc antagomiR transfected MLg cells (blue), MED1 (turquoise), KLF4 (magenta) and H3K27ac (purple) in by ChIP-seq in mouse embryonic fibroblasts, H3K27ac by CUT&Tag in Ctrl and miR-9-specifc antagomiR transfected MLg cells (purple). Reads were normalized using reads per kilobase per million (RPKM). Images show the indicated gene loci with their genomic coordinates. Orange squares, regions with enrichment of miR-9, G4 and SE markers; red lines, regions selected for single gene analysis in (b); dotted lines, regions shown at the bottom with high G content. Bottom, green line, miR-9 enrichment; blue line, G4 enrichment; purple line, H3K27ac enrichment. b Analysis of selected SE with miR-9 enrichment by ChIP using chromatin from MLg cells transfected with control (Ctrl) or miR-9-specific antagomiR to induce miR-9 loss-of-function (LOF). Bar plots presenting data as means; error bars, s.e.m (n = 3 biologically independent experiments); asterisks, P-values after two-tailed t-test, ***P ≤ 0.001; **P ≤ 0.01; *P ≤ 0.05. See also Supplementary Figs. 6, 7. Source data are provided as a Source Data file.
Fig. 7
Fig. 7. Nuclear miR-9 is required for H3K4me3 enrichment at promoters of TGFB1-responsive genes.
a Venn diagram after cross analysis of miR-9 ChIRP-seq and GRO-seq showing loci with miR-9 enrichment and nascent RNAs (n = 4189), in which the selected miR-9 target genes are included (square). b Gene set enrichment analysis (GSEA) of the three loci groups identified in (a). Resp, response; prol, proliferation; trans, transport. P values after two-tailed Fisher´s exact test and represented as log10. c, d Fluorescence microscopy of MLg cells after miR-9-specific FISH (top), G4- (middle) or H3K4me3-specific (bottom) immunostaining. Cells were transfected with control (Ctrl) or miR-9-specific antagomiR to induce a loss-of-function (LOF), and non-treated or treated with TGFB1, as indicated. Representative images from three independent experiments (c) and quantification of them (d). Scale bars, 10 µm. e Promoter analysis of the indicated miR-9 target genes in non-treated or TGFB1-treated MLg cells by qPCR after miR-9-specific ChIRP. f, g H3K4me3 CUT&Tag in MLg cells that were treated as in (c). f Box plots showing H3K4me3 enrichment at promoters of genes that are responsive (left) or non-responsive (right) to TGFB1. Data were normalized using RPMM. g Genome-wide distribution of H3K4me3 peaks relative to broad, medium and narrow H3K4me3 domains. h Visualization of selected miR-9 target genes using IGV genome browser showing enrichment H3K4me3 by ChIP-seq in MLg cells that were treated as in (c). Images show the indicated loci with their genomic coordinates. Arrows, transcription direction; green squares, promoter regions; dotted lines, regions selected for single gene analysis in Fig. 4b. Bar plots show data as means; error bars, s.e.m (n = 3 biologically independent experiments). Box plots indicate median (middle line), 25th, 75th percentile (box) and 5th and 95th percentile (whiskers). In all plots, asterisks or P-values after two-tailed t-test, ***P ≤ 0.001; **P ≤ 0.01; *P ≤ 0.05; ns, non-significant. See also Supplementary Fig. 8. Source data are provided as a Source Data file.
Fig. 8
Fig. 8. Nuclear miR-9 is required for chromatin loops at promoters of TGFB1-responsive genes.
a Schematic representation of chromatin loops that are enriched with H3K4me3 and enhance transcription. TSS, transcription start site. Created in BioRender. Rogel, D. (2022) BioRender.com/q42a090. b Box plot showing the number of chromatin interaction hubs by H3K4me3-specific HiChIP-seq in MLg cells that were transfected with control (Ctrl) or miR-9-specific antagomir (miR-9-LOF, loss-of-function), and non-treated or treated with TGFB1, as indicated. Box plot indicates median (middle line), 25th, 75th percentile (box) and 5th and 95th percentile (whiskers). Number of hubs in Ctrl, n = 34,638; in TGFB1, n = 16,361 and TGFB1+miR-9-LOF, n = 16,668. Asterisks, P-values after two-tailed t-test, ***P ≤ 0.001. c Bar plot showing the percentage of significant chromatin interactions at loci with or without miR-9 after cross analysis of the results obtained in (b) with the results obtained by miR-9 ChIRP-seq from Fig. 1d. Asterisk, P-values after Fisher´s exact test, *P ≤ 0.05. d Line charts showing the number of significant chromatin interactions at loci with miR-9 and H3K4me3 enrichment in MLg cells treated as in (b). Four clusters were generated using k-means algorithm. Data are represented as log2 of the ratio relative to Ctrl-transfected, non-treated cells. Numbers indicate number of significant chromatin interactions in each cluster; error bars, SD. e Visualization of promoters of selected miR-9 target genes (green squares) and SE with miR-9 enrichment (orange squares) using IGV genome browser showing enrichment miR-9 by ChIRP-seq (green), G4 by G4P ChIP-seq (blue), MED1 (turquoise), KLF4 (magenta) and H3K27ac (purple) by ChIP-seq. Reads were normalized using reads per kilobase per million (RPKM) measure and are represented as log2 enrichment over their corresponding inputs. Bottom, chromatin loops by HiChIP-seq in MLg cells treated as in (b). Images show the indicated loci with their genomic coordinates. Arrows, transcription direction; red lines, regions selected for single gene analysis in Fig. 9a. See also Supplementary Fig. 9. Source data are provided as a Source Data file.
Fig. 9
Fig. 9. Promoter-super-enhancer looping of TGFB1-responsive genes requires miR-9.
a Analysis of the promoters and SE highlighted in Fig. 8b by ChIP using the indicated antibodies and chromatin of MLg cells that were transfected with control (Ctrl) or miR-9-specific antagomir (miR-9-LOF, loss-of-function), and non-treated or treated with TGFB1, as indicated. b Expression analysis of the selected miR-9 target genes by qRT-PCR in MLg cells treated as in (a). All bar plots present data as means; error bars, s.e.m (n = 3 biologically independent experiments). c RNA-seq using total RNA from in MLg cells treated as in (a). Data are presented as Log2 of transcript per million (TPM). Box plot shows median (middle line), 25th, 75th percentile (box) and 5th and 95th percentile (whiskers). Number of genes in all three conditions is n = 24,957. I all plots, asterisks represent P-values after two-tailed t-test, ***P ≤ 0.001; **P ≤ 0.01; *P ≤ 0.05; non-significant. See also Supplementary Fig. 9. Source data are provided as a Source Data file. d Model summarizing the results presented in the manuscript. Left, G4 are formed in miR-9 (red lines) -dependent manner at SE (orange box) and promoters (green box) of TGFB1-responsive genes (blue box, coding region). Middle, TGFB1treament increases euchromatin histone mark H3K4me3, G4 and chromatin loops bringing SE and promoter to close physical proximity, thereby enhancing transcription (arrow) of the corresponding gene. Right, miR-9-LOF antagonizes the effects induced by TGFB1. Created in BioRender. Rogel, D. (2023) BioRender.com/c64w876.

References

    1. Jerkovic, I. & Cavalli, G. Understanding 3D genome organization by multidisciplinary methods. Nat. Rev. Mol. Cell Biol.22, 511–528 (2021). - PubMed
    1. Misteli, T. The self-organizing genome: principles of genome architecture and function. Cell183, 28–45 (2020). - PMC - PubMed
    1. Gohlke, J. et al. DNA methylation mediated control of gene expression is critical for development of crown gall tumors. PLoS Genet.9, e1003267 (2013). - PMC - PubMed
    1. Georgakopoulos-Soares, I., Morganella, S., Jain, N., Hemberg, M. & Nik-Zainal, S. Noncanonical secondary structures arising from non-B DNA motifs are determinants of mutagenesis. Genome Res.28, 1264–1271 (2018). - PMC - PubMed
    1. Dobersch, S. et al. Positioning of nucleosomes containing gamma-H2AX precedes active DNA demethylation and transcription initiation. Nat. Commun.12, 1072 (2021). - PMC - PubMed

Publication types

MeSH terms

Associated data