. 2025 Apr;44(13):893-908.
doi: 10.1038/s41388-024-03259-y. Epub 2024 Dec 21.

CBL0137 and NKG2A blockade: a novel immuno-oncology combination therapy for Myc-overexpressing triple-negative breast cancers

Affiliations

CBL0137 and NKG2A blockade: a novel immuno-oncology combination therapy for Myc-overexpressing triple-negative breast cancers

Prahlad V Raninga et al. Oncogene. 2025 Apr.

Erratum in

Abstract

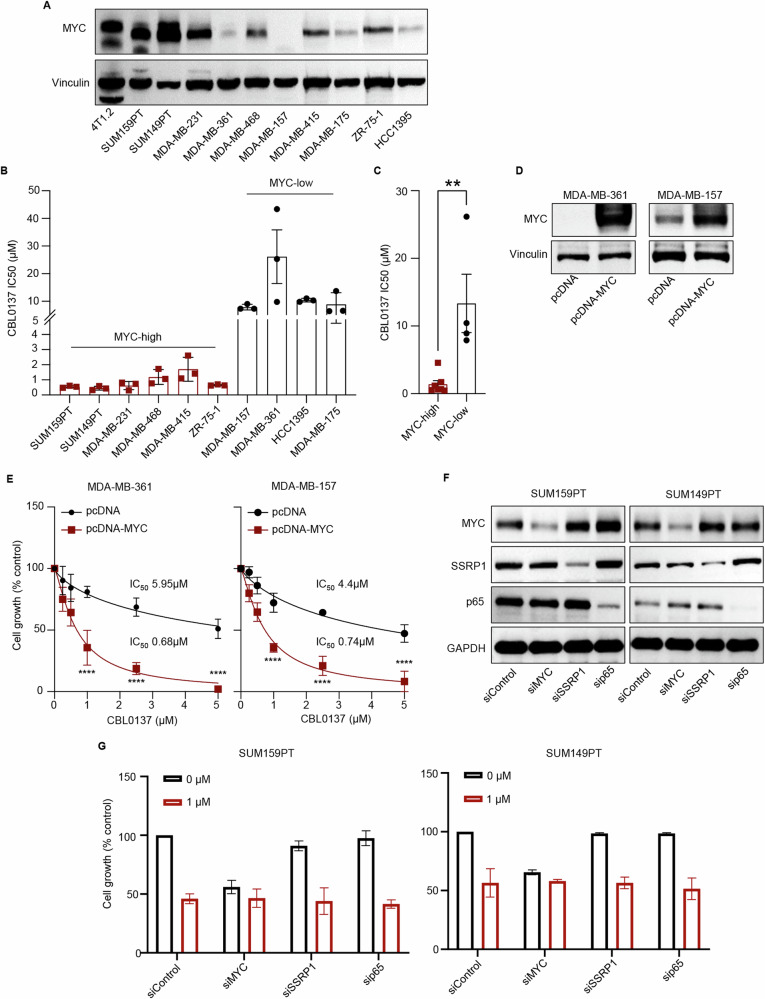
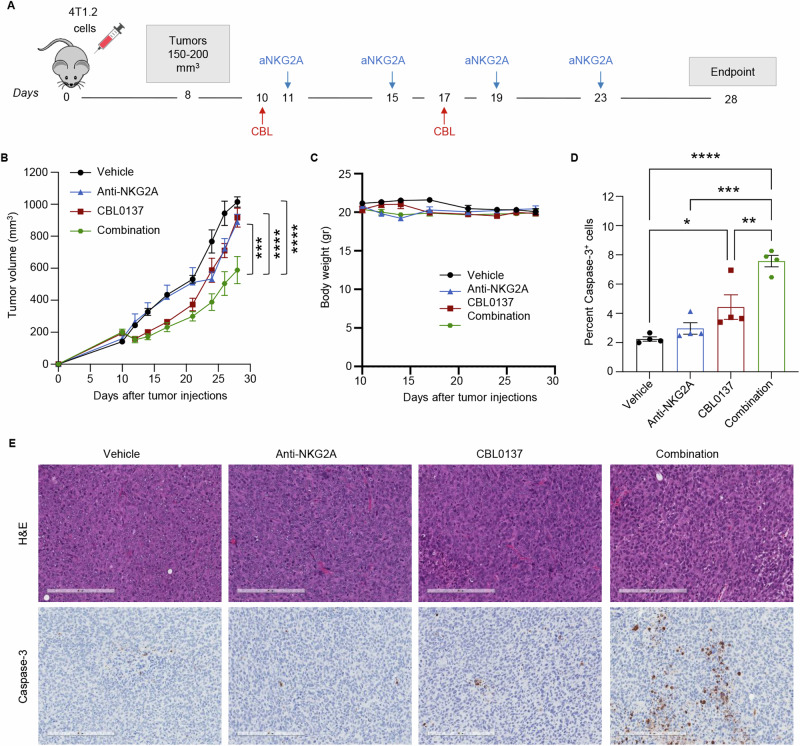
The MYC proto-oncogene is upregulated in >60% of triple-negative breast cancers (TNBCs), it can directly promote tumor cell proliferation, and its overexpression negatively regulates anti-tumor immune responses. For all these reasons, MYC has long been considered as a compelling therapeutic target. However, pharmacological inhibition of MYC function has proven difficult due to a lack of a drug-binding pocket. Here, we demonstrate that the potent abrogation of MYC gene transcription by CBL0137 induces immunogenic cell death and reduces proliferation in MYC-high but not in MYC-low TNBC in vitro. CBL0137 also significantly inhibited the in vivo growth of primary tumors in a human MYC-high TNBC xenograft model (MDA-MB-231). Moreover, CBL0137 inhibited the tumor growth of highly aggressive mouse 4T1.2 syngeneic TNBC model in immunocompetent mice by inhibiting the MYC pathway and inducing Type I interferon responses. Immune profiling of CBL0137-treated mice revealed significantly enhanced tumor-specific immune responses and increased proportions of tumor infiltrating effector CD8+ T cells, CD4+ T cells, and NK cells. CBL0137-induced immune activation also resulted in increased exhaustion of immune effector cells. In particular, NKG2A up-regulation on activated effector cells and of its ligand Qa-1b on tumors in vivo was identified as a possible immune evasive mechanism. Indeed, NKG2A blockade synergized with CBL0137 significantly inhibiting the in vivo growth of 4T1.2 tumors. Collectively, our findings provide the rationale supporting the exploitation of CBL0137-induced anti-tumor immunity in combination with NKG2A blockade to improve the treatment of TNBC expressing high levels of MYC.


Conflict of interest statement

Competing interests: The authors declare no competing interests. Ethics Declarations: All experimental methods were performed in accordance with the guidelines of the QIMR Berghofer Medical Research Institute Animal Ethics Committee Approved ethics: A2108-613, the Standard Operating Procedure (SOPs) approved by the University of Queensland Animal Ethic Committee (UQ Health Sciences Ethics Committee (HS) Approved Ethics: UQDI/252/16), and the guidelines of the Peter MacCallum Cancer Center Animal Ethics Committee (Approved ethics: XXX).

Figures

Fig. 1
Fig. 1. CBL0137 inhibits proliferation in MYC-high triple-negative breast cancer cells.
A MYC protein levels were analyzed in a panel of breast cancer cell lines using Western blot. Actin was used as a loading control. B A panel of breast cancer cell lines were treated with CBL0137 (0–5 µM) for 72 h. Cell viability was assessed by MT cell viability assays and the IC50 value of CBL0137 in each MYC-high and MYC-low breast cancer cell line is shown. Data are presented as mean ± SEM (n = 3 technical replicates). C Mean IC50 value of CBL0137 in MYC-high and MYC-low breast cancer cell lines. Data are presented as mean ± SEM; t Test, **p < 0.01. D, E MDA-MB-361 and MDA-MB-157 cells were transfected with either pcDNA4 vector or pcDNA4-MYC plasmid for 24 h. MYC protein levels were analyzed by Western blot (D). Transfected cells were then treated with CBL0137 (0–5 µM) for 72 h. Cell viability was analyzed by MT cell viability assay (E) (n = 3 technical replicates). Data are presented as mean ± SEM; Two-Way ANOVA with Sidak’s multiple comparison test, ****p < 0.0001. F SUM159PT and SUM149PT cells were transfected with either scramble or control, MYC-specific, SSRP1-specific, or p65-specific siRNA for 48 h. MYC, SSRP1, and p65 protein levels were analyzed by Western blot. G SUM159PT and SUM149PT cells transfected with either scramble or control, MYC-specific, SSRP1-specific, or p65-specific siRNA for 24 h followed by the treatment with or without CBL0137 (1 µM) for 96 h. Cell proliferation was analysed by the MTS assays (n = 2 biological replicates). Data are presented as mean ± SD.
Fig. 2
Fig. 2. CBL0137 inhibits tumor growth, downregulates MYC, and induces inflammatory response in the in vivo breast models.
A Tumor growth in NSG mice orthotopically injected with MDA-MB-231 cells following treatment with vehicle or CBL0137 (60 mg/kg, once/week, i.v.) for three weeks. Treatment started when the tumor reached 50-100 mm3. Data are presented as mean ± SEM (n = 6 mice/group); t Test on tumor volumes at day 35, ***p < 0.001. Murine 4T1.2 tumor growth in fully immunocompetent Balb/c mice (B) and in RAG2 knockout Balb/c mice (C) following treatment with vehicle or CBL0137 (60 mg/kg, once/week, i.v.) for three weeks. Data are presented as mean ± SEM (n = 6 mice/group); t Test on tumor volumes at day 21, ****p < 0.0001. D % Growth inhibition of murine 4T1.2 tumors in fully immunocompetent Balb/c mice (WT) and in RAG2 knockout (RAG2 KO) mice following treatment with CBL0137 for 19 days. Data are presented as mean ± SEM (n = 5 tumor/group); t Test, ****p < 0.0001. E Myc mRNA levels in murine 4T1.2 tumors treated with vehicle or CBL0137 were analyzed by RT-qPCR. Data are presented as mean ± SEM (n = 4 tumor/group); t Test, ****p < 0.0001. F Murine 4T1.2 tumor-bearing Balb/c mice were treated with vehicle or CBL0137 (60 mg/kg, IV) for one week and tumors were collected for RNA seq analysis (n = 4 tumor/group). Gene Set Enrichment Analysis showing downregulation of the MYC target V1 gene signature. G Gene Set Enrichment Analysis of the RNA Seq in murine 4T1.2 tumors treated with vehicle or CBL0137 showing upregulation of the Hallmark IFNγ and the Hallmark IFNα gene signature. H IFNγ levels measured by ELISA in the serum of 4T1.2 tumor-bearing mice following one week of treatment with vehicle or CBL0137 (60 mg/kg, i.v.). Data are presented as mean ± SEM (n = 4 mice/group); t Test, *p < 0.05. I Gene Ontology analysis (RNA-seq) of the pathways upregulated in CBL0137-treated 4T1.2 tumors compared to vehicle-treated tumors in vivo (n = 4 tumor/group).
Fig. 3
Fig. 3. CBL0137 treatment induces immunogenic cell death in MYC-high breast cancer cells in vitro and in vivo.
Murine 4T1.2 cells (A), human MYC-high breast cancer cells SUM159PT (B) and SUM149PT (C) as well as MYC-low MDA-MB-361 (D) cells were treated with CBL0137 (0–2.5 µM) for 24 h. The percentage of early apoptotic (Annexin V+7-AAD-) and late apoptotic (Annexin V+7-AAD+) cells (left) and the percentage of Calreticulin-positive (CRT+) early apoptotic cells (right) were analyzed by Flow Cytometry as described in methods. Data are presented as mean ± SEM (n = 3 technical replicates); One-way ANOVA with Dunnett’s multiple comparisons test, *p < 0.05, ***p < 0.001****p < 0.0001. E 4T1.2 cells killed by freezing and thawing cycles (red) or treated with 5 µM CBL0137 for 24 h (blue) were injected into the 4th mammary fat-pad of female Balb/c mice. Four days later, mice were re-challenged with untreated live 4T1.2 cells by injection into the 9th mammary fat-pad and mice were monitored for tumor growth. Naïve mice were used as negative controls (black). Data are presented as mean ± SEM (n = 6 mice/group); t Test on day 5, 9, and 13 versus Naïve mice, ***p < 0.001****p < 0.0001.
Fig. 4
Fig. 4. CBL0137 treatment induces tumor-specific immune response in 4T1.2 model in vivo.
A Experimental scheme: Balb/c mice were orthotopically injected with 4T1.2 cells and 2 weekly treatments with CBL0137 (60 mg/kg) were started after the tumors reached a size of at least 50 mm3. Control mice received vehicle only. Blood was collected at day 17 for the polyfunctional assay and tumors were collected at day 28 for immune profiling by flow cytometry (Fig. 6). Tumor growth over time measured by caliper (B) and body weight (C) were monitored for 28 days. Data are presented as mean ± SEM (n = 6 mice/group); t Test on day 28 versus control mice, ****p < 0.0001. D Percentage of CD4+ (left) and CD8+ (right) T cells expressing TNFα, IFNγ and IL2 upon 6 h of ex-vivo restimulation with peptides derived from universal tumor antigens: mSurvivin53–67 DLAQCFFCFKELEGW; mSurvivin 66–74 GWEPDDNPI; mTERT 167–175 AYQVCGSPL. Data are presented as mean ± SEM (n = 5 mice/group); One-way ANOVA with Dunnett’s multiple comparisons test, *p < 0.05, ***p < 0.001.
Fig. 5
Fig. 5. CBL0137 treatment induces activation and exhaustion of tumor infiltrating immune effector cells.
Mice and tumors as described in Fig. 4A. Percentages of CD8+ T cells (top), CD4+ Tconv cells (middle) and NK cells (bottom) expressing the indicated activation markers (A) or inhibitory checkpoint molecules (B). Data are presented as mean ± SEM (n = 7 mice/group); t Test, *p < 0.05, **p < 0.01, ***p < 0.001****p < 0.0001. Outliers were excluded using Prism 9 and the recommended ROUT method with a False Discovery Rate (FDR) of Q = 0.5%. C Boolean gating analysis for the co-expression analysis of the 7 inhibitory checkpoint molecules shown in (B) in CD8+ T cells (top), CD4+ Tconv cells (middle) and NK cells (bottom). Left: percentages of cells co-expression 0, 1, or more then 1 ( > 1) inhibitory checkpoint molecule. Right: percentages of cells co-expressing any combination of 2, 3, 4, 5, 6 inhibitory checkpoint molecules, or all 7. Data are presented as mean ± SEM (n = 7 mice/group); t Test, *p < 0.05, **p < 0.01, ***p < 0.001. Outliers were excluded using Prism 9 and the recommended ROUT method with a False Discovery Rate (FDR) of Q = 0.5%.
Fig. 6
Fig. 6. CBL0137 treatment induces the TIGIT/DNAM1 and NKG2A/Qa-1b axes in 4T1.2 tumors.
A Mice and tumors as described in Fig. 4A. Left: percentages of NKG2A or TIGIT positive cells within CD69 positive and negative CD8+ T cells in tumors from control (Vehicle) or treated mice (CBL0137). Center: percentages of NKG2A or TIGIT positive cells within GZB positive and negative CD8+ T cells in tumors from control (Vehicle) or treated mice (CBL0137). Right: percentages of NKG2A or TIGIT positive cells within CD69 positive and negative CD4+ Tconv cells in tumors from control (Vehicle) or treated mice (CBL0137). Data are presented as mean ± SEM (n = 7 mice/group); Two-way ANOVA with Tukey’s multiple comparisons test, *p < 0.05, **p < 0.01, ***p < 0.001****p < 0.0001. B Mice and tumors as described in Fig. 4A. Left: Percentages of DNAM1 and TIGIT double negative (DNAM1-TIGIT-), double positive (DNAM1+TIGIT+), and single positive (DNAM1+TIGIT- or DNAM1-TIGIT+) cells in CD8+ T cells (top), CD4+ Tconv cells (middle) and NK cells (bottom). Right: Ratio between the expression levels (MFI) of TIGIT and DNAM1 on DNAM1+TIGIT+ double positive CD8+ T cells (top), CD4+ Tconv cells (middle) and NK cells (bottom). Data are presented as mean ± SEM (n = 7 mice/group); t Test. Outliers were excluded using Prism 9 and the recommended ROUT method with a False Discovery Rate (FDR) of Q = 0.5%. C Mice and tumors as in Fig. 2. Relative mRNA expression for the NKG2A ligand, Qa-1b, in CBL0137-treated and untreated (vehicle, V) 4T1.2 tumors. Data are presented as mean ± SEM (n = 4 mice/group); t Test, *p < 0.05. D Relative mRNA expression for the NKG2A ligand, Qa-1b, in 4T1.2 cells treated in vitro with CBL0137 (0-0.5 µM) for 48 h. Data are presented as mean ± SEM (n = 3); One-way ANOVA with Tukey’s multiple comparisons test, *p < 0.05, ****p < 0.0001. E–G 4T1.2 cells were transfected with either control siRNAs (siCtrl) or a mixture of IfngR1 and IfngR2-specific siRNAs (siIfngR) for 24 h, and then treated with 0.5 µM CBL0137 for 48 h or left untreated. E Relative mRNA levels for IfngR1, and IfngR2 analyzed by RT-qPCR. F IFNγ levels in the cell culture media analyzed by ELISA. G Relative mRNA levels for H2-T23 (Qa-1b) analyzed by RT-qPCR. Data are presented as mean ± SEM (n = 3); One-way ANOVA with Tukey’s multiple comparisons test, **p < 0.01, ***p < 0.001, ****p < 0.0001.
Fig. 7
Fig. 7. CBL0137 exerts a synergistic anti-cancer activity when combined with NKG2A blockade in the 4T1.2 model.
A Balb/c mice were orthotopically injected with 4T1.2 cells and treated with either CBL0137 alone (60 mg/kg), or anti-NKG2A alone (200 µg), or their combination at the indicated days. Treatment commenced when tumors reached 150–200 mm3 in size to develop established tumors. Tumors were collected on day 28 for processing and IHC staining as described in methods. Tumor growth over time measured by caliper (B) and tumor volumes at day 28 (C) Data are presented as mean ± SEM (n = 6 mice/group); Two-way ANOVA with Sidak’s multiple comparisons test, ***p < 0.001, ****p < 0.0001. D, E Representative IHC images of H&E and ApopTag staining (Caspase-3) of primary 4T1.2 tumors treated with vehicle, CBL0137, anti-NKG2A blocking antibody, or the combination therapy for 2-weeks (D). Quantification of ApopTag staining in the primary 4T1.2 tumors. Percentage of Apoptotic cells is presented as mean ± SEM (n = 4 tumors/group) (E). One-way ANOVA with Sidak’s multiple comparisons test, *p < 0.05, **p < 0.01, ***p < 0.001, ****p < 0.0001.

References

    1. Watase C, Shiino S, Shimoi T, Noguchi E, Kaneda T, Yamamoto Y, et al. Breast cancer brain metastasis-overview of disease state, treatment options and future perspectives. Cancers (Basel) 2021;13:1078. - PMC - PubMed
    1. Dong Y, Tu R, Liu H, Qing G. Regulation of cancer cell metabolism: oncogenic MYC in the driver’s seat. Signal Transduct Target Ther. 2020;5:124. - PMC - PubMed
    1. Felsher DW, Bishop JM. Reversible tumorigenesis by MYC in hematopoietic lineages. Mol Cell. 1999;4:199–207. - PubMed
    1. Jain M, Arvanitis C, Chu K, Dewey W, Leonhardt E, Trinh M, et al. Sustained loss of a neoplastic phenotype by brief inactivation of MYC. Science. 2002;297:102–4. - PubMed
    1. Shachaf CM, Kopelman AM, Arvanitis C, Karlsson A, Beer S, Mandl S, et al. MYC inactivation uncovers pluripotent differentiation and tumour dormancy in hepatocellular cancer. Nature. 2004;431:1112–7. - PubMed

MeSH terms

LinkOut - more resources