. 2025 Mar;132(4):384-400.
doi: 10.1038/s41416-024-02919-w. Epub 2024 Dec 20.

Targeting PTGDS Promotes ferroptosis in peripheral T cell lymphoma through regulating HMOX1-mediated iron metabolism

Affiliations

Targeting PTGDS Promotes ferroptosis in peripheral T cell lymphoma through regulating HMOX1-mediated iron metabolism

Shunfeng Hu et al. Br J Cancer. 2025 Mar.

Abstract

Background: Peripheral T cell lymphoma (PTCL) is characterized by high heterogeneity, strong aggressiveness, and extremely poor prognosis. Ferroptosis, a novel form of programmed cell death, has been involved in tumor development and targeting ferroptosis holds great potential for tumor therapy.

Methods: Lentiviral transfection was performed to regulate gene expression, followed by Tandem mass tag (TMT)-mass spectrometry and RNA-sequencing. Tumor xenograft models were established for in vivo experiments.

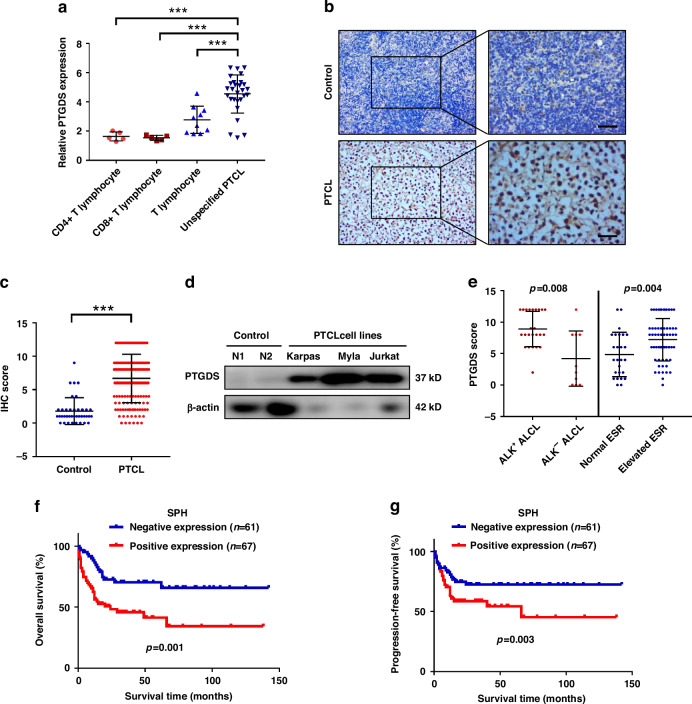
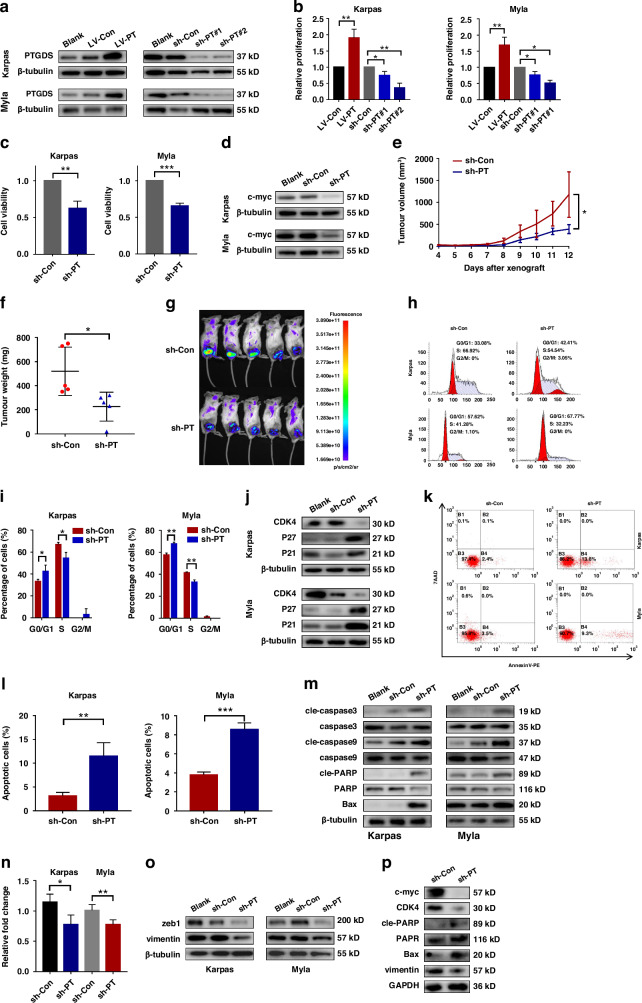
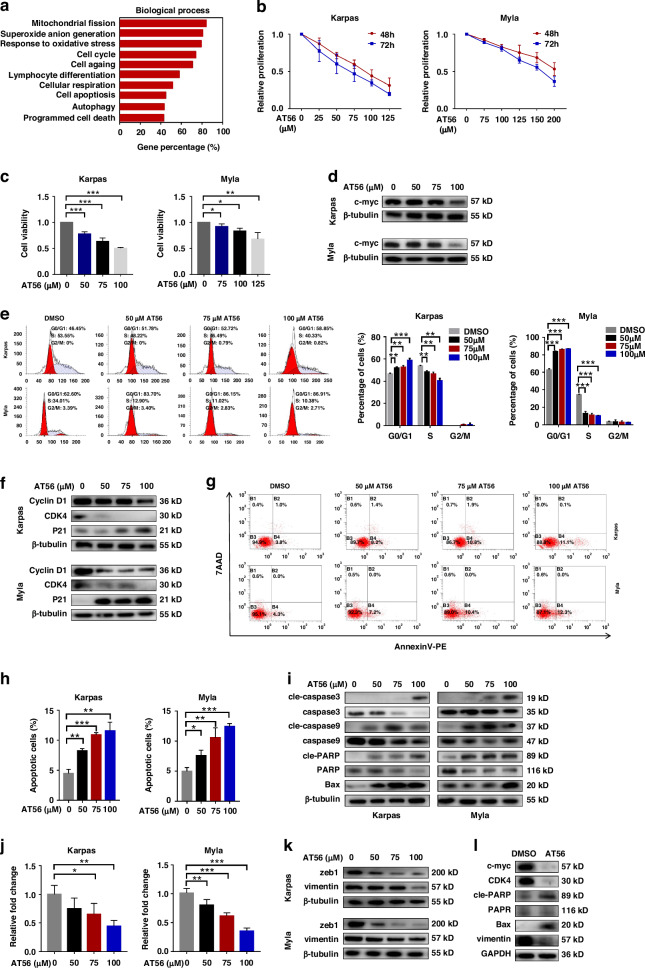
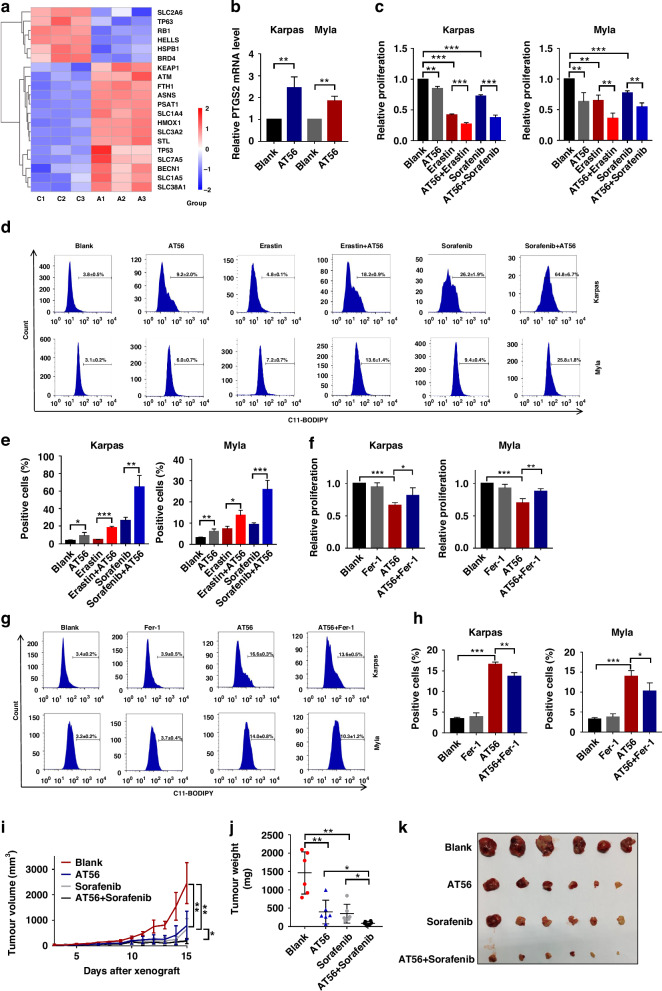
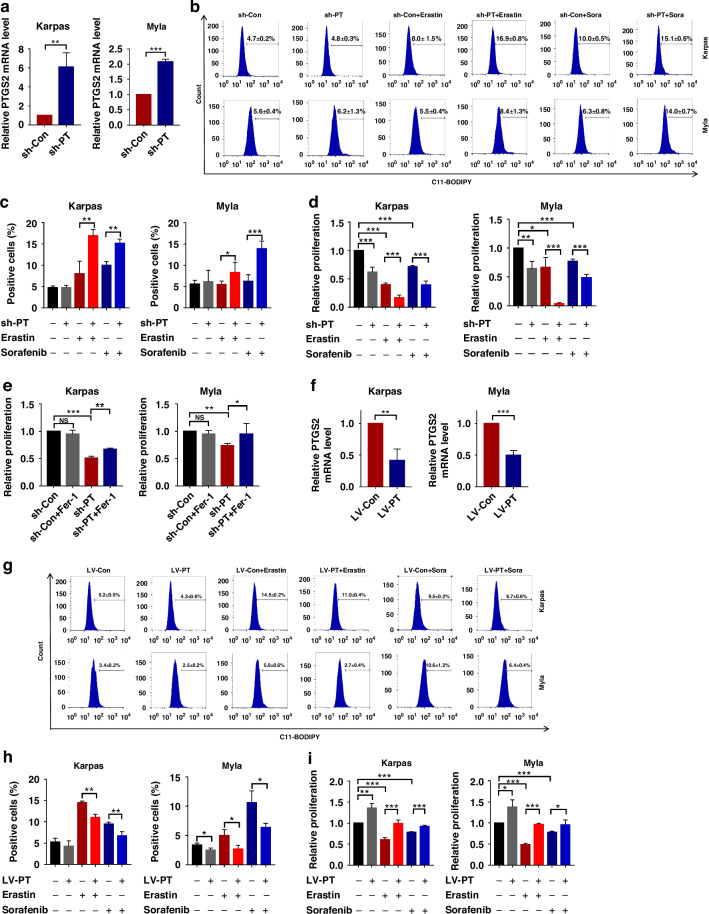
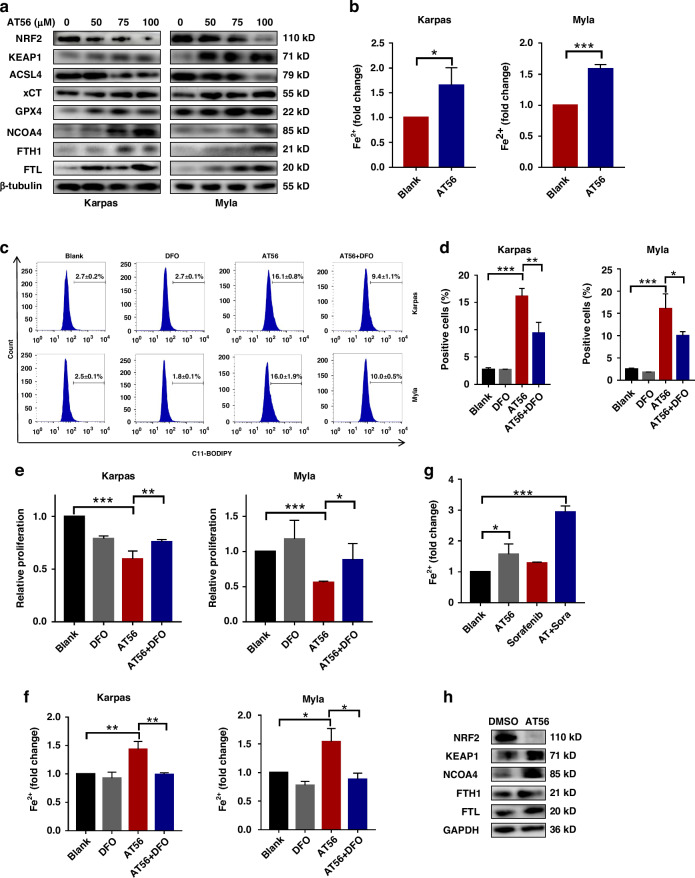
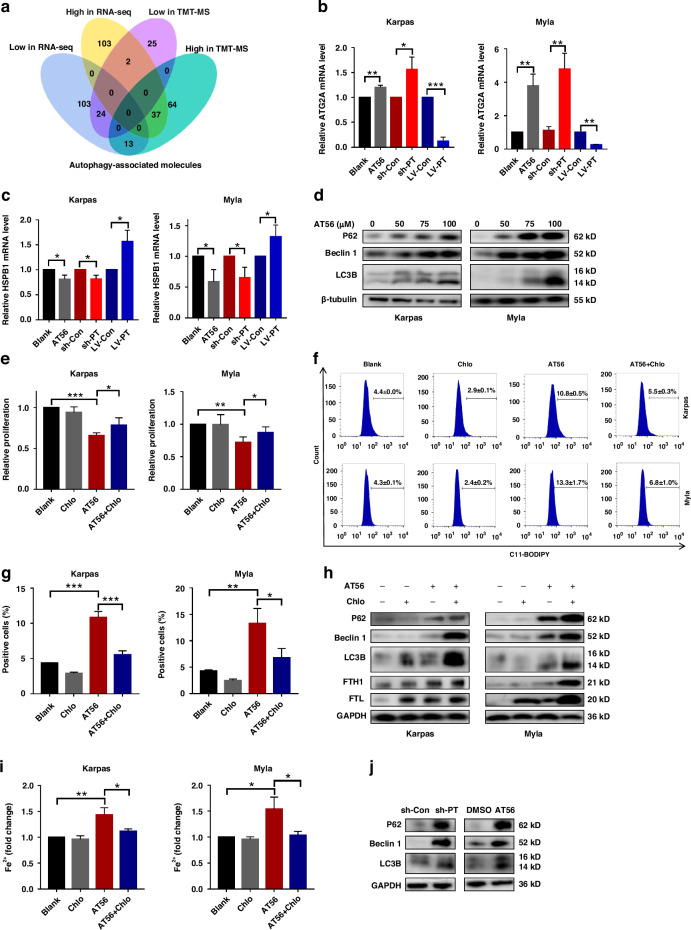
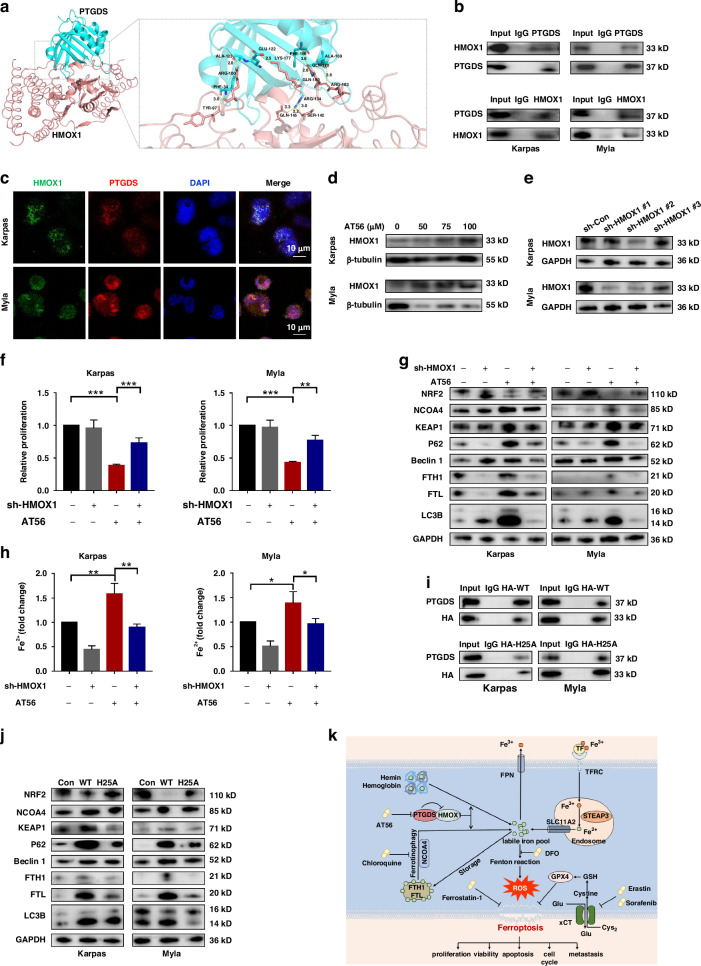
Results: High expression of prostaglandin D2 synthase (PTGDS) was closely associated with poor prognosis of PTCL patients. PTGDS knockdown and AT56 treatment significantly inhibited the progression of PTCL through regulating cell viability, proliferation, apoptosis, cell cycle and invasion in vitro and in vivo. We further revealed that targeting PTGDS promoted ferroptosis process and enhanced the sensitivity of PTCL cells to ferroptosis inducers Sorafenib in vitro and in vivo. Mechanically, PTGDS interacted with heme-degrading enzymes HMOX1, and targeting PTGDS increased the level of iron and induced ferroptosis in PTCL through promoting HMOX1-mediated heme catabolism and ferritin autophagy process. Through the construction of H25A mutation, the specific gene site of HMOX1 corresponding to its role was identified.

Conclusions: Taken together, our findings firstly identified that targeting PTGDS promotes the ferroptosis in PTCL through regulating HMOX1-mediated iron metabolism, and highlighted novel therapeutic strategies to improve the efficacy of ferroptosis-targeted therapy in PTCL patients.


Conflict of interest statement

Competing interests: The authors declare no competing interests. Ethics approval and consent to participate: This study was approved by the Medical Ethical Committee of Shandong Provincial Hospital (SZRJJ:NO.2022-123) and written informed consent in accordance with the Declaration of Helsinki was obtained from each patient. All animal experiments were approved by Animal Care and Research Advisory Committee of Shandong Provincial Hospital (NO.SD NSFC 2023-0185). All methods were performed in accordance with its relevant guidelines and regulations.

Figures

Fig. 1
Fig. 1. High expression of PTGDS was associated with tumor progression of PTCL.
a The expression of PTGDS mRNA in tissue from PTCL patients was higher than that in normal T cells based on Oncomine database. b Representative pictures of immunohistochemical staining from PTCL tissue and control sample. Bar = 40 μm. c Statistic analysis showed the increased expression of PTGDS protein in PTCL tissue (n = 159) in comparison with control samples (n = 38). d Results of western blotting showed that the expression level of PTGDS protein was higher in PTCL cell lines than that in normal T cells. e IHC score of PTGDS was found to be associated with clinical features in PTCL patients. f, g Kaplan–Meier survival analysis revealed that the positive expression of PTGDS was associated with worse OS and PFS in PTCL patients. Data are shown as the mean ± SD. ***p < 0.001.
Fig. 2
Fig. 2. Knockdown of PTGDS expression inhibited tumor growth of PTCL cells in vitro and in vivo.
a Western blotting was performed to verify the transfection efficiency. b Results of CCK8 assay at 48 h showed that PTGDS overexpression increased the proliferation of PTCL cells and PTGDS knockdown decreased it. c, d PTGDS knockdown inhibited the cell viability and the expression of c-myc in PTCL cells at 36 h. eg Compared with sh-Control group, the growth rate, weight, volume and bioluminescence of tumor in mouse model were lower in sh-PTGDS group (n = 5 per group). hj PTGDS knockdown induced cell cycle arrest at the G0/G1 phase, decreased the expression of CDK4, and increased the expression of CDK inhibitors P21 and P27 in PTCL cells at 36 h. km PTCL cells with PTGDS knockdown displayed higher apoptosis rate, increased expression of Bax and the cleaved forms of caspase-3, caspase-9 and PARP at 36 h. no PTGDS knockdown inhibited cell invasion and the expression of zeb1 and vimentin in PTCL cells at 36 h. p PTGDS knockdown regulated the expression of important proteins in tumor tissue from mouse model. Data are shown as the mean ± SD. *p < 0.05; **p < 0.01; ***p < 0.001.
Fig. 3
Fig. 3. PTGDS inhibitor AT56 exerted significant anti-tumor effects in PTCL.
a RNA-seq and GO analysis showed the association between PTGDS expression and tumor biology in PTCL. b, c AT56 inhibited the proliferation and viability of PTCL cells in a dose-dependent manner at 48 h and 72 h. d AT56 decreased the expression of c-myc in PTCL cells at 36 h. e, f PTCL cells treated with AT56 for 36 h displayed dose-dependently cell cycle arrest at G0/G1 phase, the decreased expression of CDK4 and Cyclin D1 and increased expression of P21. gi AT56 treatment for 36 h significantly increased the apoptosis rate and the expression of apoptosis-associated proteins in PTCL cells, with concentration dependence. j, k Inhibited cell invasion and decreased expression of zeb1 and vimentin were found in PTCL cells treated with AT56 for 36 h. l AT56 treatment regulated the expression of important proteins in tumor tissue from mouse model. Data are shown as the mean ± SD. *p < 0.05; **p < 0.01; ***p < 0.001.
Fig. 4
Fig. 4. AT56 treatment promoted the ferroptosis process in PTCL cells.
a Analysis of differentially expressed proteins based on TMT-mass spectrometry showed the potential regulatory role of AT56 treatment on ferroptosis in PTCL. b AT56 treatment for 36 h increased the expression of PTGS2 in PTCL cells, classic biomarker of ferroptosis. c AT56 enhanced the inhibitory effect of Erastin and Sorafenib on cell proliferation at 36 h. d, e AT56 treatment for 36 h significantly promoted the Erastin- and Sorafenib-induced accumulation of lipid ROS. fh Fer-1 treatment for 36 h partly reversed AT56-induced cell proliferation inhibition and lipid ROS accumulation in PTCL cells. ik The combination of AT56 and Sorafenib significantly inhibited tumor growth in PTCL mouse model. Data are shown as the mean ± SD. *p < 0.05; **p < 0.01; ***p < 0.001.
Fig. 5
Fig. 5. Targeting PTGDS promoted the ferroptosis process in PTCL cells.
a The expression of PTGS2 mRNA was increased in PTCL cells with PTGDS knockdown at 36 h. b, c PTGDS knockdown enhanced the promoting effect of Erastin and Sorafenib on lipid ROS accumulation at 36 h. d PTGDS knockdown promoted the inhibitory effect of Erastin and Sorafenib on cell proliferation at 36 h. e Fer-1 treatment reversed the proliferation inhibition induced by PTGDS knockdown at 36 h. f PTGDS overexpression decreased the expression of PTGS2 mRNA at 48 h. gi PTGDS overexpression partly reversed the effect of Erastin and Sorafenib on lipid ROS accumulation and proliferation inhibition in PTCL cells at 48 h. Data are shown as the mean ± SD. *p < 0.05; **p < 0.01; ***p < 0.001.
Fig. 6
Fig. 6. Targeting PTGDS promoted ferroptosis process through regulating iron metabolism in PTCL cells.
a Western blotting results showed the expression level of ferroptosis-associated proteins in PTCL cells treated with AT56 at 36 h. b AT56 treatment for 36 h increased the level of Fe2+ in PTCL cells. c, d The increased accumulation of lipid ROS caused by AT56 was partly reversed by DFO in PTCL cells at 36 h. e DFO treatment for 48 h partly reversed the proliferation inhibitory role of AT56 in PTCL cells. f The AT56-induced accumulation of Fe2+ was reversed by DFO treatment for 36 h in PTCL cells. g The level of Fe2+ was higher in tumor tissue from mice receiving AT56 and Sorafenib. h Western blotting results showed the expression level of ferroptosis-associated proteins in tumor tissue from mouse model. Data are shown as the mean ± SD. *p < 0.05; **p < 0.01; ***p < 0.001.
Fig. 7
Fig. 7. Targeting PTGDS promoted iron accumulation and ferroptosis through inducing ferritin autophagy in PTCL.
a Venn diagram showed the overlap between up- and down-regulated autophagy-associated molecules in RNA-seq and TMT-mass spectrometry. There were 61 (low, n = 24; high, n = 37) molecules with consistent expression change trend in RNA-seq and TMT-mass spectrometry. b, c The expression level of ATG2A and HSPB1 was regulated by AT56 treatment, PTGDS knockdown and overexpression at 36 h. d AT56 treatment for 36 h increased the expression of P62, Beclin 1 and LC3B in PTCL cells. e Chloroquine treatment for 48 h partly reversed the inhibitory effects of AT56 on the proliferation of PTCL cells. f, g The promoting role of AT56 on lipid ROS accumulation was partly reversed by chloroquine treatment for 36 h. h Chloroquine enhanced the role of AT56 on the expression of autophagy- and iron metabolism-associated proteins at 36 h. i The accumulation of Fe2+ caused by AT56 was reversed by chloroquine treatment for 36 h in PTCL cells. j Western blotting results showed the expression of autophagy-associated proteins in mouse model. Data are shown as the mean ± SD. *p < 0.05; **p < 0.01; ***p < 0.001.
Fig. 8
Fig. 8. PTGDS interacted with HMOX1 to regulate iron metabolism and ferroptosis process in PTCL.
a Molecular docking pattern diagrams of PTGDS protein (blue) and HMOX1 protein (red). Confidence score = 0.8. b, c The colocalization and interaction between PTGDS and HMOX1 were verified in PTCL cells through confocal immunofluorescent and Co-IP. Bar = 10 μm. d AT56 treatment for 36 h increased the expression level of HMOX1 in PTCL cells. e Western blotting results verified the transfection efficiency. f HMOX1 knockdown reversed the inhibitory role of AT56 on cell proliferation at 48 h. g, h The regulatory role of AT56 on the expression of ferroptosis- and autophagy-associated proteins, and Fe2+ accumulation was reversed by HMOX1 knockdown at 36 h. i Co-IP assay showed the interaction between PTGDS protein and HMOX1 protein with wild type and H25A mutation. j H25A mutation reversed the regulatory role of HMOX1 on the expression of ferroptosis- and autophagy-associated proteins. k Mechanism diagram summarized that PTGDS promotes the development of PTCL through regulating HMOX1-mediated iron metabolism and ferroptosis process, and targeting PTGDS could exert synergistic anti-tumor effects with ferroptosis inducers Erastin and Sorafenib in PTCL. Data are shown as the mean ± SD. *p < 0.05; **p < 0.01; ***p < 0.001.

Similar articles

Cited by

References

    1. Siegel RL, Miller KD, Wagle NS, Jemal A. Cancer statistics, 2023. CA: a cancer J Clin. 2023;73:17–48. - PubMed
    1. Mulvey E, Ruan J. Biomarker-driven management strategies for peripheral T cell lymphoma. J Hematol Oncol. 2020;13:59. - PMC - PubMed
    1. Zhang P, Zhang M. Epigenetic alterations and advancement of treatment in peripheral T-cell lymphoma. Clin Epigenet. 2020;12:169. - PMC - PubMed
    1. Tang D, Chen X, Kang R, Kroemer G. Ferroptosis: molecular mechanisms and health implications. Cell Res. 2021;31:107–25. - PMC - PubMed
    1. Jiang X, Stockwell BR, Conrad M. Ferroptosis: mechanisms, biology and role in disease. Nat Rev Mol Cell Biol. 2021;22:266–82. - PMC - PubMed

MeSH terms