. 2024 Dec 20;22(1):1119.
doi: 10.1186/s12967-024-05865-6.

ABL1‒YAP1 axis in intestinal stem cell activated by deoxycholic acid contributes to hepatic steatosis

Affiliations

ABL1‒YAP1 axis in intestinal stem cell activated by deoxycholic acid contributes to hepatic steatosis

Tiancheng Mao et al. J Transl Med. .

Abstract

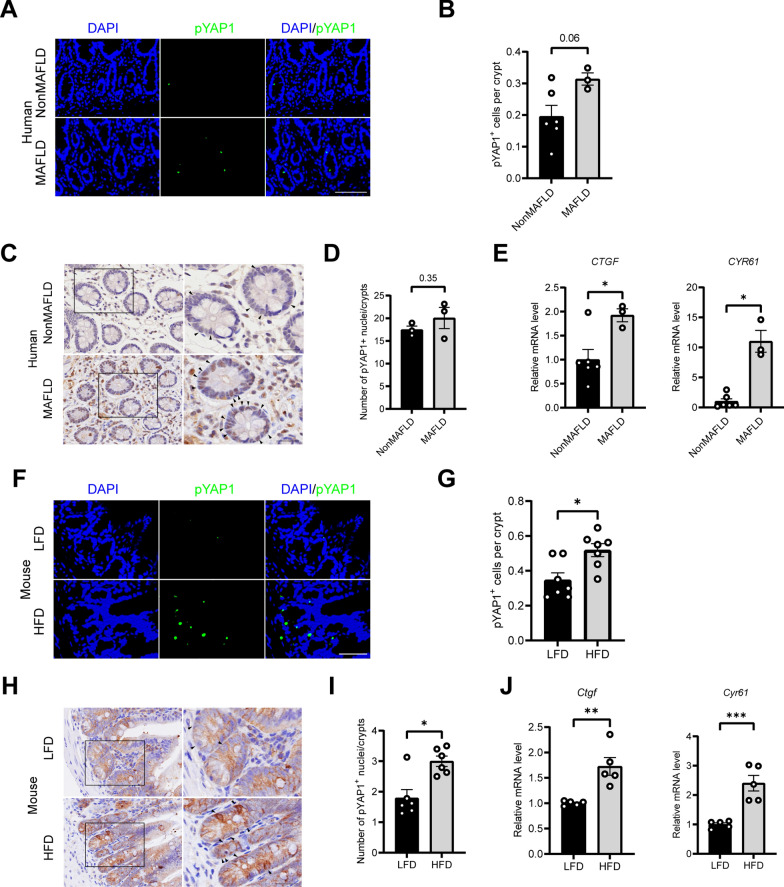
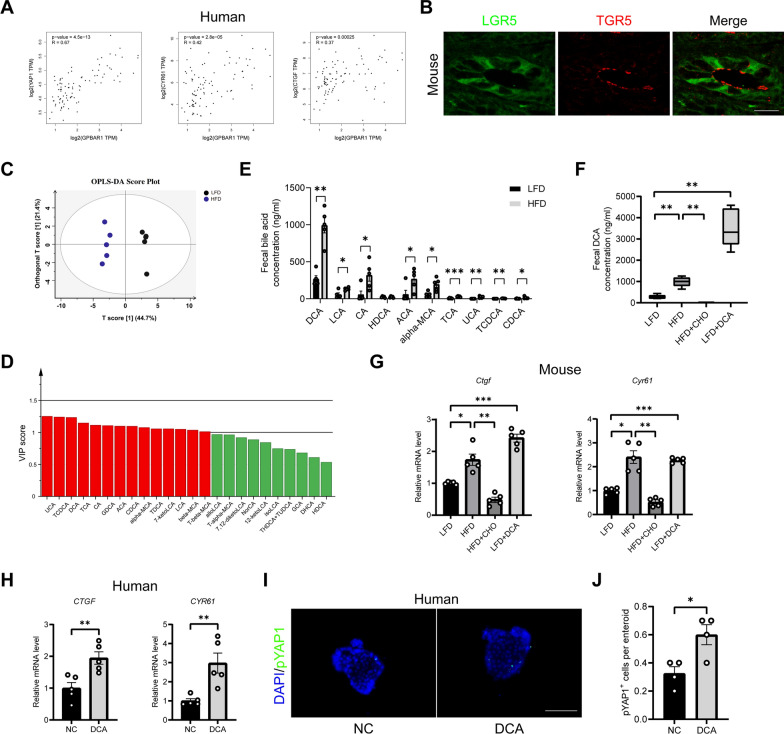
Background: Yes-associated protein 1 (YAP1) regulates the survival, proliferation, and stemness of cells, and contributes to the development of metabolic dysfunction associated fatty liver disease (MAFLD). However, the regulatory role of intestinal YAP1 in MAFLD still remains unclear.

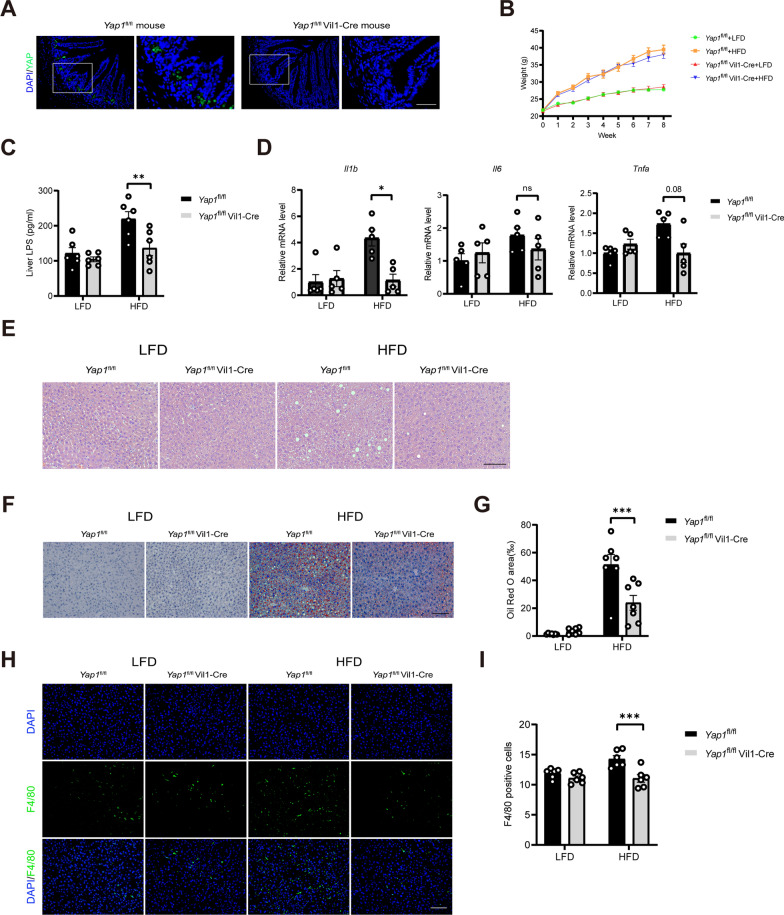
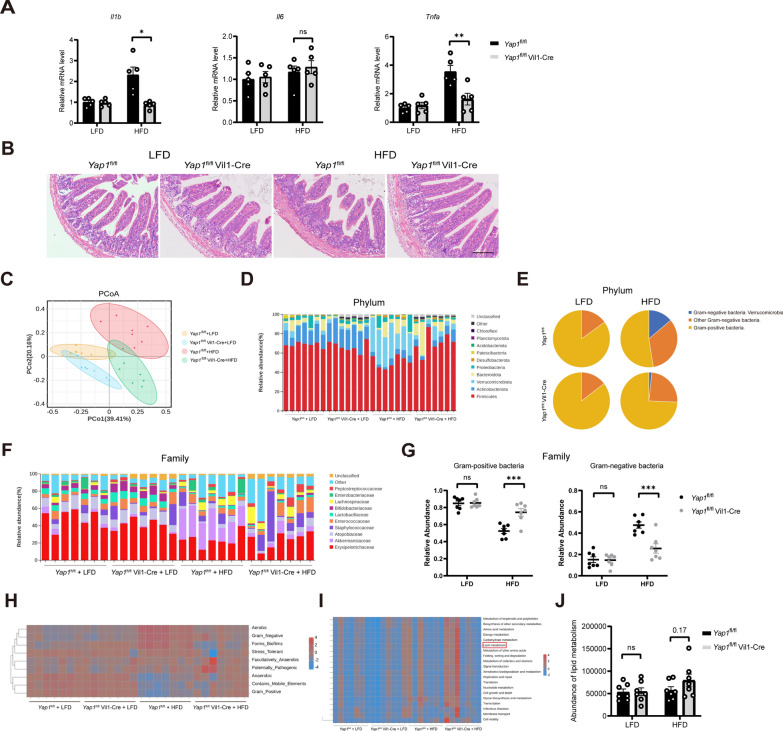
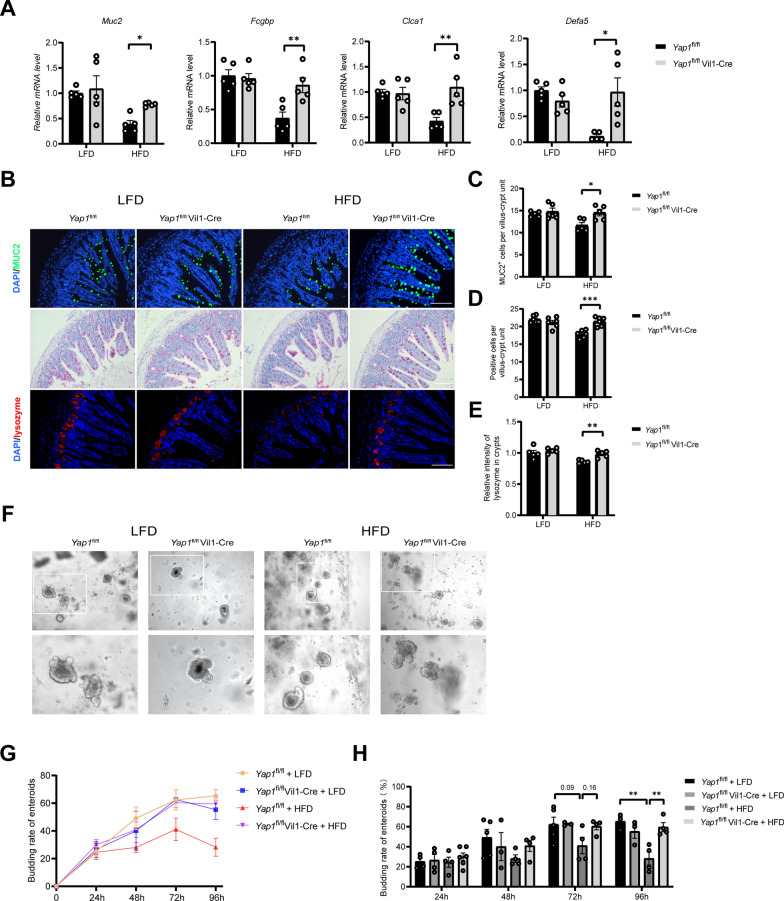
Methods: Terminal ileal specimens were used to compare intestinal YAP1 activation in patients with and without MAFLD. Mice targeted for knocking out YAP1 in the intestinal epithelium were fed a high-fat diet (HFD) for 8 consecutive weeks. In a separate group, the mice were fed an HFD supplemented with the bile acid binder cholestyramine (CHO) or a low-fat diet with deoxycholic acid (DCA). Immunofluorescence, Immunohistochemistry, Western blot, RT-qPCR, ELISA, 16S rDNA sequencing, tissue and enteroid culture techniques were used to evaluate the effects of an HFD or DCA on the gut‒liver axis in mice or humans.

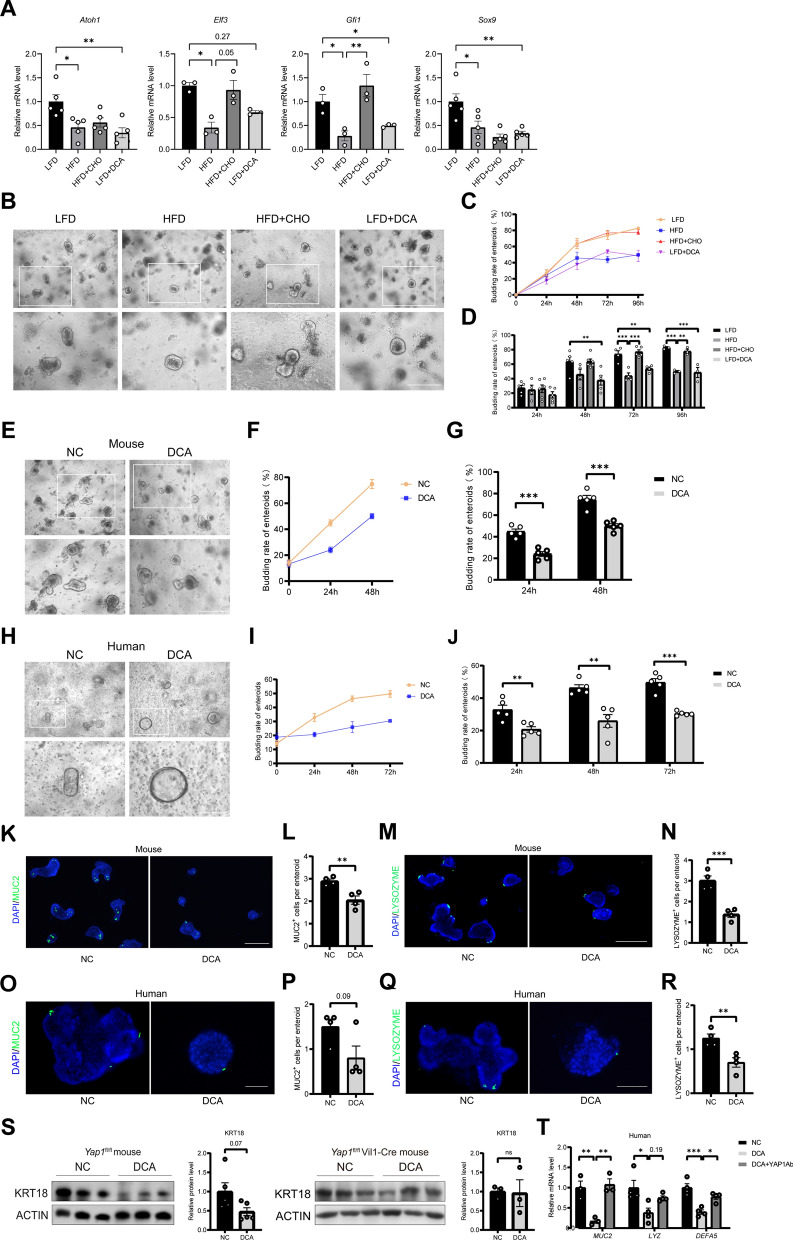
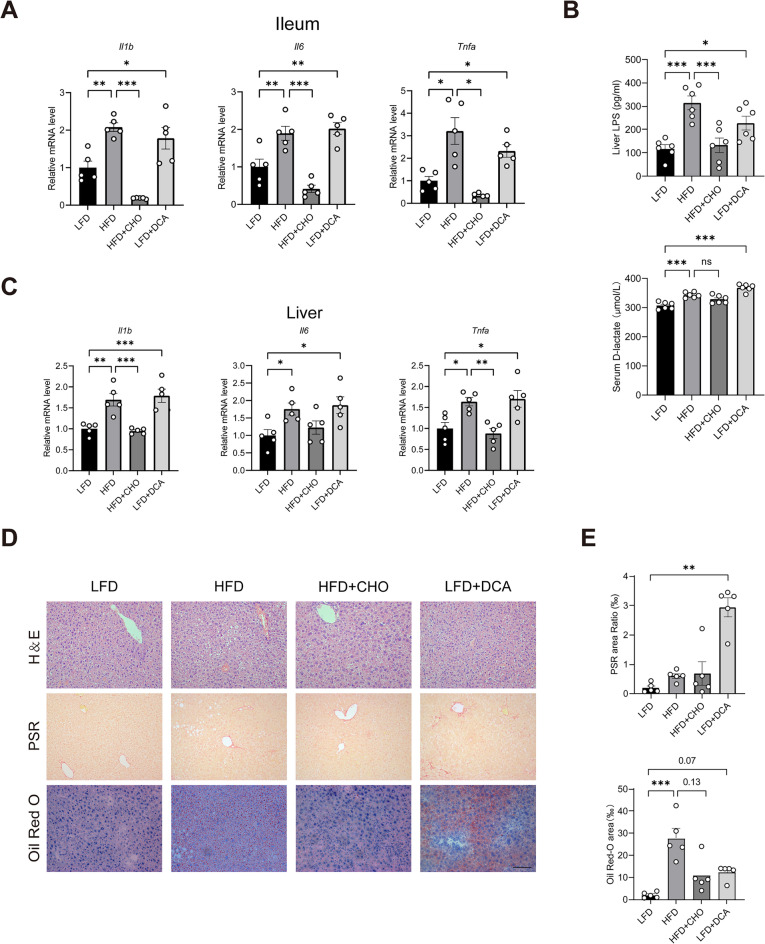
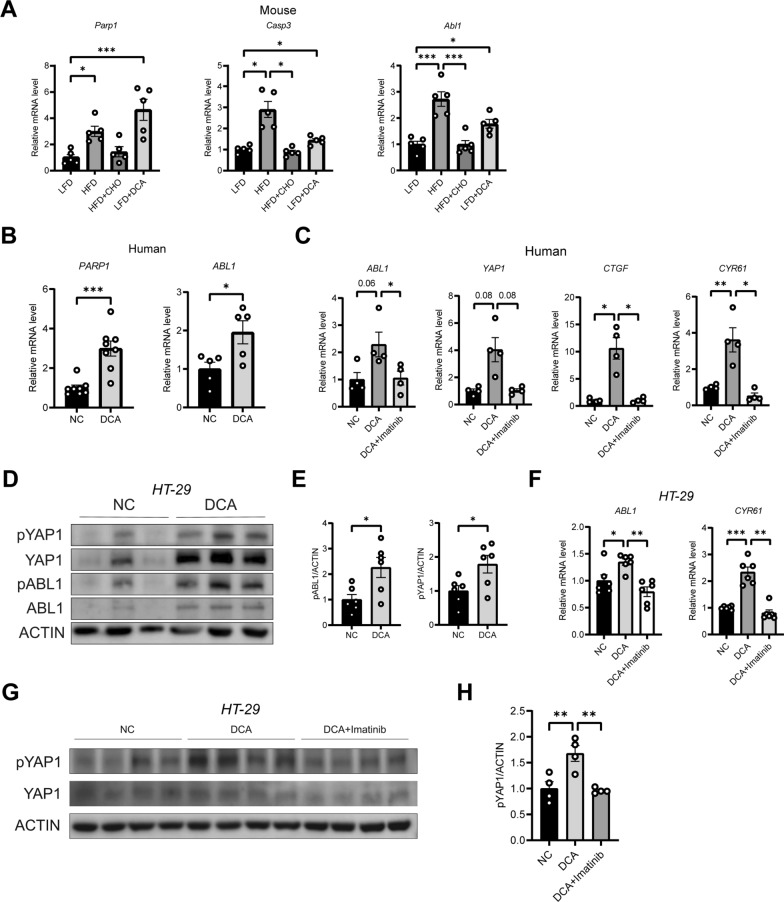
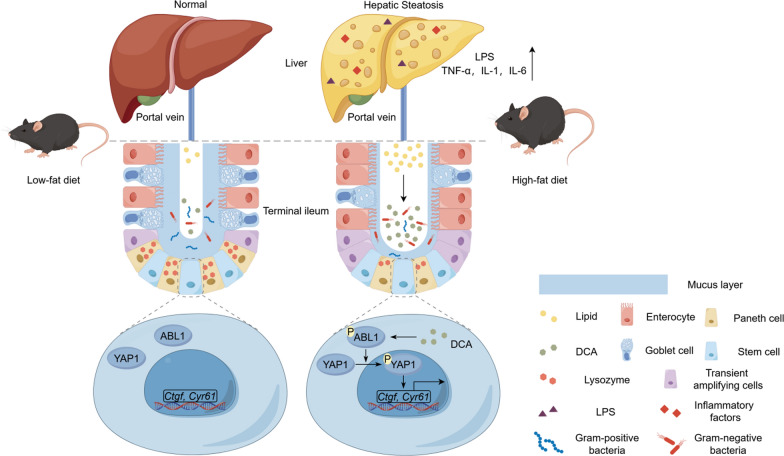
Results: Intestinal YAP1 was activated in both humans with MAFLD and mice fed an HFD. In in vivo studies, YAP1 knockout in intestinal epithelial cells of mice alleviated the hepatic steatosis induced by an HFD, and mitigated the adverse effects of HFD on the gut‒liver axis, including the upregulation of lipopolysaccharide (LPS) and inflammation levels, enrichment of intestinal Gram-negative bacteria, and inhibition of intestinal stem cell (ISC) differentiation into the goblet and Paneth cells. High-fat feeding (HFF) produced high concentrations of DCA. The consumption of DCA mimics these HFF-induced changes, and is accompanied by the activation of Abelson tyrosine-protein kinase 1 (ABL1) and its direct substrate, YAP1, in the terminal ileum. In vitro studies further confirmed that DCA upregulated the tyrosine phosphorylation of YAP1Y357 in ISC by activating ABL1, which inhibited the differentiation of ISCs into secretory cells.

Conclusions: Our findings reveal that the activation of the ABL1‒YAP1 axis in ISCs by DCA contributes to hepatic steatosis through the gut‒liver axis, which may provide a potential intestinal therapeutic target for MAFLD.

Keywords: Deoxycholic acid; Hepatic steatosis; High-fat diet; Intestinal stem cell; Yes-associated protein 1.


Conflict of interest statement

Declarations. Ethics approval and consent to participate: All animal procedures were approved by the Institutional Animal Care and Use Committee of the Shanghai General Hospital (protocol code 2021SQ205, 1 Match 2021). The human study was approved by the Ethics Committee of the Shanghai General Hospital (approval ID 20240226025226875). The study protocol adhered to the ethical principles of medical research involving human subjects as outlined in the 2013 Helsinki Declaration and the 2018 Istanbul Declaration. Consent for publication: Not applicable. Competing interests: The authors declare that they have no conflict of interest or financial conflicts to disclose.

Figures

Fig. 1
Fig. 1
YAP1 is activated in HFD-fed mice and MAFLD patients. A Representative micrographs of immunofluorescence staining for pYAP1 in the crypt region of the ileum tissue from humans with and without MAFLD. Scale bars: 100 μm. B Quantitative analysis of A (n = 6 or 3). C, D Representative micrographs of immunohistochemistry results for nuclear pYAP1+ cells in the ileal crypts of the NonMAFLD and MAFLD patients and the quantitative analysis (n = 3). The arrows point to nuclear pYAP1+ cells. Scale bars: 25 μm. E mRNA expression of CTGF and CYR61 in the ileum tissues of humans with and without MAFLD (n = 6 or 3). F Representative micrographs of immunofluorescence staining for pYAP1 in the crypt region of the ileum tissue in mice. Scale bars: 50 μm. G Quantitative analysis of the data in F (n = 7). H, I Representative micrographs of immunohistochemistry results for nuclear pYAP1+ cells in the ileal crypts of the LFD- and HFD-fed mice and the quantitative analysis (n = 6). The arrows point to nuclei of pYAP1+ cells. Scale bars: 25 μm. J mRNA expression of Ctgf and Cyr61 in mouse ileum tissue (n = 5). LFD, low-fat diet; HFD, high-fat diet; pYAP1, phosphorylated YAP1; NonMAFLD, without MAFLD. *P < 0.05, **P < 0.01, ***P < 0.001
Fig. 2
Fig. 2
An intestinal YAP1 knockout improves hepatic inflammation and steatosis in the HFD-fed mice. A Representative micrographs of immunofluorescence staining for YAP1 in the intestines of the Yap1fl/fl and Yap1fl/fl Vil1-Cre mice. Scale bars: 50 μm. B Body weight changes of the Yap1fl/fl and Yap1fl/fl Vil1-Cre mice in 8 weeks (n = 6). C LPS concentration in the liver tissue of the Yap1fl/fl and Yap1fl/fl Vil1-Cre mice (n = 6). D The mRNA expression of IL-1β, IL-6 and TNF-α in liver tissue of Yap1fl/fl and Yap1fl/fl Vil1-Cre mice (n = 5). E Representative micrographs of H&E staining in liver tissues from the Yap1fl/fl and Yap1fl/fl Vil1-Cre mice. Scale bars: 100 μm. F Representative micrographs of Oil Red O-stained liver tissue from Yap1fl/fl and Yap1fl/fl Vil1-Cre mice. Scale bars: 100 μm. G Quantitative analysis of F (n = 7). H Representative micrographs of immunofluorescence staining for F4/80 in the liver tissues of the Yap1fl/fl and Yap1fl/fl Vil1-Cre mice. Scale bars: 100 μm. I Quantitative analysis of the data in H (n = 6). LFD, low-fat diet; HFD, high-fat diet. *P < 0.05, **P < 0.01, ***P < 0.001, ns: not significant
Fig. 3
Fig. 3
An intestinal YAP1 knockout improves intestinal inflammation and dysbiosis in the HFD-fed mice. A The mRNA expression of IL-1β, IL-6 and TNF-α in Yap1fl/fl and Yap1fl/fl Vil1-Cre mice ileum tissue (n = 5). B Representative micrographs of H&E staining of ileal tissues from the Yap1fl/fl and Yap1fl/fl Vil1-Cre mice. Scale bars: 100 μm. C Principal coordinate analysis illustrates the characteristics of the changes in the gut microbiota among the Yap1fl/fl and Yap1fl/fl Vil1-Cre mice subjected to LFD and HFD respectively (n = 7). D Relative abundance of intestinal bacteria at the phylum level in Yap1fl/fl and Yap1fl/fl Vil1-Cre mice (n = 7). E Proportion of Gram-negative and Gram-positive bacteria in the gut microbiota of the intestinal microflora of the Yap1fl/fl and Yap1fl/fl Vil1-Cre mice at the phylum level (n = 7). F Relative abundance of intestinal bacteria at the family level in Yap1fl/fl and Yap1fl/fl Vil1-Cre mice (n = 7). G Relative abundance of Gram-positive bacteria and Gram-negative bacteria in the Yap1fl/fl and Yap1fl/fl Vil1-cre mice (n = 7). H Bacterial phenotypic analysis based on BugBase (n = 7). I Functional analysis based on PICRUSt2 (n = 7). J Abundance of lipid metabolism pathway in the Yap1fl/fl and the Yap1fl/fl Vil1-Cre mice (n = 7). LFD, low-fat diet; HFD, high-fat diet. *P < 0.05, **P < 0.01, ***P < 0.001, ns: no significant
Fig. 4
Fig. 4
An intestinal YAP1 knockout improves ISC differentiation in HFD-fed mice. A The mRNA levels of Muc2, Fcgbp, Clca1 and Defa5 in ileum tissue of Yap1fl/fl and Yap1fl/fl Vil1-Cre mice (n = 5). B Representative micrographs depicting immunofluorescence staining for MUC2 and lysozyme in mouse ileum tissue, as well as Periodic acid–Schiff (PAS) staining in mouse ileum tissue; Scale bars: 100 μm. CE Quantitative analysis of B (n = 5 or 6). F Representative micrographs of enteroids in Yap1fl/fl and Yap1fl/fl Vil1-Cre mice fed LFD or HFD after 96-h culture. Scale bars: 100 μm. G Line graph of changes in enteroid budding rates at 24, 48, 72, and 96 h (n = 3–6). H Comparison of enteroid budding rates at 24, 48, 72, and 96 h (n = 3–6). LFD, low-fat diet; HFD, high-fat diet. *P < 0.05, **P < 0.01, ***P < 0.001
Fig. 5
Fig. 5
High concentrations of DCA activate intestinal YAP1 signaling. A Correlation analysis of TGR5 with YAP1 and its target genes in the human intestine using data from the GTEx database. B Representative micrographs of immunofluorescence staining for LGR5 and TGR5 showed colocalization. Scale bars: 20 μm. C Orthogonal partial least squares discriminant analysis (OPLS-DA) of faecal bile acid in LFD and HFD groups. D Variable importance in the projection (VIP) value (red: VIP > 1). E Faecal individual bile acid concentration in LFD and HFD groups (n = 5). F Faecal DCA concentrations in LFD, HFD, HFD + CHO, and LFD + DCA groups (n = 5). G The mRNA expression levels of Ctgf and Cyr61 in mouse ileum tissue (n = 5). H The mRNA expression levels of CTGF, and CYR61 in human ileum tissue treated with 100 μM DCA for 24 h (n = 5). I Representative micrographs of immunofluorescence staining for pYAP1 in human ileal enteroids treated with or without 100 μM DCA. Scale bars: 100 μm. J Quantitative analysis of I (n = 4). DCA, deoxycholic acid; LFD, low-fat diet; HFD, high-fat diet; CHO, cholestyramine. *P < 0.05, **P < 0.01, ***P < 0.001
Fig. 6
Fig. 6
High concentrations of DCA inhibit the ISC differentiation into goblet and Paneth cells, which is prevented by YAP1 antibody. A The mRNA expression levels of Atoh1, Elf3, Gfi1 and Sox9 in mouse ileum tissue (n = 3 or 5). B Representative micrographs of intestinal enteroids in four groups after 96 h of culture in mice. Scale bars: 200 μm. C Line graph of changes in enteroids budding rates at 24, 48, 72 and 96 h (n = 3–6). D Comparison of enteroids budding rates at 24, 48, 72 and 96 h (n = 3–6). E Representative micrographs of mouse intestinal enteroids treated with or without DCA. Scale bars: 200 μm. F Line graph of changes in enteroids budding rates after DCA intervention with 24, 48 h (n = 5). G Comparison of enteroids budding rates after DCA intervention with 24, 48 h (n = 5). H Representative micrographs of human intestinal enteroids treated with or without DCA. Scale bars: 100 μm. I Line graph of changes in human enteroids budding rates after DCA intervention with 24, 48 and 72 h (n = 5). J Comparison of human enteroids budding rates after DCA intervention with 24, 48 and 72 h (n = 5). K Representative micrographs of immunofluorescence staining for MUC2 in mouse intestinal enteroids. Scale bars: 200 μm. L Quantitative analysis of K (n = 4). M Representative micrographs of immunofluorescence staining for lysozyme in mouse intestinal enteroids. Scale bars: 200 μm. N Quantitative analysis of M (n = 4). O Representative micrographs of immunofluorescence staining for MUC2 in human intestinal enteroids. Scale bars: 100 μm. P Quantitative analysis of O (n = 4). Q Representative micrographs of immunofluorescence staining for lysozyme in human intestinal enteroids. Scale bars: 100 μm. R Quantitative analysis of Q (n = 4). S Protein expression of goblet cell marker KRT18 in the terminal ileum of Yap1fl/fl mice and Yap1fl/fl Vil1-Cre mice after 24 h coculture with 100 μM DCA or DMSO (n = 5 or 3). T In vitro culture of human ileal tissue, the mRNA levels of MUC2, LYZ, and DEFA5 were assessed in human ileum tissue with various treatments (n = 3 or 4). DCA, deoxycholic acid; LFD, low-fat diet; HFD, high-fat diet; CHO, cholestyramine. *P < 0.05, **P < 0.01, ***P < 0.001
Fig. 7
Fig. 7
High concentrations of DCA cause liver inflammation and steatosis by disrupting the intestinal barrier. A mRNA expression of IL-1β, IL-6 and TNF-α in mouse ileum tissue (n = 5). B Serum D-lactate concentrations and LPS concentrations in mice liver tissues (n = 6). C mRNA expression of IL-1β, IL-6 and TNF-α in mouse liver tissue (n = 5). D Representative micrographs of haematoxylin‒eosin, picrosirius red and Oil Red histochemical staining. Scale bars: 100 μm. E Quantitative analysis of D (n = 5). Lipopolysaccharide, LPS; LFD, low-fat diet; HFD, high-fat diet; HFD + CHO, HFD + cholestyramine; DCA, deoxycholic acid. *P < 0.05, **P < 0.01, ***P < 0.001
Fig. 8
Fig. 8
High concentrations of DCA activate YAP1 via ABL1. A mRNA expression levels of Parp1, Caspase3, and Abl1 in the ileum tissue of the mice (n = 5). B mRNA expression levels of PARP1 and ABL1 in human ileum tissue treated with 100 μM DCA for 24 h (n = 8 or 5). C Relative mRNA expression of ABL1, YAP1, CTGF, and CYR61 in human ex vivo tissue culture with DCA, or DCA combined with the ABL1 inhibitor Imatinib (n = 4). D Relative protein expressions of pYAP1, YAP1, pABL1, and ABL1 in HT-29 cells treated with or without DCA for 15 min. E Quantitative analysis of D (n = 6). F Relative mRNA expression of ABL1 and CYR61 in HT-29 cells treated with DCA alone, or with DCA combined with the ABL1 inhibitor Imatinib (n = 6). G The relative protein expressions of pYAP1 and YAP1 in HT-29 cells treated with DCA alone, or with DCA combined with the ABL1 inhibitor, Imatinib. H Quantitative analysis of G (n = 4). LFD, low-fat diet; HFD, high-fat diet; HFD + CHO, HFD + cholestyramine; DCA, deoxycholic acid. *P < 0.05, **P < 0.01, ***P < 0.001
Fig. 9
Fig. 9
A schematic depicting the mechanism involving HFD-mediated increase in DCA levels leading to dysregulation of ISC function and hepatic steatosis via ABL1‒YAP pathway

References

    1. Ji J, Wu L, Wei J, Wu J, Guo C. The gut microbiome and ferroptosis in MAFLD. J Clin Transl Hepatol. 2023;11(1):174–87. - PMC - PubMed
    1. Hoyles L, Fernández-Real J-M, Federici M, Serino M, Abbott J, Charpentier J, et al. Molecular phenomics and metagenomics of hepatic steatosis in non-diabetic obese women. Nat Med. 2018;24(7):1070–80. - PMC - PubMed
    1. Bischoff SC, Barbara G, Buurman W, Ockhuizen T, Schulzke J-D, Serino M, et al. Intestinal permeability—a new target for disease prevention and therapy. BMC Gastroenterol. 2014;14:189. - PMC - PubMed
    1. Turner JR. Intestinal mucosal barrier function in health and disease. Nat Rev Immunol. 2009;9(11):799–809. - PubMed
    1. Gehart H, Clevers H. Tales from the crypt: new insights into intestinal stem cells. Nat Rev Gastroenterol Hepatol. 2019;16(1):19–34. - PubMed