. 2024 Dec 20;22(1):1135.
doi: 10.1186/s12967-024-05962-6.

Ubiquitin-specific protease 7 maintains c-Myc stability to support pancreatic cancer glycolysis and tumor growth

Affiliations

Ubiquitin-specific protease 7 maintains c-Myc stability to support pancreatic cancer glycolysis and tumor growth

Jichun Gu et al. J Transl Med. .

Abstract

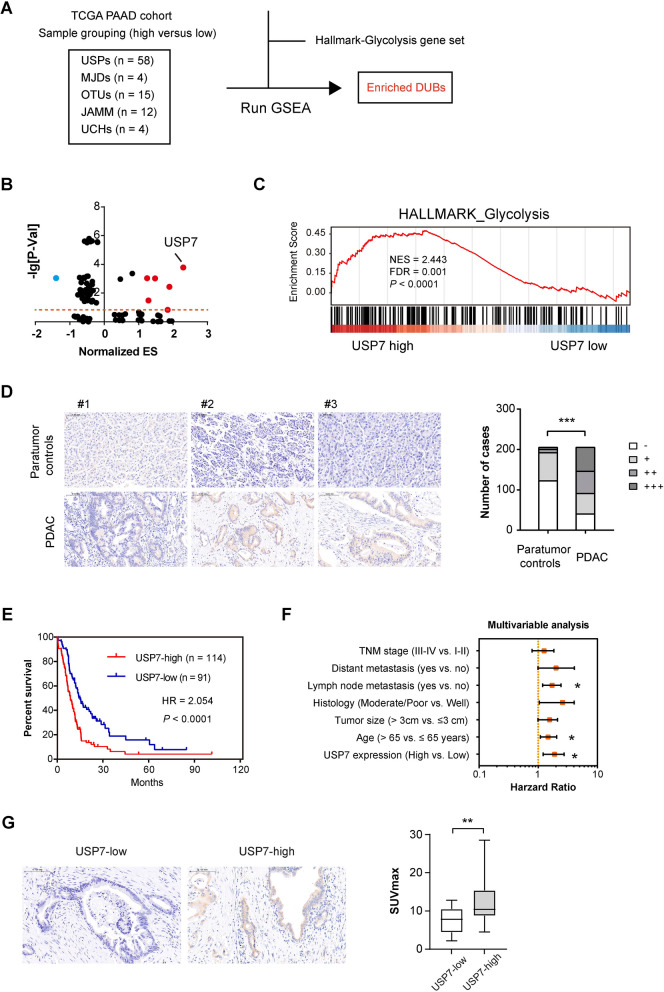
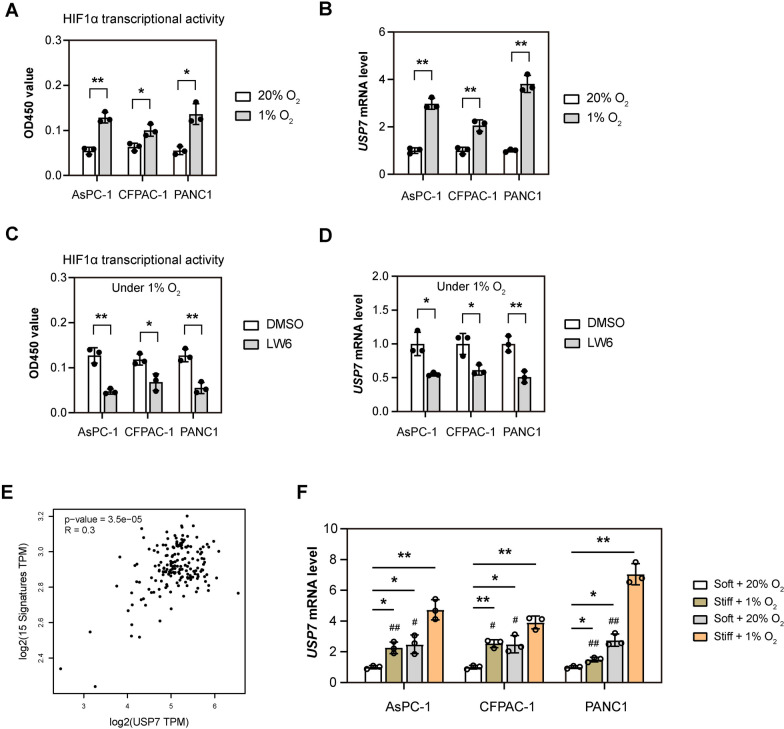
Background: The typical pathological feature of pancreatic ductal adenocarcinoma (PDAC) is a significant increase in stromal reaction, leading to a hypoxic and poorly vascularized tumor microenvironment. Tumor cells undergo metabolic reprogramming, such as the Warburg effect, yet the underlying mechanisms are not fully understood.

Methods: Interference and overexpression experiments were conducted to analyze the in vivo and in vitro effects of USP7 on the growth and glycolysis of tumor cells. Small-molecule inhibitors of USP7 and transgenic mouse models of PDAC were employed to assess the consequences of targeting USP7 in PDAC. The molecular mechanism underlying USP7-induced c-Myc stabilization was determined by RNA sequencing, co-IP and western blot analyses.

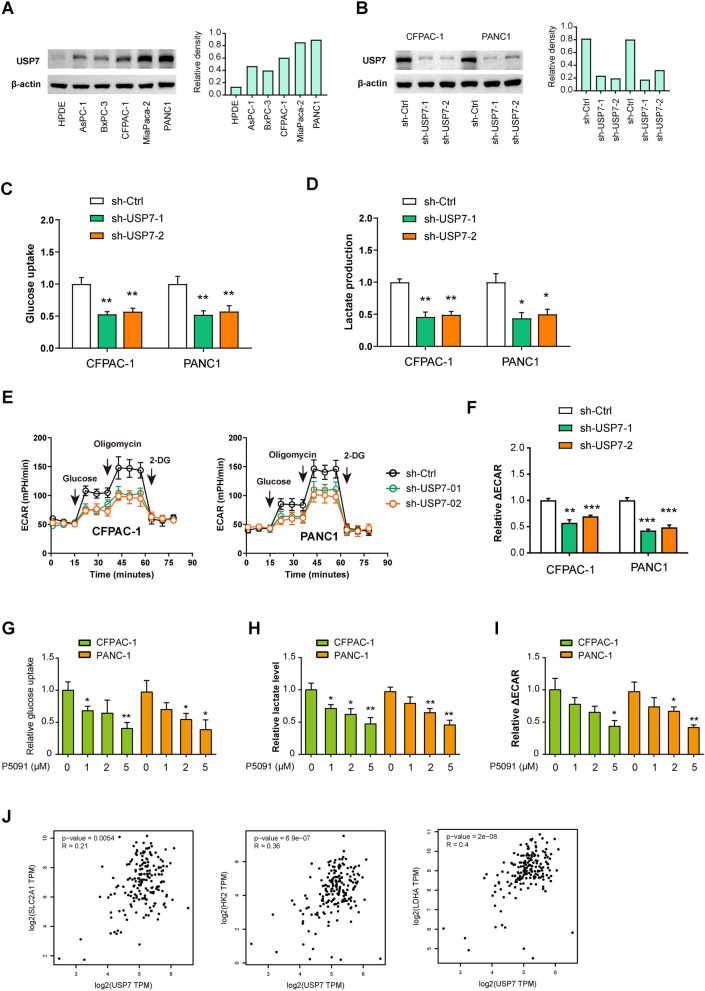
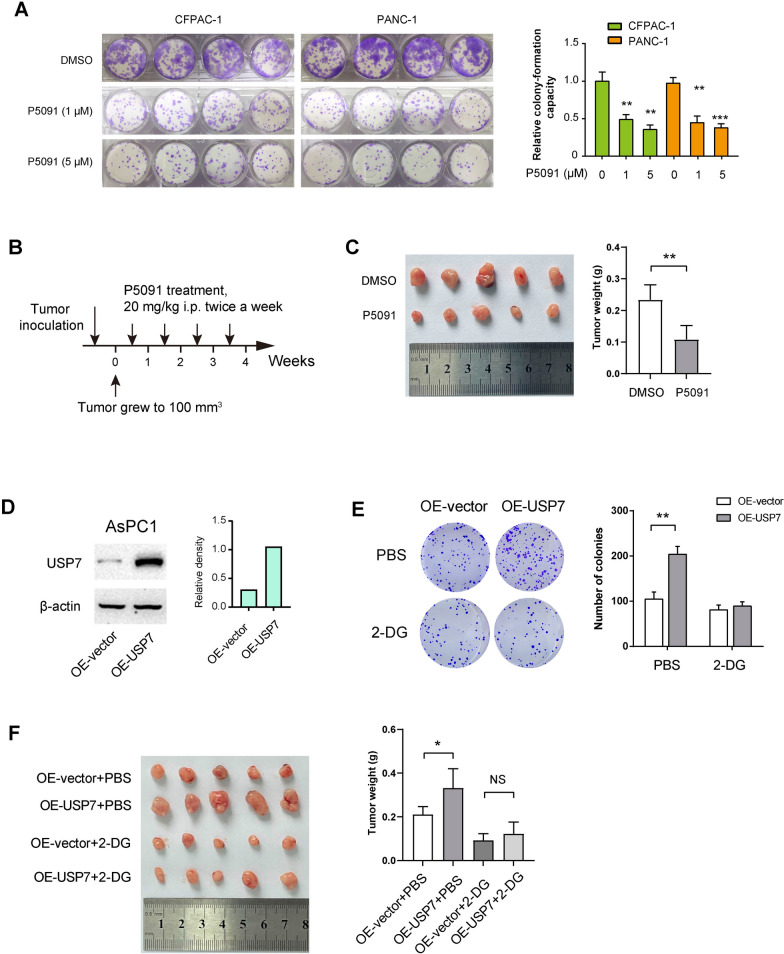
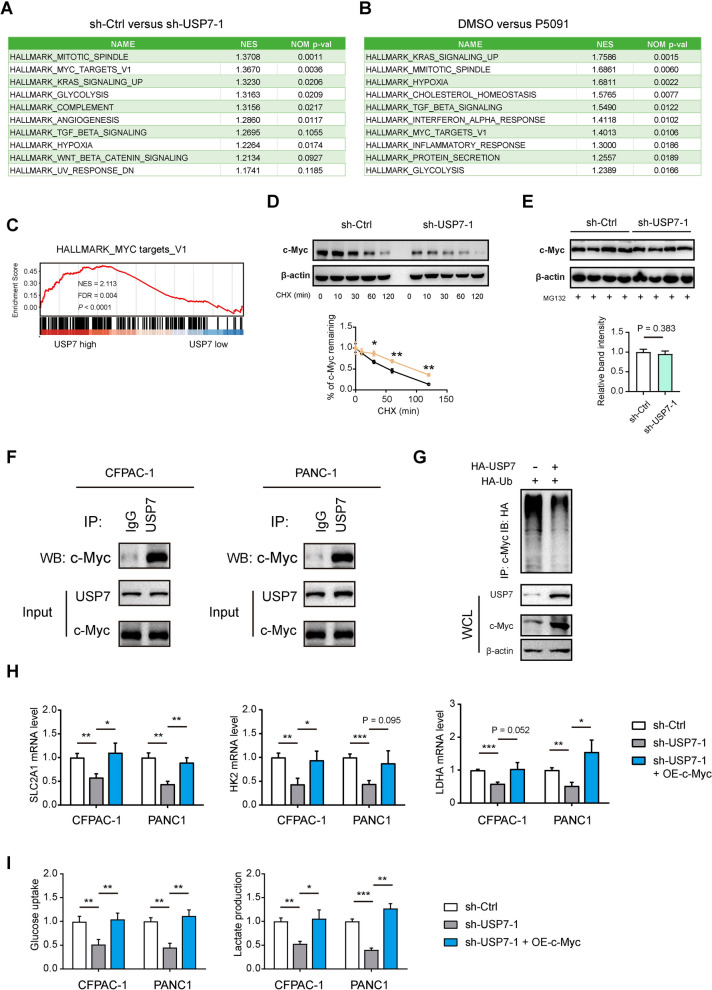
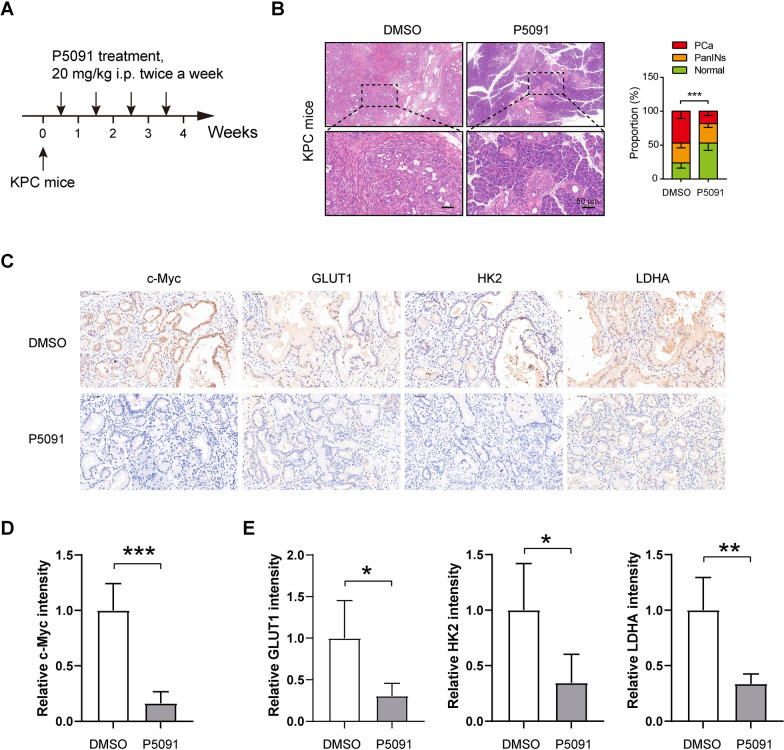
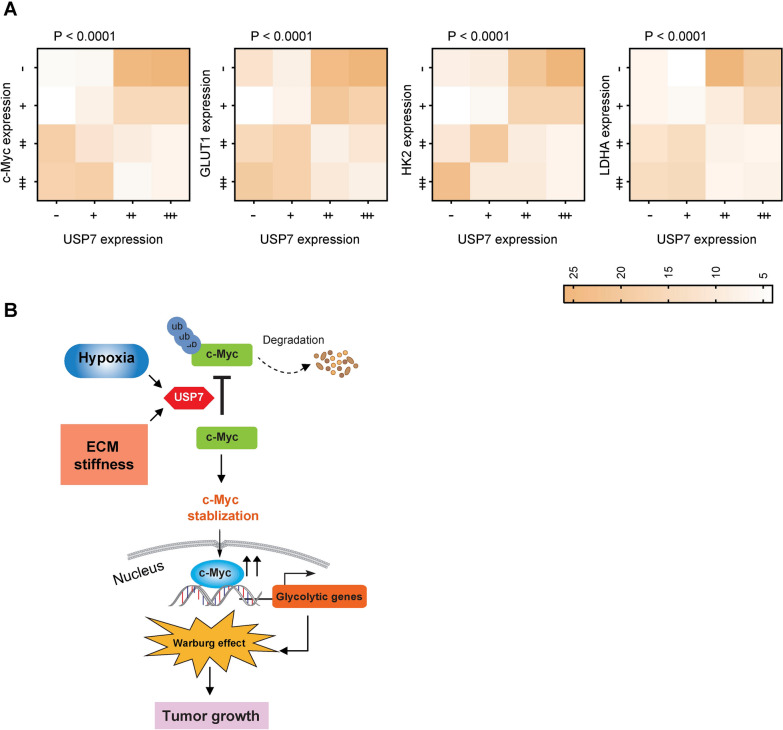
Results: USP7 is abnormally overexpressed in PDAC and predicts a poor prognosis. Hypoxia and extracellular matrix stiffness can induce USP7 expression in PDAC cells. Genetic silencing of USP7 inhibits the glycolytic phenotypes in PDAC cells, while its overexpression has the opposite effect, as demonstrated by glucose uptake, lactate production, and extracellular acidification rate. Importantly, USP7 promotes PDAC tumor growth in a glycolysis-dependent manner. The small-molecule inhibitor P5091 targeting USP7 effectively suppresses the Warburg effect and cell growth in PDAC. In a transgenic mouse model of PDAC, named KPC, P5091 effectively blocks tumor progression. Mechanistically, USP7 interacts with c-Myc, enhancing its stability and expression, which in turn upregulates expression of glycolysis-related genes.

Conclusions: This study sheds light on the molecular mechanisms underlying the Warburg effect in PDAC and unveils USP7 as a potential therapeutic target for improving PDAC treatment.

Keywords: Aerobic glycolysis; Deubiquitinating enzymes; Glucose metabolism; HAUSP.


Conflict of interest statement

Declarations. Ethics approval and consent to participate: This study was approved by the Research Ethics Committee of Huashan Hospital, Fudan University and performed in accordance with the Declaration of Helsinki. All patients involved in this study signed informed consent. All the animal experiments in this study were approved by the Institutional Animal Care and Use Committee of Fudan university. Consent for publication: All authors agree to submit the article for publication. Competing interests: The authors declare that they have no competing interests.

Figures

Fig. 1
Fig. 1
USP7 is identified as a glycolysis-related DUB in PDAC. A Flow chart of the screen setup for glycolysis-related DUBs. USPs, ubiquitin-specific proteases; UCHs, ubiquitin C-terminal hydrolases; OTUs, ovarian tumor proteases; MJDs, Machado-Joseph disease protein domain proteases; JAMM, JAB1/MPN/MOV34 family. B Volcano plot of glycolysis-related DUBs, as identified by gene set enrichment analysis. ES, enrichment score. C GSEA plot of Hallmark_glycolysis, sample grouping was made based on the median expression level of USP7. D IHC analysis showed the expression of USP7 in human PDAC and corresponding nontumor tissues (n = 205); scale bar: 100 μm. E Kaplan-Meier analysis showed the overall survival (OS) of PDAC patients based on the protein expression of USP7; n = 114 for USP7-high and n = 91 for USP7-low. F Multivariate analysis of independent prognostic factors of PDAC. G Analysis of the relationship between USP7 expression and SUVmax value; scale bar: 100 μm; n = 14 for USP7-high and n = 8 for USP7-low. Values were compared by Fisher’s exact test (D), the log-rank test (E), multivariate Cox regression analyses (F), and the Student’s t test (G). *P < 0.05, **P < 0.01, ***P < 0.001
Fig. 2
Fig. 2
USP7 enhances the glycolytic metabolism of PDAC cells.A Western blotting analysis showed USP7 protein expression in PDAC cells and the nonmalignant HPDE cells. B Western blotting showed USP7 knockdown efficiency in CFPAC-1 and PANC1 cells. C, D The effects of USP7 knockdown on the glucose uptake and lactate production in CFPAC-1 and PANC1 cells (n = 3 per group). E, F Seahorse experiment showed the effect of USP7 knockdown on extracellular acidification rate (ECAR) of CFPAC-1 and PANC1 cells. ΔECAR represents the difference between the ECAR values induced by oligomycin and 2-DG (n = 3 per group). GI The effects of USP7 inhibition by different concentrations of P5091 on the glucose uptake, lactate production, and ECAR in CFPAC-1 and PANC1 cells (n = 3 per group). J Correlation analysis of USP7 with glucose transporter (GLUT1, encoded by SLC2A1) and glycolytic genes (HK2 and LDHA) in pancreatic cancer (n = 178) Values were compared by the one-way ANOVA multiple comparisons with Tukey’s method among groups (C, D, F, G) and Spearman’s rank correlation methods (J). Assays for glycolysis were independently repeated three times with similar results. *P < 0.05, **P < 0.01, ***P < 0.001
Fig. 3
Fig. 3
Hypoxia and extracellular matrix stiffness induces the expression of USP7 in PDAC cells. A PDAC cells (AsPC-1, CFPAC-1 and PANC1) were cultured under normoxic (5% O2) and hypoxic (1% O2) conditions for 24 h. Then, HIF1α transcriptional activity in PDAC cells was measured (n = 3). B The mRNA level of USP7 in groups as indicated in (A) was determined by real-time qPCR analysis (n = 3). C PDAC cells (AsPC-1, CFPAC-1 and PANC1) were cultured under hypoxic (1% O2) conditions for 24 h, with or without treatment of an HIF1α inhibitor LW6. Then, HIF1α transcriptional activity in PDAC cells was measured (n = 3). D The mRNA level of USP7 in groups as indicated in (B) was determined by real-time qPCR analysis (n = 3). E USP7 mRNA levels in PDAC samples from TCGA database were compared with the HIF1α signature using correlation analysis (n = 178). F CFPAC-1 and PANC1 seeded on soft (0.5 kPa) and stiff matrices (12 kPa) 6-well plates and cultured under normoxic (5% O2) or hypoxic (1% O2) conditions for 24 h. The mRNA level of USP7 was determined by real-time qPCR analysis (n = 3) Values were compared by the Student’s t test (A–D), Spearman’s rank correlation methods (E), and one-way ANOVA multiple comparisons with Tukey’s method among groups (F). Experiments were independently repeated three times (A–D, F) with similar results. *P < 0.05 and **P < 0.01; # indicates comparison with Stiff + 1% O2 group, #P < 0.05 and ##P < 0.01
Fig. 4
Fig. 4
USP7 promotes PDAC tumor growth in a glycolysis-dependent manner.A Plate colony formation experiment showed that different doses of P5091 treatment on the proliferation of CFPAC-1 and PANC1 cells (n = 4 per group). B Treatment schedule of P5091 in a subcutaneous xenograft model (n = 5 per group). Once the tumors grew to an approximate size of 100 mm³, P5091 was administered. C The tumor weight of PANC1-derived subcutaneous xenograft tumors upon P5091 treatment. D Western blotting analysis showed the overexpression efficiency of USP7 in AsPC1 cells. E Plate colony formation experiment showed that the effect of USP7 overexpression on the proliferation of AsPC1 cells, with or without 2-DG treatment (n = 3 per group). F The tumor weight of subcutaneous xenograft tumors formed from OE-Control and OE-USP7 AsPC1 cells (n = 5 per group). Mice were given intraperitoneal injections of 500 mg/kg of 2-DG every two days Values were compared by one-way ANOVA multiple comparisons with Tukey’s method among groups (A) and the Student’s t test (C, E, F). Experiments were independently repeated three times (C–E) with similar results. Animal experiments (C, F) were not repeated. *P < 0.05, **P < 0.01, ***P < 0.001; NS, not significant
Fig. 5
Fig. 5
USP7 regulates the stability of the c-Myc protein through ubiquitination modification.A, B GSEA analysis showed the top 10 pathways affected by USP7 knockdown or P5091 in PANC1 cells. GSEA was performed with RNA sequencing data of indicated PANC1 cells and the Hallmark gene sets. C GSEA plot showed the link between USP7 expression and c-Myc target genes. Data was generated in the TCGA cohort. D The sh-Ctrl and sh-USP7-1 PANC1 cells were treated with 100 µg/ml CHX for the indicated times (0, 10, 30, 60, 90, 120 min); then, the cell extracts were harvested, and subjected to immunoblotting with c-Myc antibodies. E Western blotting showing the protein levels of c-Myc in sh-Ctrl and sh-USP7-1 PANC1 cells treated with 10 µM MG132 for 6 h (n = 4 per group). F Co-IP analysis of the interaction among USP7 and c-Myc in CFPAC-1 and PANC1 cells. G Cell lysates from OE-Control and OE-USP7 AsPC1 cells were immunoprecipitated with anti-c-Myc, and the immunocomplexes were immunoblotted with antibodies against HA. H Real-time qPCR analysis showed SLC2A1, HK2, and LDHA expression in sh-Ctrl and sh-USP7-1 PDAC cells after ectopic expression of c-Myc (n = 3 per group). I Measurement of glucose uptake and lactate production in sh-Ctrl and sh-USP7-1 PDAC cells after ectopic expression of c-Myc (n = 3 per group) Values were compared by the Student’s t test (D, E) and one-way ANOVA multiple comparisons with Tukey’s method among groups (H, I). Experiments were independently repeated two (F, G) or three times (D, E, H, I) with similar results. RNA sequencing analysis (A, B) was not repeated. *P < 0.05, **P < 0.01, ***P < 0.001
Fig. 6
Fig. 6
Targeting USP7 in a transgenic mouse model of PDAC inhibits tumor progression and glycolytic metabolism.A Treatment schedule of P5091 in the KPC mice (n = 5 per group). B Histological analysis of pancreas lesions upon P5091 treatment in KPC mice. PanINs: pancreatic intraepithelial neoplasia. C IHC analysis of c-Myc, GLUT1, HK2, and LDHA in KPC pancreas lesions upon P5091 treatment. Scale bar: 50 μm. D Quantification data of c-Myc staining in C (n = 5 per group). E Quantification data of GLUT1, HK2, and LDHA staining in C (n = 5 per group) Values were compared by Fisher’s exact test (B) and the Student’s t test (C, E). Animal experiment in this figure was not repeated. *P < 0.05, **P < 0.01, ***P < 0.001
Fig. 7
Fig. 7
USP7 expression correlates c-Myc and glycolytic proteins in clinical samples.A Analysis of the correlation between USP7, c-Myc, and glycolytic proteins (GLUT1, HK2, and LDHA) in a PDAC tissue microarray. P values were compared by the Spearman’s rank correlation methods. B The schematic diagram illustrates that the stiffness of the extracellular matrix and a hypoxic microenvironment trigger the expression of USP7. USP7, in turn, boosts the stability of c-Myc by facilitating its ubiquitination. Consequently, c-Myc promotes the transcription and regulation of glycolytic genes, leading to elevated glycolysis levels and fostering tumor growth

References

    1. Hanahan D, Weinberg RA. Hallmarks of cancer: the next generation. Cell. 2011;144(5):646–74. - PubMed
    1. Icard P, Shulman S, Farhat D, Steyaert JM, Alifano M, Lincet H. How the Warburg effect supports aggressiveness and drug resistance of cancer cells? Drug Resist Update. 2018;38:1–11. - PubMed
    1. Barba I, Carrillo-Bosch L, Seoane J. Targeting the Warburg effect in cancer: where do we stand? Int J Mol Sci. 2024;25(6):3142. - PMC - PubMed
    1. Zhu YH, Zheng JH, Jia QY, Duan ZH, Yao HF, Yang J, et al. Immunosuppression, immune escape, and immunotherapy in pancreatic cancer: focused on the tumor microenvironment. Cell Oncol. 2023;46(1):17–48. - PubMed
    1. Chen PC, Ning Y, Li H, Su JG, Shen JB, Feng QC, et al. Targeting ONECUT3 blocks glycolytic metabolism and potentiates anti-PD-1 therapy in pancreatic cancer. Cell Oncol. 2024;47(1):81–96. - PubMed

MeSH terms

Substances