. 2025 Feb 20;188(4):1019-1035.e22.
doi: 10.1016/j.cell.2024.11.031. Epub 2024 Dec 20.

Inflammation switches the chemoattractant requirements for naive lymphocyte entry into lymph nodes

Affiliations

Inflammation switches the chemoattractant requirements for naive lymphocyte entry into lymph nodes

Kevin Y Chen et al. Cell. .

Abstract

Sustained lymphocyte migration from blood into lymph nodes (LNs) is important for immune responses. The CC-chemokine receptor-7 (CCR7) ligand CCL21 is required for LN entry but is downregulated during inflammation, and it has been unclear how recruitment is maintained. Here, we show that the oxysterol biosynthetic enzyme cholesterol-25-hydroxylase (Ch25h) is upregulated in LN high endothelial venules during viral infection. Lymphocytes become dependent on oxysterols, generated through a transcellular endothelial-fibroblast metabolic pathway, and the receptor EBI2 for inflamed LN entry. Additionally, Langerhans cells are an oxysterol source. Ch25h is also expressed in inflamed peripheral endothelium, and EBI2 mediates B cell recruitment in a tumor model. Finally, we demonstrate that LN CCL19 is critical in lymphocyte recruitment during inflammation. Thus, our work explains how naive precursor trafficking is sustained in responding LNs, identifies a role for oxysterols in cell recruitment into inflamed tissues, and establishes a logic for the CCR7 two-ligand system.

Keywords: CCL19; CCL21; GPR183; cholesterol metabolites; high endothelial venules; lymph nodes; lymphocyte trafficking; stromal cells; tumors; viral infection.


Conflict of interest statement

Declaration of interests The authors declare no competing interests.

Figures

Figure 1.
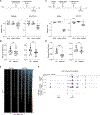
Figure 1.. LN stroma downregulates CCL21 and upregulates Ch25h during infection
(A) IFM of naive pLN (left) or pLN 24 h post-footpad LCMV infection (right). Sections stained for PNAd+ HEVs, IgD, and CCL21. Scale bars, 100 μm. (B) Zoomed-in views of HEVs in naive (top) and inflamed (bottom) LNs. Scale bars, 20 μm. (C) RT-qPCR for Ccl21 in LNs (draining popliteal, sub-draining inguinal, or non-draining brachial) that were responding to either saline or LCMV. Each dot represents a mouse LN pair. (D) RNA-scope images of Ch25h and Cyp7b1 (red) in LNs co-stained for IgD (brown). Images are representative of at least 3 mice. Scale bars, 100 μm. (E) RT-qPCR for Ch25h and Cyp7b1 in sorted pLN HEVs, BECs, FRCs, or DN stromal cells. (F) RT-qPCR for Ch25h in LNs as in (C). (G) RT-qPCR for Ch25h and Ccl21 in LN stromal cells sorted from LCMV-draining pLNs or non-draining bLNs. Each dot represents pooled sorted cells from 6 mice in (E) and (G). All statistical tests are two-tailed unpaired t tests. *p < 0.05; **p < 0.01; ***p < 0.001; ns, not significant (p > 0.05). Means ± standard deviation indicated in summary graphs. See also Figure S1.
Figure 2.
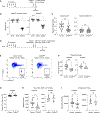
Figure 2.. EBI2 promotes naive lymphocyte entry into homeostatic LNs and becomes essential in inflamed draining LNs
(A) Quantification of transferred B cell EBI2 KO/WT ratios 90 min after co-transfer in blood, spleen, peripheral LNs, mesenteric LNs (mLNs), or Peyer’s patches (PPs) in naive WT, Ch25h−/−, or Cyp7b1−/− mice. The dashed line is the average input EBI2 KO:WT ratio. Each dot represents a mouse. (B) B cell EBI2 KO/WT ratios after co-transfer in pLNs responding to either saline or LCMV. (C) Representative flow cytometry plots of inflamed pLN from Ch25h+/— (left) or Ch25h−/− mice (right), injected 90 min prior with 50:50 EBI2 KO:WT cells. Center plot shows GFP expression in the transferred EBI2 KO B cells (cyan), which is absent in co-transferred WT cells (red). (D) Representative flow cytometry plots as in (C) with Cyp7b1+/— or Cyp7b1−/− mice. CTV and DR dyes are swapped for EBI2 KO and WT-transferred cells between (C) and (D). Summary graphs in (A)–(D) are data pooled from at least 3 experiments. Each dot represents a mouse (blood, spleen) or individual LN (popliteal, brachial) in (B)–(D). (E) Two-photon microscopy images of cleared pLNs from mTmG mice at 24 h post-footpad LCMV infection (full 3D stack in Video S1). Mice were injected with CTV+ WT B cells and DR+ EBI2 KO B cells 90 min and anti-CD45.2-AF488 (green) 2 min prior to harvest. HEV contour shown in magenta. Image is representative of 4 LNs across 2 mice and 2 independent experiments. Scale bars, 30 μm (top-down image) or 40 μm (side view images). (F) Summary quantification of E showing percent of transferred B cells within pLN HEVs. Each connected pair of dots is an LN. (G) Distribution of the shortest distance to HEV for transferred B cells, pooled from 4 LNs. Medians indicated; two-tailed unpaired t test between WT and EBI2 KO distances. Righthand edges of histogram bins listed on x axis. All statistical tests are two-tailed unpaired t tests. *p < 0.05; **p < 0.01; ***p < 0.001; ns, not significant (p > 0.05). Means ± standard deviation indicated in summary graphs. See also Figures S2 and S3.
Figure 3.
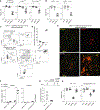
Figure 3.. CCL21 blockade increases the EBI2 requirement for LN homing, while CCL19 delivery reverses it in inflamed LNs
(A) Schematic of experiment (top). Quantification of EBI2 KO:WT B cell ratios 90 min post-transfer in naive pLNs. (B) Percent of total B cells that are transferred WT or EBI2 KO B cells in naive pLNs. (C) Schematic of experiment (top). Quantification of transferred EBI2 KO:WT B cell ratios post-transfer in inflamed pLNs. The dashed line is the average input ratio from 3 experiments in (A) and (C). (D) Percent of total B cells that are transferred WT or EBI2 KO B cells in inflamed pLNs. Each dot represents a mouse (blood, spleen) or individual LN (popliteal) in (A)–(D). (E) ATAC-seq heatmap showing chromatin accessible regions around transcription start site (TSS), 5 kb flanking on both sides in inflamed pLN and naive bLN FRC. (F) ATAC-seq reads coverage for Ccl21a. Top two tracks are non-draining bLN FRC duplicates, and middle two tracks are LCMV-inflamed pLN FRC duplicates. Bottom two tracks are CD4 T cell duplicates from GEO: GSE77695. Red bars indicate ATAC-seq peaks. All statistical tests are two-tailed unpaired t tests. *p < 0.05; **p < 0.01; ***p < 0.001; ****p < 0.0001; ns, not significant (p > 0.05). Means ± standard deviation indicated in summary graphs. See also Figures S3 and S4.
Figure 4.
Figure 4.. Endothelial Ch25h is necessary for optimal lymphocyte recruitment and antigen-specific T cell response in inflamed draining LNs
(A) Schematic of experiment. (B) Quantification of EBI2 KO:WT B cells after co-transfer in LCMV-infected control (iCdh5+ or Ch25hfl/fl) and Ch25hΔBEC mice. The dashed line is the average input ratio from 5 experiments. (C) Transferred B cell percent of total B cells in control and Ch25hΔBEC pLNs from (B). (D) Schematic of experiment. (E) Representative flow cytometry plot of CD45.1+ transferred B cells in inflamed pLNs in control (iCdh5+ or Ch25hfl/fl) and Ch25hΔBEC mice. (F) Quantification of transferred B cells in (E), 3 days after transfer (4 days after LCMV+OVA footpad injection). (G) Percent of transferred OTII CD4+ T cells that have diluted CTV and are CD44+ in inflamed draining pLNs of control and Ch25hΔBEC mice. (H) Absolute numbers of transferred OTII cells in draining pLNs and non-draining bLNs of control and Ch25hΔBEC mice. (I) Total host endogenous B cells in draining pLNs and non-draining bLNs of control and Ch25hΔBEC mice, 4 days after LCMV+OVA footpad injection. Data pooled from 2 independent experiments in (F)–(I). Each dot represents a mouse (blood, spleen) or individual LN (popliteal, brachial) in (B), (C), and (F)–(I). All statistical tests are two-tailed unpaired t tests. *p < 0.05; **p < 0.01; ***p < 0.001; ****p < 0.0001; ns, not significant (p > 0.05). Means ± standard deviation indicated in summary graphs. See also Figure S5.
Figure 5.
Figure 5.. Radioresistant Langerhans cells contribute to recruiting naive lymphocytes into the draining LN
(A) Quantification of EBI2 KO:WT B cell ratios after co-transfer in control (Ch25hfl/fl mice or WT→Ch25hfl/fl chimeric mice), Ch25hΔhemat, or WT→Ch25hΔhemat chimeric mice, post LCMV infection. (B) Quantification of EBI2 KO:WT B cell ratios after co-transfer in Ch25h+/−→WT or Ch25h−/−→WT chimeras, post LCMV infection. The dashed line is the average input ratio from 3 experiments in (A) and (B). (C and D) Representative flow cytometry plots of radioresistance in T cells, EpCAM+ CD11b+ Langerhans cells (LCs), and EpCAM− DCs in CD45.1+ WT→Vav-iCre+ mTmG+ chimeras. Each dot represents pooled pLNs from a mouse in (D). (E) IFM of LCMV-inflamed pLN in WT→Vav-iCre+ mTmG+ chimeras, stained with anti-Langerin for LCs, with endogenous tdTomato and GFP signal. Sections representative of 2 mice. Scale bars, 100 or 30 μm for inset. (F) RT-qPCR for Ch25h and Cyp7b1 in LN effector CD44+ CD62L− CD4 T cells and LCs sorted from either LCMV-draining pLNs or non-draining bLNs. Each dot represents pooled sorted cells from 3–5 mice. Cyp7b1 undetectable in some samples. (G) Schematic of experiment (top) and efficiency of LC ablation in HuLang-DTR+ mice. Each dot represents pooled iLNs from a mouse. (H) Quantification of transferred B cell EBI2 KO:WT ratios after co-transfer in DT-treated WT or HuLang-DTR+ mice, post LCMV infection. The dashed line is the average input ratio from 3 experiments. Each dot represents a mouse (blood, spleen) or individual LN (popliteal, brachial) in (A), (B), and (H). All statistical tests are two-tailed unpaired t tests. **p < 0.01; ***p < 0.001; ns, not significant (p > 0.05). Means ± standard deviation indicated in summary graphs. See also Figures S5 and S6.
Figure 6.
Figure 6.. EBI2 is required for naive B cell homing to tdLNs and solid tumors
(A) Schematic of experiment. (B) Quantification of EBI2 KO:WT B cell ratios after co-transfer in saline-injected or MC38 tumor flank-implanted mice. The dashed line is the average input ratio from 5 experiments. Statistical test is two-tailed unpaired t test. **p < 0.01. (C) Absolute numbers of transferred B cells in naive or tumor-draining iLNs. Data pooled from 3 experiments. (D) Schematic of experiment. (E) Representative flow cytometry plots of transferred EBI2 KO and WT B cells and CD4 T cells that have infiltrated the solid tumor, 90 min post co-transfer. (F) Quantification of transferred B, CD4, and CD8 T cell EBI2 KO:WT ratios after co-transfer in tumor-implanted mice. The dashed line is the average input ratio from 3 to 5 experiments. Each dot represents a mouse (blood, spleen) or individual tumors or iLNs in (B), (C), and (F). Tumors implanted bilaterally in some mice. Means ± standard deviation indicated in summary graphs. See also Figure S7.
Figure 7.
Figure 7.. Inflammation reveals a role for CCL19 in naive lymphocyte homing that is non-redundant with CCL21
(A) RT-qPCR for Cc19 in LNs (left) or sorted LN stroma (right) from saline or LCMV-infected mice. Each dot represents an LN pair from a mouse (left) or pooled sorted cells from 6 mice. (B) Schematic of experiment (top). Quantification of EBI2 KO:WT B cell ratios (bottom) after co-transfer. (C) Quantification of EBI2 KO:WT B cell ratios after co-transfer in WT or Ccl19−/− mice, post LCMV infection. The dashed line is the average input ratio from 3 experiments in (B) and (C). (D) Quantification of (C) for percent of total B cells that are transferred B cells in inflamed pLNs or naive bLNs of WT or Ccl19−/− mice. Each dot represents a mouse (blood, spleen) or individual LNs (popliteal, brachial) in (B)–(D). All statistical tests are two-tailed unpaired t tests. **p < 0.01; ***p < 0.001; ****p < 0.0001; ns, not significant (p > 0.05). Means ± standard deviation indicated in summary graphs. See also Figure S7.

References

    1. Förster R, Davalos-Misslitz AC, and Rot A (2008). CCR7 and its ligands: balancing immunity and tolerance. Nat. Rev. Immunol 8, 362–371. 10.1038/nri2297. - DOI - PubMed
    1. Anderson ND, Anderson AO, and Wyllie RG (1975). Microvascular changes in lymph nodes draining skin allografts. Am. J. Pathol 81, 131–160. - PMC - PubMed
    1. Webster B, Ekland EH, Agle LM, Chyou S, Ruggieri R, and Lu TT (2006). Regulation of lymph node vascular growth by dendritic cells. J. Exp. Med 203, 1903–1913. 10.1084/jem.20052272. - DOI - PMC - PubMed
    1. Hoke D, Mebius RE, Dybdal N, Dowbenko D, Gribling P, Kyle C, Baumhueter S, and Watson SR (1995). Selective modulation of the expression of L-selectin ligands by an immune response. Curr. Biol 5, 670–678. 10.1016/s0960-9822(95)00132-1. - DOI - PubMed
    1. Havenar-Daughton C, Abbott RK, Schief WR, and Crotty S (2018). When designing vaccines, consider the starting material: the human B cell repertoire. Curr. Opin. Immunol 53, 209–216. 10.1016/j.coi.2018.08.002. - DOI - PMC - PubMed