. 2025 Jun;82(6):1036-1049.
doi: 10.1016/j.jhep.2024.12.016. Epub 2024 Dec 19.

Single-cell RNA sequencing-derived signatures define response patterns to atezolizumab + bevacizumab in advanced hepatocellular carcinoma

Affiliations

Single-cell RNA sequencing-derived signatures define response patterns to atezolizumab + bevacizumab in advanced hepatocellular carcinoma

Sarah Cappuyns et al. J Hepatol. 2025 Jun.

Abstract

Background & aims: The combination of atezolizumab and bevacizumab (atezo+bev) is the current standard of care for advanced hepatocellular carcinoma (HCC), providing a median overall survival (OS) of 19.2 months. Here, we aim to uncover the underlying cellular processes driving clinical benefit vs. resistance to atezo+bev.

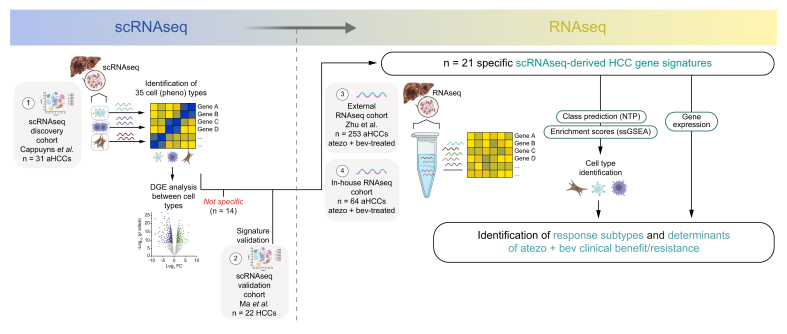
Methods: We harnessed the power of single-cell RNA sequencing in advanced HCC to derive gene expression signatures recapitulating 21 cell phenotypes. These signatures were applied to 422 RNA-sequencing samples of patients with advanced HCC treated with atezo+bev (n = 317) vs. atezolizumab (n = 47) or sorafenib (n = 58) as comparators.

Results: We unveiled two distinct patterns of response to atezo+bev. First, an immune-mediated response characterised by the combined presence of CD8+ T effector cells and pro-inflammatory CXCL10+ macrophages, representing an immune-rich microenvironment. Second, a non-immune, angiogenesis-related response distinguishable by a reduced expression of the VEGF co-receptor neuropilin-1 (NRP1), a biomarker that specifically predicts improved OS upon atezo+bev vs. sorafenib (p = 0.039). Primary resistance was associated with an enrichment of immunosuppressive myeloid populations, namely CD14+ monocytes and TREM2+ macrophages, and Notch pathway activation. Based on these mechanistic insights we define "Immune-competent" and "Angiogenesis-driven" molecular subgroups, each associated with a significantly longer OS with atezo+bev vs. sorafenib (p of interaction = 0.027), and a "Resistant" subset.

Conclusion: Our study unveils two distinct molecular subsets of clinical benefit to atezolizumab plus bevacizumab in advanced HCC ("Immune-competent" and "Angiogenesis-driven") as well as the main traits of primary resistance to this therapy, thus providing a molecular framework to stratify patients based on clinical outcome and guiding potential strategies to overcome resistance.

Impact and implications: Atezolizumab + bevacizumab (atezo+bev) is standard of care in advanced hepatocellular carcinoma (HCC), yet molecular determinants of clinical benefit to the combination remain unclear. This study harnesses the power of single-cell RNA sequencing, deriving gene expression signatures representing 21 cell subtypes in the advanced HCC microenvironment. By applying these signatures to RNA-sequencing samples, we reveal two distinct response patterns to atezo+bev and define molecular subgroups of patients ("Immune-competent" and "Angiogenesis-driven" vs. "Resistant") with differential clinical outcomes upon treatment with atezo+bev, pointing towards the role of immunosuppressive myeloid cell types and Notch pathway activation in primary resistance to atezo+bev. These results may help refine treatment strategies and improve outcomes for patients with advanced HCC, while also guiding future research aimed at overcoming resistance mechanisms.

Keywords: Advanced Hepatocellular Carcinoma; Atezolizumab and bevacizumab; Biomarkers of Response; Primary Resistance; Single-Cell RNA-Sequencing.


Conflict of interest statement

Conflict of interest AD received educational support for congress attendance and consultancy fees from Roche, and speaker fees from Roche, AstraZeneca, Eisai, and Chugai. FFo has received honoraria for lectures from AstraZeneca, Lilly, MSD, Pfizer and Roche. He has served as advisory board member to AstraZeneca, BMS, Eisai and Roche and has received travel support from Merck KGaA and Servier. RM has received consulting and lecture fees from Servier, Roche and Bristol Myers Squibb and travel and education funding from MSD, Eli Lilly, Bayer, Roche, Astrazeneca. SG reports other research funding from Boehringer Ingelheim, Bristol-Myers Squibb, Celgene, Genentech, Regeneron, and Takeda not related to this study. SG is a named co-inventor on an issued patent for MICSSS, a multiplex immunohistochemistry to characterise tumours and treatment responses. The technology is filed through Icahn School of Medicine at Mount Sinai (ISMMS) and is currently unlicensed. AV has received consulting fees from FirstWorld, Natera, Pioneering Medicine and Genentech; advisory board fees from BMS, Roche, Astra Zeneca, Eisai, and NGM Pharmaceuticals; and research support from Eisai. He has stock options from Espervita. JML reports research support from Eisai Inc and Bayer Pharmaceuticals, consultancy/sponsored lectures from Eisai Inc., Merck, Roche, Genentech, AstraZeneca, Bayer Pharmaceuticals, Abbvie, Sanofi, Moderna, Glycotest and Exelixis, and Data Safety Monitoring Board for Industry or Commercial Enterprise from Bristol Myers Squibb. The remaining authors have no conflicts of interest to declare. Please refer to the accompanying ICMJE disclosure forms for further details.

Figures

Image 1
Graphical abstract
Fig. 1
Fig. 1
Study design. aHCC, advanced hepatocellular carcinoma; atezo+bev, atezolizumab + bevacizumab; DGE, differential gene expression; RNAseq, bulk RNA sequencing; scRNAseq, single-cell RNA sequencing; ssGSEA, single-sample gene set-enrichment analysis.
Fig. 2
Fig. 2
Identification of specific, robust and biologically plausible single cell-derived HCC gene signatures. (A) UMAP representation of the 35 cell types identified in the TME. (B) Overview of HCC gene signatures generated in this study. (C) Heatmap of the proportion of cells positive for each HCC gene signature, calculated in each cell type, stratified according to signature specificity. (D) Barplot depicting the top cell types identified for each specific HCC gene signature (n = 21) in two single-cell reference datasets, ranked according to adjusted p values. HCC, hepatocellular carcinoma; UMAP, uniform manifold approximation and projection.
Fig. 3
Fig. 3
Single cell-derived HCC gene signatures and response to atezo+bev. (A) Heatmap depicting the enrichment of HCC gene signatures in each sample, stratified for response to atezo+bev. (B) Top: Boxplots depicting enrichment scores of CD8 Temra, CD8 Tex and Macro CXCL10, stratified for response to atezo+bev. Bottom: Receiver-operating characteristic curves showing the performance of each signature in predicting response to atezo+bev. AUC as indicated. (C) Left: Barplot depicting the presence of CD8 Temra, CD8 Tex and Macro CXCL10 in the TME, coloured for response to atezo+bev. Right: Sensitivity, specificity, PPV, NPV, and accuracy of response detection based on the presence of CD8 Temra, CD8 Tex and Macro CXCL10. (D) Kaplan-Meier curves depicting PFS of ImmunePos vs. ImmuneNeg tumours in patients treated with atezo+bev (n = 253, left) vs. sorafenib (n = 58, right). Statistics: A-B: Student’s t test, Welch’s t-test or Wilcoxon rank sum test, as appropriate. C: Fisher’s exact test. D: HR, 95% CIs and p values calculated using a univariate cox regression analysis. Atezo+bev, atezolizumab + bevacizumab; HCC, hepatocellular carcinoma; HR, hazard ratio; NPV, negative predictive value; PFS, progression-free survival; PPV, positive predictive value; TME, tumour microenvironment.
Fig. 4
Fig. 4
Immune-mediated response to atezo+bev in advanced HCC. (A) Heatmap representation of HCC inflamed (sub)classes and gene signatures previously associated with response to anti-PD(L)1 monotherapy in ImmunePos and ImmuneNeg responders vs. non-responders to atezo+bev. (B) Volcano plot depicting differentially expressed genes between ImmunePos responders (n = 33) and non-responders (n = 166) to atezo+bev. (C) Pathways enriched based on differentially upregulated genes in ImmunePos responders (n = 733 genes) vs. non-responders to atezo+bev (n = 166 genes), identified in Fig. 4B. (D) SubMap analysis evaluating transcriptomic similarity between response groups in atezo+bev-vs. anti-PD1-treated patients. FDR-corrected p values are shown. Statistics A: Student’s t test, Welch’s t-test, Wilcoxon rank sum test or Fisher’s exact test, as appropriate. Atezo+bev, atezolizumab + bevacizumab; FDR, false discovery rate; HCC, hepatocellular carcinoma; RNAseq, bulk RNA sequencing.
Fig. 5
Fig. 5
Angiogenesis-related response to atezo+bev in advanced HCC. (A) Barplot representing the number of patients presenting both high broad Copy Number Alteration (CNA) loads and TP53 loss of heterozygosity across response subgroups. (B) Boxplots depicting VEGFA expression levels across atezo+bev response groups. (C) Boxplots depicting NRP1 expression levels across atezo+bev response groups. (D) Kaplan-Meier curves depicting PFS of atezo+bev-treated patients (n = 253) according to low NRP1 expression status. (E) Kaplan-Meier curves depicting OS of atezo+bev-treated patients (n = 253) according to low NRP1 expression status. (F) Top: UMAP representation of NRP1 expression in the TME. Bottom: Heatmap of NRP1 expression in each cell type identified in the TME. Statistics: A: Fisher’s exact test; B–C: Kruskal-Wallis test followed by Dunn-test adjusted by Benjamini-Hochberg. E-F: HR, 95% CI and p values calculated using a univariate cox regression analysis. BS, broad CNA scores; Atezo+bev, atezolizumab + bevacizumab; HCC, hepatocellular carcinoma; HR, hazard ratio; LOH, loss of heterozygosity; OS, overall survival; PFS, progression-free survival; TME, tumour microenvironment; UMAP, uniform manifold approximation and projection; WES, whole-exome sequencing.
Fig. 6
Fig. 6
Determinants of primary resistance to atezo+bev in advanced HCC. (A) Boxplot depicting the enrichment of CD14+ monocytes and TREM2+ macrophages in patients with ImmunePos tumours with progressive disease vs. disease control after atezo+bev. (B,C) Boxplot depicting the ratio of TREM2+ macrophages to pro-inflammatory macrophages (B) and to CD8+ T cells (C), with representative images. (D) Boxplot depicting the enrichment of the Late TGF-β signature (left) and barplot showing the frequency of Notch pathway activation (right) in patients with ImmuneNeg tumours with progressive disease vs. disease control after atezo+bev. (E) Barplot displaying the frequency of S1, S2 or S3-classified tumours amongst patients who showed progressive disease vs. disease control after atezo+bev. Statistics: A-E: Student’s t test, Welch’s t-test or Wilcoxon rank sum test or Fisher’s exact test, as appropriate. Atezo+bev, atezolizumab + bevacizumab; CR, complete response; HCC, hepatocellular carcinoma; PD, progressive disease; PFS, progression-free survival; PR, partial response; SD, stable disease.
Fig. 7
Fig. 7
Molecular subsets determine clinical outcomes to atezo+bev in advanced HCC. (A) Flowchart summarising the classification criteria into the distinct molecular subsets, defined by: 1Presence of CD8 Temra, CD8 Tex, or Macro CXCL10; 2Absence of CD8 Temra, CD8 Tex or Macro CXCL10; 3Absence of CD14+ monocytes or TREM2+ macrophages; 4Presence of CD14+ monocytes or TREM2+ macrophages; Absence5 or presence6 of Notch; Decreased NRP1 expression7 or not.8 (B,C) Kaplan-Meier curves depicting OS and PFS of atezo+bev-treated patients (n = 253) according to molecular subset. (D) Kaplan-Meier curves depicting OS in the IMbrave150 study (n = 177) stratified according to "Immune-competent” and "Angiogenesis-driven" (left) or “Unclassified” and “Resistant” (right) classification. Statistics: B–C: log-rank test with Benjamini-Hochberg adjustment. D: log-rank test. P of interaction calculated using a Cox proportional hazards model. Atezo+bev, atezolizumab + bevacizumab; HCC, hepatocellular carcinoma; OS, overall survival; PFS, progression-free survival.

References

    1. Sung, Ferlay, Siegel, et al. Global cancer statistics 2020: GLOBOCAN estimates of incidence and mortality worldwide for 36 cancers in 185 Countries. CA Cancer J Clin. 2021;71:209–249. - PubMed
    1. Llovet, Pinyol, Kelley, et al. Molecular pathogenesis and systemic therapies for hepatocellular carcinoma. Nat Cancer. 2022;3:386–401. - PMC - PubMed
    1. Llovet, Ricci, Mazzaferro, et al. Sorafenib in advanced hepatocellular carcinoma. NEJM. 2008;359:378–390. - PubMed
    1. Finn, Qin, Ikeda, et al. Atezolizumab plus bevacizumab in unresectable hepatocellular carcinoma. NEJM. 2020;382:1894–1905. - PubMed
    1. Cheng, Qin, Ikeda, et al. Updated efficacy and safety data from IMbrave150: atezolizumab plus bevacizumab vs. sorafenib for unresectable hepatocellular carcinoma. J Hepatol. 2022;76:862–873. - PubMed

MeSH terms