. 2024 Dec 21;19(1):99.
doi: 10.1186/s13024-024-00790-0.

Targeted long-read sequencing to quantify methylation of the C9orf72 repeat expansion

Affiliations

Targeted long-read sequencing to quantify methylation of the C9orf72 repeat expansion

Evan Udine et al. Mol Neurodegener. .

Abstract

Background: The gene C9orf72 harbors a non-coding hexanucleotide repeat expansion known to cause amyotrophic lateral sclerosis and frontotemporal dementia. While previous studies have estimated the length of this repeat expansion in multiple tissues, technological limitations have impeded researchers from exploring additional features, such as methylation levels.

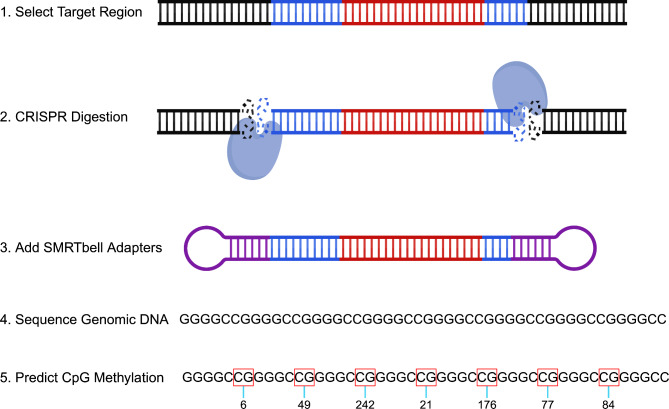
Methods: We aimed to characterize C9orf72 repeat expansions using a targeted, amplification-free long-read sequencing method. Our primary goal was to determine the presence and subsequent quantification of observed methylation in the C9orf72 repeat expansion. In addition, we measured the repeat length and purity of the expansion. To do this, we sequenced DNA extracted from blood for 27 individuals with an expanded C9orf72 repeat.

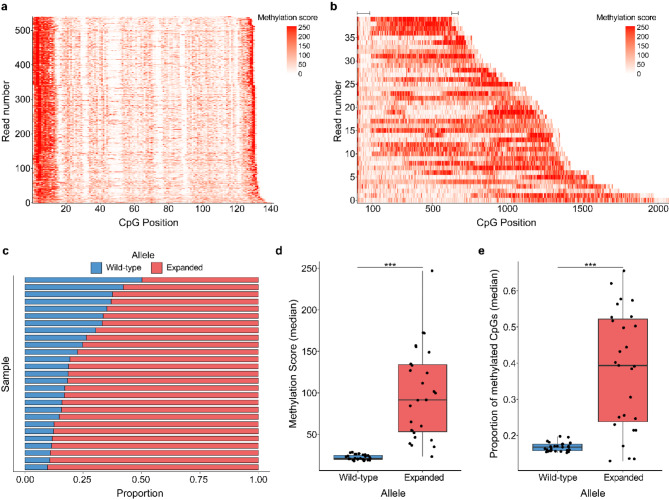
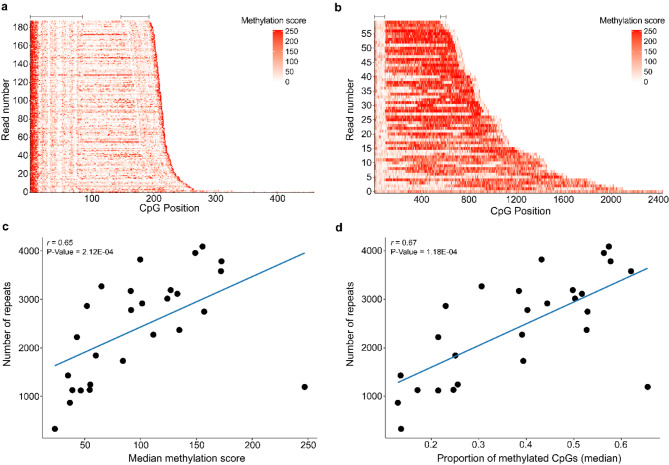
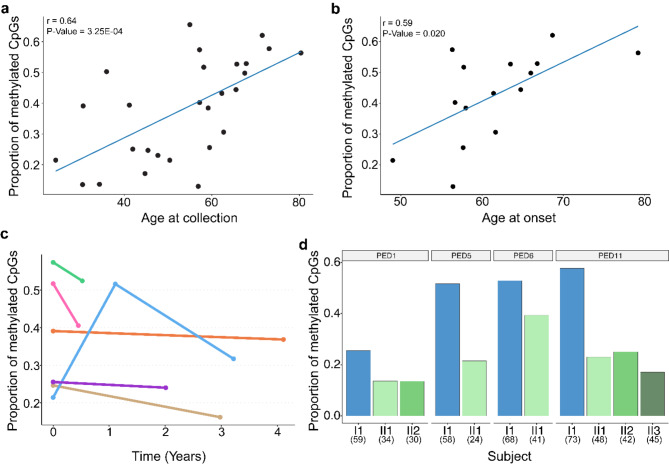
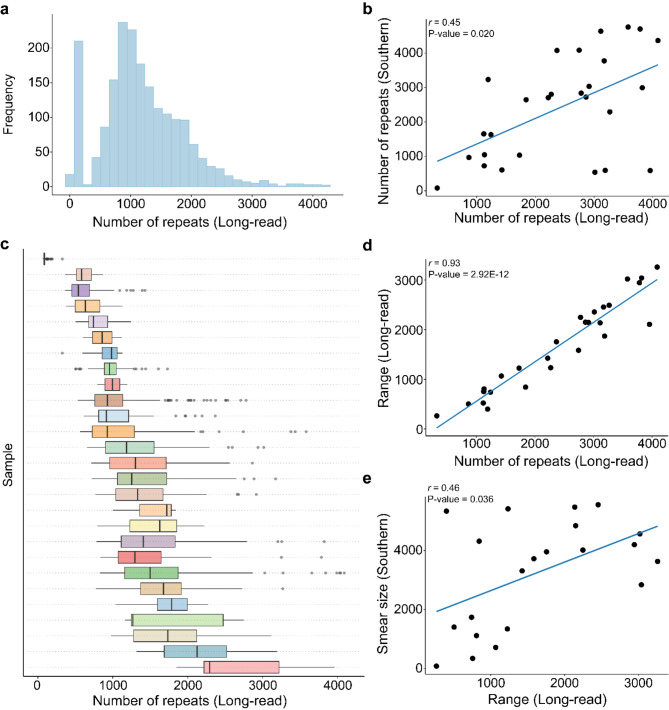
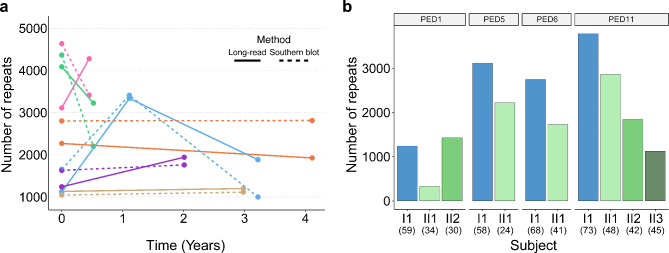
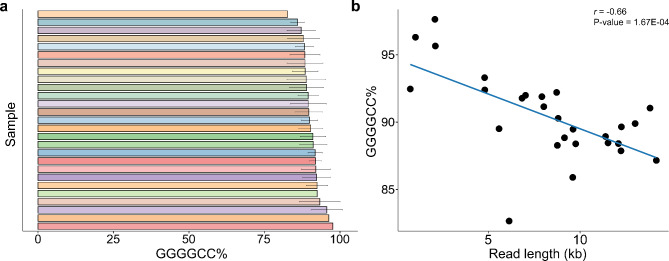
Results: For these individuals, we obtained a total of 7,765 on-target reads, including 1,612 fully covering the expanded allele. Our in-depth analysis revealed that the expansion itself is methylated, with great variability in total methylation levels observed, as represented by the proportion of methylated CpGs (13 to 66%). Interestingly, we demonstrated that the expanded allele is more highly methylated than the wild-type allele (P-Value = 2.76E-05) and that increased methylation levels are observed in longer repeat expansions (P-Value = 1.18E-04). Furthermore, methylation levels correlate with age at collection (P-Value = 3.25E-04) as well as age at disease onset (P-Value = 0.020). Additionally, we detected repeat lengths up to 4,088 repeats (~ 25 kb) and found that the expansion contains few interruptions in the blood.

Conclusions: Taken together, our study demonstrates robust ability to quantify methylation of the expanded C9orf72 repeat, capturing differences between individuals harboring this expansion and revealing clinical associations.

Keywords: Amyotrophic lateral sclerosis; C9orf72; Frontotemporal dementia; Long-read sequencing; Methylation; Repeat expansions.


Conflict of interest statement

Declarations. Ethics approval and consent to participate: All subjects agreed to be in the study, and biological specimens were obtained after informed consent with approval from the Mayo Clinic Institutional Review Board (IRB). Consent for publication: Not applicable. Competing interests: MDJ and RR hold a patent on methods to screen for the C9orf72 hexanucleotide repeat expansion.

Figures

Fig. 1
Fig. 1
Schematic overview of No-Amp sequencing with emphasis on calculating methylation. The DNA colored blue denotes the flanking region surrounding the C9orf72 repeat. The DNA colored red represents the C9orf72 repeat itself. The purple circular adapters exemplify SMRTbell Adapters. Numbers below the boxed CGs represent methylation probabilities. The target region was obtained following the No-Amp targeted sequencing method (PN 101-801-500 Version 09, Jan 2022). This figure was created using https://BioRender.com
Fig. 2
Fig. 2
Methylation of the C9orf72 repeat expansion. (a-b) Waterfall-like plots for (a) the wild-type and (b) expanded alleles (with flanking region) for one representative individual. The x-axis represents the position of each CpG within a read and the y-axis displays all reads sorted by number of CpG sites. Low methylation scores are presented in white and higher scores in red. Lines at the top of the waterfall-like plots indicate the approximate size of the flanking regions for the expanded allele. (c) Barplot showing the proportion of methylation (measured by median methylation score per read) per individual (n = 27) for the wild-type and expanded alleles. (d-e) Boxplot(s) displaying (d) the median methylation score and (e) median proportion of methylated CpGs per read for each individual (n = 27) for each allele. Boxes represent the interquartile range (IQR; 25th − 75th percentile), lines represent the median, and each dot corresponds to one individual. Significantly higher methylation was detected for the expanded allele using the methylation score (P-Value = 6.64E-06) and proportion of methylated CpGs (P-Value = 2.76E-05). A paired Wilcoxon rank-sum test was used for each of these comparisons. ***P-Value < 0.001
Fig. 3
Fig. 3
Methylation levels of various repeat sizes. (a-b) Waterfall-like plots for the expanded allele (with flanking region) for the samples with the (a) smallest and (b) longest repeat expansions in the cohort. The x-axis represents the position of each CpG within a read and the y-axis displays all reads sorted by number of CpG sites. Low methylation scores are presented in white and higher scores in red. Lines at the top of the waterfall-like plots indicate the approximate size of the flanking regions for the expanded allele. (c-d) Scatterplots showing the correlation between the maximum repeat length as determined using long-read sequencing and the (c) median methylation score and (d) the median proportion of methylated CpGs per read for all individuals (n = 27). Each dot represents an individual. A significant positive correlation was detected with the median methylation score (r = 0.65, P-Value = 2.12E-04) and median proportion of methylated CpGs (r = 0.67, P-Value = 1.18E-04). The solid blue line represents a linear regression line. A Spearman’s rank correlation was used for these analyses
Fig. 4
Fig. 4
Methylation age-related, longitudinal and familial analyses. (a) Scatterplot showing the median proportion of methylated CpGs per read for each individual (n = 27) for the expanded allele and the age at collection. A significant positive correlation was detected (r = 0.64, P-Value = 3.25E-04). The solid blue line represents a linear regression line. Each dot represents one individual. (b) Scatterplot showing the median proportion of methylated CpGs per read for patients with ALS (n = 15) for the expanded allele and age at onset. A significant positive correlation was detected with age at onset (r = 0.59, P-Value = 0.020). The solid blue line represents a linear regression line. Each dot represents one individual. A Spearman’s rank correlation was used for these analyses. (c) Dotplot showing the median proportion of methylated CpGs per read for each individual for the expanded allele over time measured in years. Longitudinal measurements were obtained for 6 individuals. Each dot represents a unique time point and lines connect the points within a given individual. Each color corresponds to one individual. (d) Barplot(s) showing median proportion of methylated CpGs per read for each individual across 4 different pedigrees corresponding to 7 unique transmissions. Each pedigree was shown to display a paternally inherited contraction in our previous Southern blotting study. Paternal parents are presented as blue bars and offspring are presented in various shades of green. A decrease in the proportion of methylated CpGs was observed for all 7 transmissions. Pedigree numbers are presented above each barplot and match the pedigrees in our Southern blotting study. Numbers in parentheses represent age at collection for each individual
Fig. 5
Fig. 5
Repeat length analysis. (a) Histogram representing the number of repeats detected across all reads for every individual (n = 27) for the expanded allele. (b) Scatterplot displaying the number of repeats detected using long-read sequencing (maximum) and the number of repeats detected using Southern blotting. Each dot represents one individual (n = 27). A significant correlation was detected between the two estimates (r = 0.45, P-Value = 0.020). (c) Boxplot displaying the number of repeats for each read per individual (n = 27). Boxes represent the interquartile range (IQR; 25th − 75th percentile), lines represent the median. (d) Scatterplot displaying the range (maximum - minimm) of the number of repeats and the number of repeats detected using long-read sequencing (maximum). Each dot represents one individual (n = 27). A significant correlation was detected between the two estimates (r = 0.93, P-Value = 2.92E-12). The solid blue line represents a linear regression line. (e) Scatterplot displaying the range (maximum - minimum) of the number of repeats and the smear size detected in Southern blotting. A significant correlation was detected between the two estimates (r = 0.45, P-Value = 0.036). Each dot represents one individual (n = 27). The solid blue line represents a linear regression line. A Spearman’s rank correlation was used for each correlation analysis
Fig. 6
Fig. 6
Repeat length longitudinal and familial analyses. (a) Dotplot showing the number of repeats detected using long-read sequencing (solid line) and Southern blotting (dashed line) over time. Longitudinal measurements were obtained for 6 individuals. Each dot represents the number of repeats detected (maximum) at a unique time point and lines connect a given individual. Individuals are assigned unique colors. (b) Barplot(s) showing the number of repeats per individual (maximum) in 4 pedigrees corresponding to 7 unique transmissions. Each pedigree was shown to display a paternally inherited contraction in our previous study. Paternal parents are presented as blue bars and offspring are presented in shades of green. Pedigree numbers are presented above each barplot and match our Southern blotting study. Numbers in parentheses represent age at collection for each individual
Fig. 7
Fig. 7
Sequence purity. (a) Barplot displaying the median percentage of the expansion composed of the GGGGCC motif per individual. Error bars represent the interquartile range (IQR; 25th − 75th percentile). Each individual has a unique color (n = 27). (b) Scatterplot displaying the percentage of the expansion composed of the GGGGCC motif for all reads and the read length (n = 27). Significantly higher purity was detected for shorter reads (r = -0.66, P-Value = 1.67E-04). Each dot represents one individual. The solid blue line represents a linear regression line. A Spearman’s rank correlation was used for this analysis

References

    1. DeJesus-Hernandez M, Mackenzie IR, Boeve BF, Boxer AL, Baker M, Rutherford NJ, et al. Expanded GGGGCC hexanucleotide repeat in noncoding region of C9ORF72 causes chromosome 9p-linked FTD and ALS. Neuron. 2011;72(2):245–56. - PMC - PubMed
    1. Renton AE, Majounie E, Waite A, Simon-Sanchez J, Rollinson S, Gibbs JR, et al. A hexanucleotide repeat expansion in C9ORF72 is the cause of chromosome 9p21-linked ALS-FTD. Neuron. 2011;72(2):257–68. - PMC - PubMed
    1. van der Ende EL, Jackson JL, White A, Seelaar H, van Blitterswijk M, Van Swieten JC. Unravelling the clinical spectrum and the role of repeat length in C9ORF72 repeat expansions. J Neurol Neurosurg Psychiatry. 2021;92(5):502–9. - PMC - PubMed
    1. Ryan M, Heverin M, Doherty MA, Davis N, Corr EM, Vajda A, et al. Determining the incidence of familiality in ALS: A study of temporal trends in Ireland from 1994 to 2016. Neurol Genet. 2018;4(3):e239. - PMC - PubMed
    1. Marogianni C, Rikos D, Provatas A, Dadouli K, Ntellas P, Tsitsi P, et al. The role of C9orf72 in neurodegenerative disorders: a systematic review, an updated meta-analysis, and the creation of an online database. Neurobiol Aging. 2019;84:238. e25- e34. - PubMed

LinkOut - more resources