. 2024 Dec 21;7(1):1688.
doi: 10.1038/s42003-024-07326-8.

HSP60 controls mitochondrial ATP generation for optimal virus-specific IL-21-producing CD4 and cytotoxic CD8 memory T cell responses

Affiliations

HSP60 controls mitochondrial ATP generation for optimal virus-specific IL-21-producing CD4 and cytotoxic CD8 memory T cell responses

Nazanin Ghahari et al. Commun Biol. .

Abstract

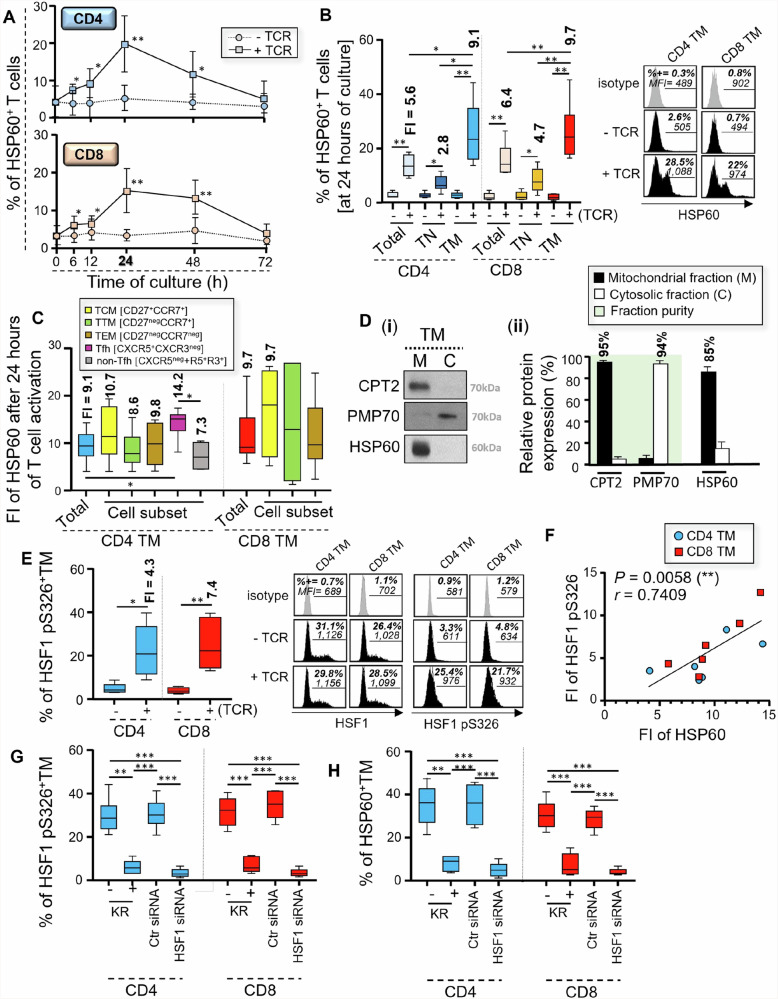
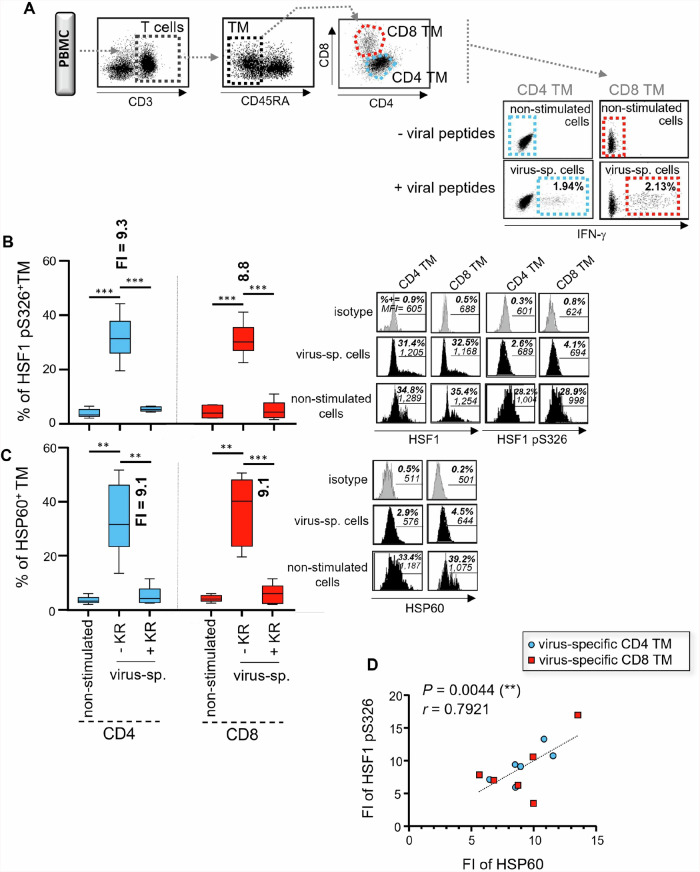
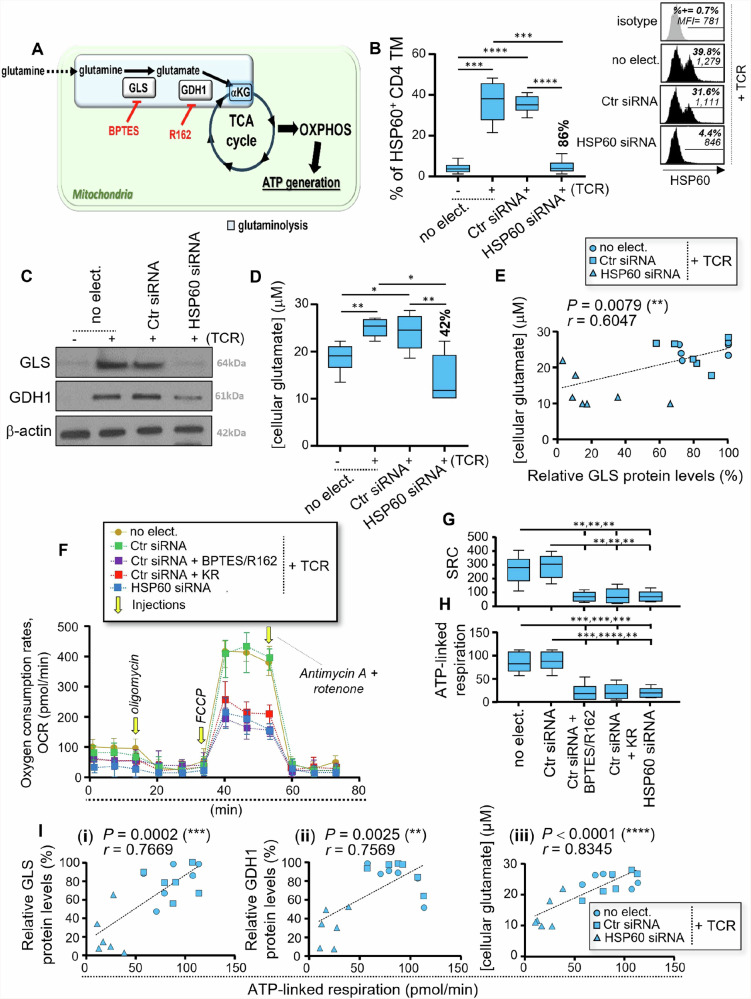
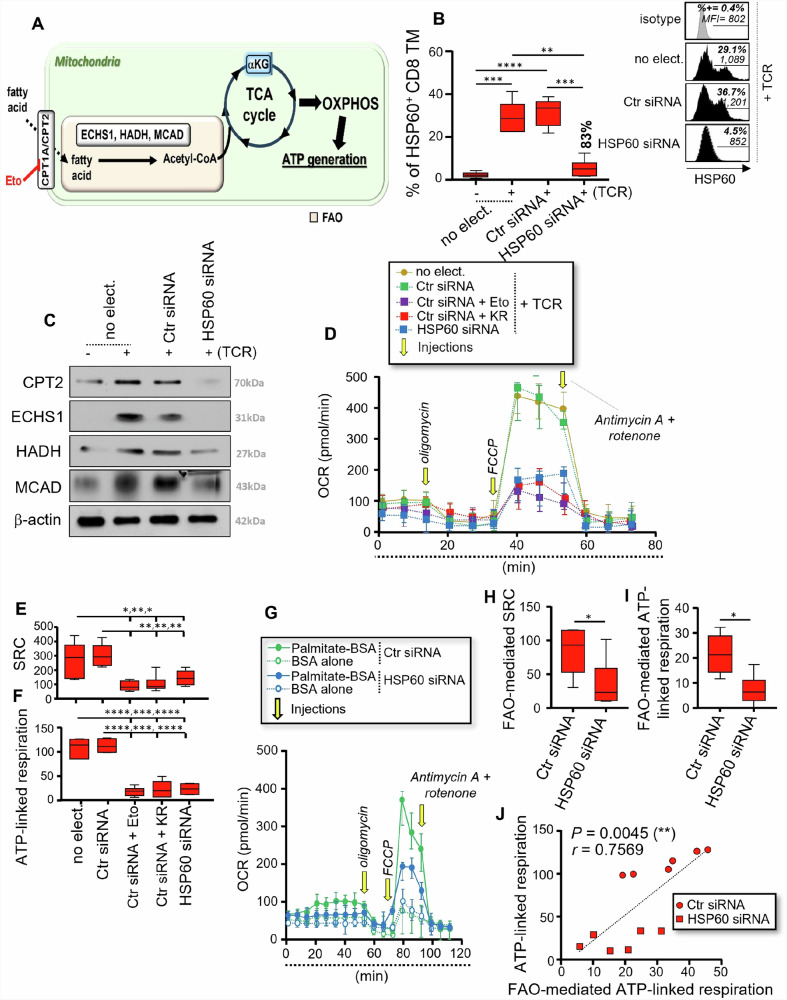
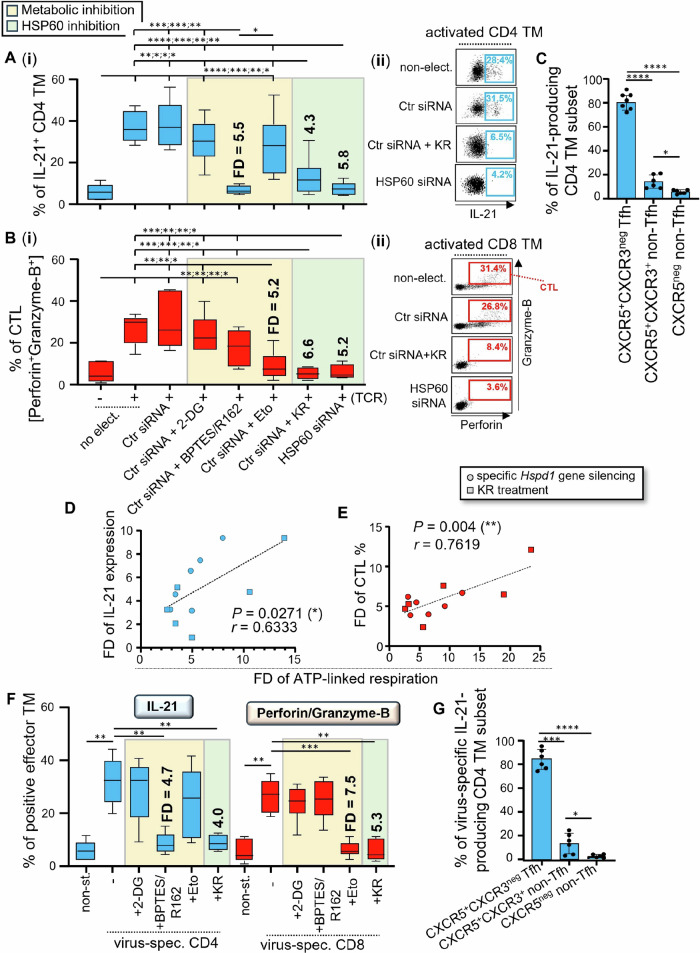
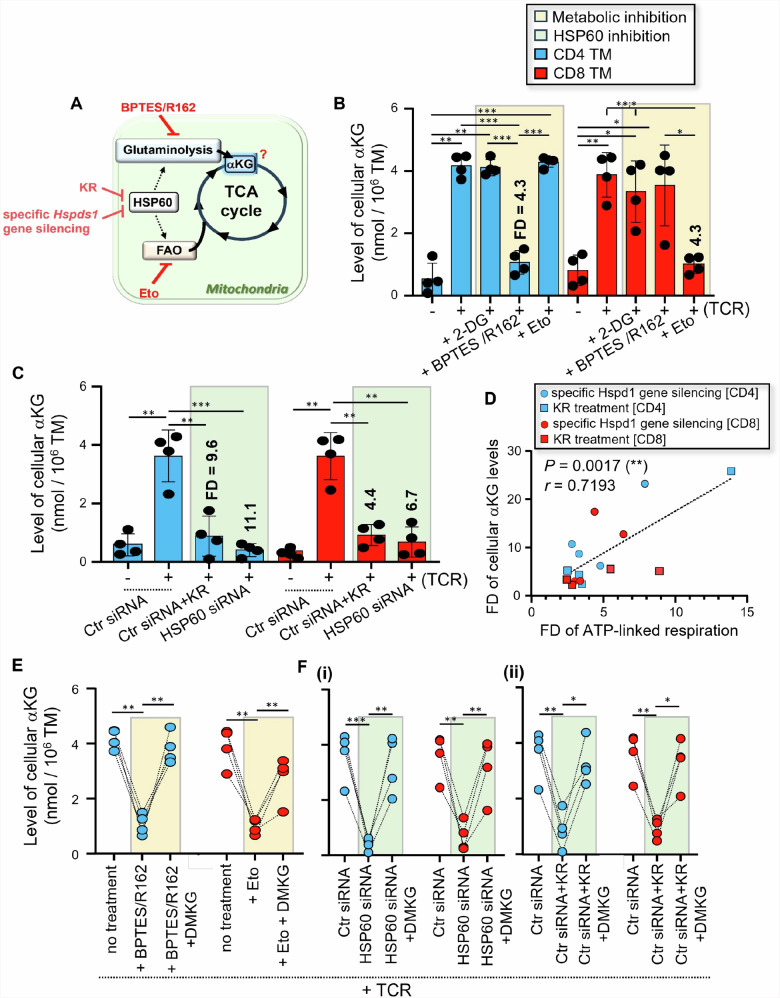
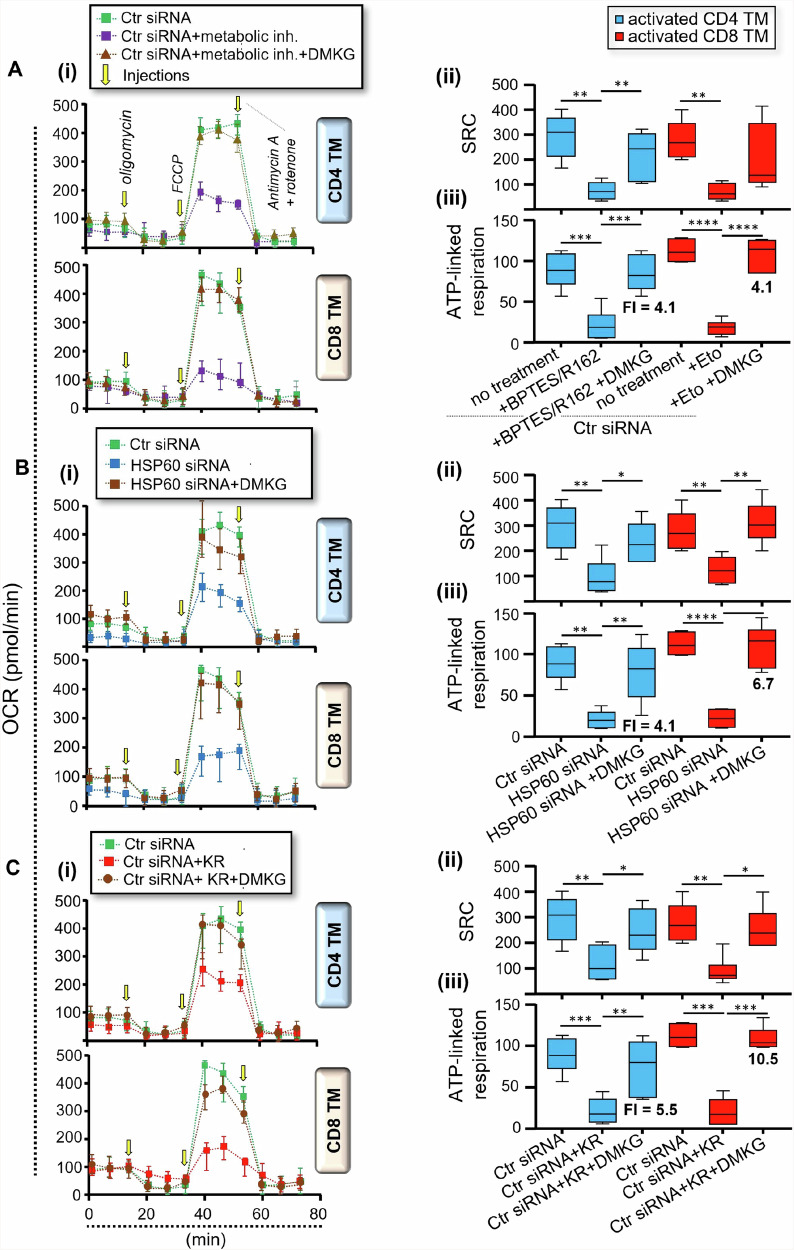
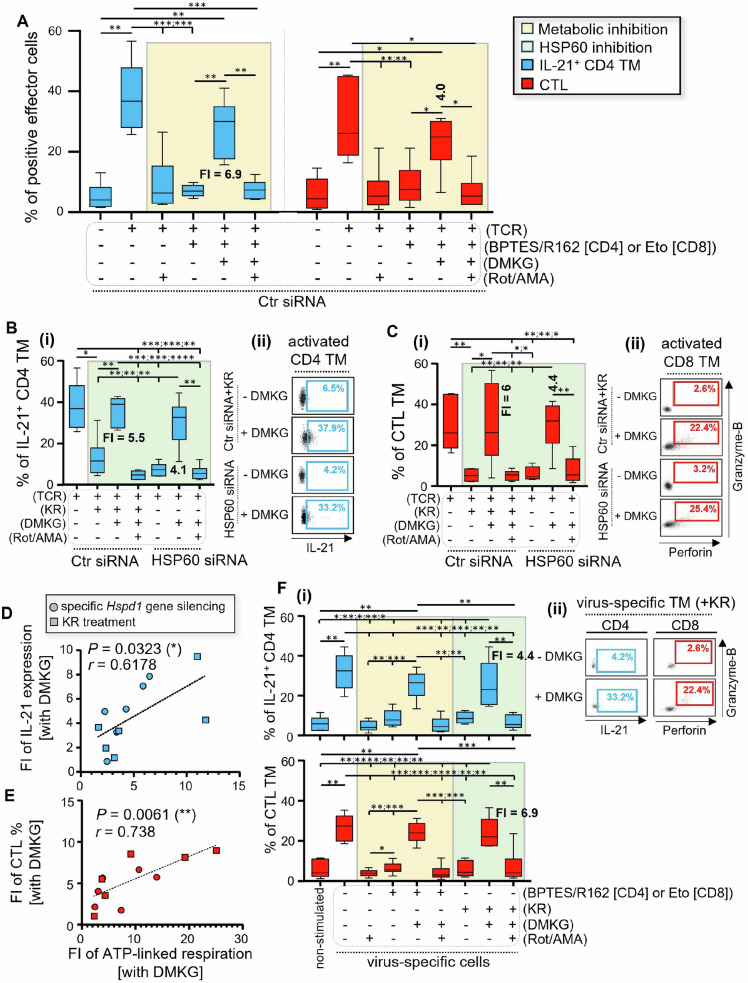
We have shown that virus-specific CD4 and CD8 memory T cells (TM) induce autophagy after T cell receptor (TCR) engagement to provide free glutamine and fatty acids, including in people living with HIV-1 (PLWH). These nutrients fuel mitochondrial ATP generation through glutaminolysis and fatty acid oxidation (FAO) pathways, to fulfill the bioenergetic demands for optimal IL-21 and cytotoxic molecule production in CD4 and CD8 cells, respectively. Here, we expand our knowledge on how the metabolic events that occur in the mitochondria of virus-specific TM down-stream of the autophagy are regulated. We show that HSP60 chaperone positively regulates the protein levels for multiple glutaminolysis- and FAO-related enzymes, thereby actively fueling the levels of cellular alpha-ketoglutarate (αKG) and related mitochondrial ATP-dependent antiviral T cell immunity in both CD4 and CD8 TM. Finally, we provide a way to rescue defective ATP generation in mitochondria and dependent effector functions in virus-specific TM including anti-HIV-1 protective responses, when HSP60 expression is impaired after TCR engagement in patients, in the form of dimethyl 2-oxoglutarate (DMKG) supplementation.


Conflict of interest statement

Competing interests: The authors declare no competing interests.

Figures

Fig. 1
Fig. 1. Mitochondrial HSP60 expression increases in CD4 and CD8 TM after TCR engagement in an HSF1-dependent manner.
Briefly, we either activated PBMC with anti-CD3/CD28 Abs or we did not. A Cells were then collected at 6, 12, 24, 48 and 72 hours of culture to assess the percentages (%) of HSP60+ CD4 and CD8 T cells. B % of HSP60 positivity in total, CD45RA+ naïve (TN), and CD45RAneg memory (TM) CD4 and CD8 T cells at 24 hours of culture [selected for maximum HSP60 expression in activated TM]. Fold increases (FI) of HSP60 expression in T cells after TCR engagement are also indicated in bold. FI = [% of HSP60 positivity in activated T cells] / [% of HSP60 positivity in non-activated T cells]. C FI of HSP60 expression in different CD4 and CD8 TM subsets at 24 hours post-T cell activation with quantitative values indicated in bold. D Protein levels of mitochondrial CPT2, cytosolic PMP70, and HSP60 in mitochondria (M) and cytosol fractions (C) in activated TM. Data shown are (i) the representative blots and (ii) relative protein levels calculated with Image J software. Protein % of the overall pool within M or C are also indicated in bold. E % of active HSF1 pS326+ CD4 and CD8 TM at 24 hours of culture [after normalization with total HSF1 expression]. FI of HSF1 pS326 expression in T cells after TCR engagement are also indicated in bold. F Correlation between FI of HSF1 pS326 and HSP60 expression at 24 hours post-activation. N = 12 TM. G % of HSF1 pS326+ and H HSP60+ CD4 and CD8 TM at 24 hours post-activation, w/wo specific Hsf1 gene silencing and KR. AE, G, H Results represent the mean relative ± SD of n = 6, except for D with n = 3. Of note, representative black histograms of HSP60, HSF1 (total and active pS326 forms), including their respective grey isotype controls are also shown for CD4 and CD8 TM at 24 hours of culture w/wo TCR engagement.
Fig. 2
Fig. 2. HSF1-dependent HSP60 increase is also confirmed in virus-specific CD4 and CD8 TM after peptide stimulation.
Briefly, PBMC were antigen-specifically stimulated or not with viral peptide pools and anti-CD28 Abs for 24 hours, w/wo KR. A IFN-γ-based gating strategy to define virus-specific (virus-sp.) CD4 and CD8 TM after 24 hours of peptide stimulation, along with their non-stimulated cell counterparts. % of IFN-γ+ virus-sp. cells in CD4 and CD8 TM at 24 hours of peptide stimulation are also indicated in bold. B % of HSF1 pS326 [after normalization with HSF1 expression] and C HSP60 positivity in virus-sp. CD4 and CD8 TM w/wo KR, and in non-stimulated cells at 24 hours of culture (mean ± SD; n = 6); Fold increases (FI) of protein expression in CD4 and CD8 TM after 24 hours of viral peptide stimulation are also indicated in bold. FI of protein expression was calculated as follows: [% of protein positivity in virus-specific TM] / [% of protein positivity in non-stimulated TM]. Of note, representative black histograms of HSF1 (total and pS326 forms) and HSP60 are also shown for virus-sp. ± KR, and non-stimulated TM. D Correlation between FI of HSF1 pS326 and HSP60 expression after 24 hours of peptide stimulation. N = 12 virus-sp. TM.
Fig. 3
Fig. 3. HSP60 controls the levels of mitochondrial ATP generation in activated CD4 TM through glutaminolysis.
A Schematic of glutaminolysis [mitochondrial conversion of glutamine to αKG], which is supported by GLS and GDH1 enzymes and can be inhibited with BPTES and R162 drugs (indicated in red). B–I Briefly, purified CD4 TM were pre-transfected with Ctr siRNA or HSP60 siRNA or were not, after which they were cultivated w/wo anti-CD3 and CD28 Abs for 24 hours. B % of HSP60+ CD4 TM including no electroporation (no-elect.) control as well as cell transfection conditions with Ctr siRNA or HSP60 siRNA at 24 hours of culture. Inhibition % of HSP60 expression for specific Hspd1 silencing is indicated in bold. Representative black histograms are also shown for activated CD4 TM w/wo specific Hspd1 gene silencing including the grey isotype control. C Representative GLS and GDH1 blots in CD4 TM including β-actin at 24 hours of culture (from 6 independent experiments). D Assessment of cellular glutamate concentrations by Bioluminescence-based assay at 24 hours of culture [with R162 treatment]. Inhibition % of glutamate concentrations that are driven by specific Hspd1 silencing is also indicated in bold. E Correlation between cellular glutamate concentrations and relative GLS protein levels at 24 hours post-activation. N = 18 CD4 TM. F–I Assessment of whole mitochondrial respiration in activated CD4 TM w/wo specific Hspd1 gene silencing. KR treatment as well as glutaminolysis inhibition by BPTES/R162 were also conducted on Ctr siRNA-transfected cells. F Representative respiratory kinetics for each study condition. G Spare respiratory capacity (SRC) and H ATP-linked respiration determined in pmol/min. I Correlation between levels of mitochondrial ATP-linked respiration and (i) GLS or (ii) GDH1 protein levels, or (iii) cellular glutamate concentrations at 24 hours post-activation. N = 18 CD4 TM w/wo specific Hspd1 gene silencing. B, D, G, H Results shown are the mean relative ± SD of n = 6.
Fig. 4
Fig. 4. HSP60 is a key regulator of the FAO-driven mitochondrial ATP generation in activated CD8 TM.
A Schematic of FAO [mitochondrial conversion of fatty acids], which is supported by several metabolic enzymes. This includes the CPT1A inhibitor etomoxir (Eto) in red. BJ Purified CD8 TM were pre-transfected with Ctr siRNA or HSP60 siRNA or were not, after which they were cultivated w/wo anti-CD3 and CD28 Abs for 24 hours. B % of HSP60+ CD8 TM including no electroporation (no-elect.) control as well as cell transfection conditions with Ctr siRNA or HSP60 siRNA at 24 hours of culture. Inhibition % of HSP60 expression for specific Hspd1 silencing is indicated in bold. Representative black histograms are also shown for activated CD8 TM w/wo specific Hspd1 gene silencing including the grey isotype control. C Representative CPT2, ECHS1, HADH, and MCAD blots in CD8 TM including β-actin at 24 hours of culture (from 6 independent experiments). DF Assessment of whole mitochondrial respiration in activated CD8 TM w/wo specific Hspd1 gene silencing, KR and Eto. D Representative respiratory kinetics for each study condition. E SRC and F ATP-linked respiration determined in pmol/min. GI Assessment of FAO-mediated mitochondrial respiration, by using Seahorse XF Palmitate Oxidation Stress test kit and long-chain palmitate substrate. G Representative respiratory kinetics of activated CD8 TM w/wo specific Hspd1 gene silencing, and when the nutrient restriction step was conducted either with palmitate-BSA substrate or BSA alone. H FAO-mediated SRC and I FAO-mediated ATP-linked respiration in pmol/min. Of note, FAO-mediated values were calculated as follows: [value with palmitate-BSA] – [value with BSA alone]. J Correlation between the whole and FAO-mediated ATP-linked respiration at 24 hours post-activation. N = 12 CD8 TM w/wo specific Hspd1 gene silencing. B, E, F, H, I Results shown are the mean relative ± SD of n = 6.
Fig. 5
Fig. 5. HSP60 regulates mitochondrial ATP-dependent IL-21 cytokine and cytotoxic molecule production in virus-specific TM.
A, B Purified CD4 and CD8 TM were pre-transfected with Ctr siRNA or HSP60 siRNA or were not, after which they were cultivated w/wo anti-CD3/CD28 Abs for 24 hours, w/wo KR, 2-DG, BPTES/R162 and Eto. A % of IL-21+ CD4, and B Perforin+Granzyme-B+ CTL TM at 24 hours of culture. Results shown are (i) the mean ± SD of n = 6, and (ii) representative dot plots of IL-21 expression in activated CD4, and of Perforin/Granzyme-B dual-staining in CD8 TM, when cells were cultivated w/wo specific Hspd1 gene silencing and KR. Fold decreases (FD) of T cell effector functions in the presence of glutaminolysis, FAO and HSP60 inhibition are also indicated in bold. C Proportion of CXCR5+CXCR3neg Tfh and non-Tfh cells [CXCR5neg and CXCR5+CXCR3+ cells] whitin IL-21-producing CD4 TM at 24 hours post-activation. D, E Correlation between FD of mitochondrial ATP-linked respiration and those of the % of D IL-21+ CD4 TM, or E CTL TM at 24 hours post-activation. N = 12 TM per figure. F, G Briefly, PBMC were stimulated or not with viral peptides for 24 hours, w/wo KR and metabolic inhibitors [2-DG, BPTES/R162 and Eto]. F At 24 hours of culture, virus-specific cells were assessed for their % of IL-21+ virus-specific CD4 and CTL TM. FD of virus-specific effector functions are also indicated in bold. G Proportion of Tfh and non-Tfh cells in IL-21-producing virus-specific CD4 TM at 24 hours post-peptide stimulation. A–C, F, G Results are the mean ± SD of n = 6.
Fig. 6
Fig. 6. HSP60 inhibition in both CD4 and CD8 TM leads to reduced endogenous αKG levels after TCR engagement.
A Assessment in activated CD4 and CD8 TM of their cellular levels of TCA intermediate αKG in the context of glycolysis, glutaminolysis, FAO and HSP60 inhibition. B Purified CD4 and CD8 TM were activated or not with anti-CD3/CD28 Abs for 24 hours w/wo metabolic inhibitors [2-DG, BPTES/R162, Eto and Rot/AMA]. Then, we assessed the cellular αKG levels both in CD4 and CD8 TM for each study condition. Fold decreases (FD) of cellular αKG levels, when CD4 and CD8 TM were activated with BPTES/R162 and Eto, respectively, are also indicated in bold. C Purified TM were pre-transfected with Ctr siRNA or HSP60 siRNA, after which they were activated or not with anti-CD3/CD28 Abs for 24 hours w/wo KR. Results represent the cellular levels of αKG in non-activated and activated CD4 and CD8 TM w/wo HSP60 inhibition, and also include the FD of αKG levels when TM were activated in the presence of specific Hspd1 gene silencing and KR. D Correlation between FD of αKG levels and ATP-linked respiration at 24 hours post-activation. N = 16 activated TM w/wo specific Hspd1 gene silencing and KR. E Cellular αKG levels in BPTES/R162-treated CD4 and Eto-treated CD8 TM, when cells were T cell activated for 24 hours w/wo DMKG. F Cellular αKG levels in HSP60-depleted CD4 and CD8 TM, when cells were T cell activated for 24 hours w/wo DMKG; (i) Specific Hspd1 gene silencing, and (ii) KR treatment. A–C, E, F Data shown are the mean ± SD of n = 4.
Fig. 7
Fig. 7. DMKG rescues the reduced levels of mitochondrial ATP generation in TM when activated in the presence of HSP60 inhibition.
Briefly, purified CD4 and CD8 TM were pre-transfected with Ctr siRNA or HSP60 siRNA, after which they were T cell activated with anti-CD3/CD28 Abs for 24 hours w/wo BPTES/R162 [CD4], Eto [CD8], KR and DMKG. At 24 hours post-activation, CD4 and CD8 TM were collected to assess the mitochondrial SRC and ATP-linked respirations. Data shown are the metabolic assessments that were conducted on A Ctr siRNA-transfected TM w/wo metabolic inhibitors (metabolic inh.) and DMKG, B TM w/wo specific Hspd1 gene silencing and DMKG, and C Ctr siRNA-transfected TM w/wo KR and DMKG. AC (i) Representative respiratory kinetics for each study condition, (ii) SRC and (iii) ATP-linked respiration (pmol/min). Fold increases (FI) of mitochondrial ATP-linked respiration in activated TM with DMKG supplementation are also indicated in bold. Results shown for (ii, iii) are expressed as the mean ± SD of n = 6.
Fig. 8
Fig. 8. DMKG rescues ATP-dependent IL-21 and cytotoxic molecule production in virus-specific TM despite glutaminolysis, FAO and HSP60 inhibition.
A–E Purified CD4 and CD8 TM were pre-transfected with Ctr siRNA or HSP60 siRNA, after which they were T cell activated or not with anti-CD3/CD28 Abs w/wo BPTES/R162 [CD4], Eto [CD8], KR, DMKG and Rot/AMA. A % of IL-21-producing CD4 TM and B CTL in Ctr siRNA-transfected TM were determined at 24 hours of cell culture w/wo metabolic inhibitors. Fold increases (FI) of T cell effector functions when DMKG was supplementing cell cultures are also indicated in bold. FI were calculated as follows: [% of effector TM with DMKG] / [% of effector TM without DMKG]. (C) IL-21 production in CD4 TM and, D Perforin and Granzyme-B co-expression in CTL, when 24 h-long of TCR engagement were conducted w/wo specific Hspd1 gene silencing, KR, DMKG and Rot/AMA. Results shown are (i)% of positive effector T cells, and (ii) representative dot plots in HSP60-depleted CD4 and CD8 TM w/wo DMKG supplementation. FI of these effector T cell functions in HSP60-depleted CD4 and CD8 TM with DMKG supplementation are also indicated in bold. D, E Correlations between FI of ATP-linked respiration and those of D IL-21 production in CD4, or E Perforin/Granzyme-B dual-staining in CD8 TM with DMKG supplementation. N = 12 activated TM w/wo specific Hspd1 gene silencing and KR at 24 hours of culture. F PBMC were stimulated or not with viral peptides for 24 hours w/wo glutaminolysis or FAO inhibition, and w/wo KR, DMKG and Rot/AMA. (i)% of IL-21+ CD4 and CTL T cells in non-stimulated and virus-specific TM at 24 hours of culture. FI of T cell effector functions in virus-specific CD4 and CD8 TM with DMKG supplementation are also indicated in bold. (ii) representative dot plots for virus-specific IL-21+ CD4 and CTL TM, when cells were virally stimulated with KR and w/wo DMKG. A–C, F, Data shown are expressed as the mean ± SD of n = 6.

References

    1. Chapman, N. M. & Chi, H. Metabolic adaptation of lymphocytes in immunity and disease. Immunity55, 14–30 (2022). - DOI - PMC - PubMed
    1. Geltink, R. I. K., Kyle, R. L. & Pearce, E. L. Unraveling the Complex Interplay Between T Cell Metabolism and Function. Annu Rev. Immunol.36, 461–488 (2018). - DOI - PMC - PubMed
    1. Shyer, J. A., Flavell, R. A. & Bailis, W. Metabolic signaling in T cells. Cell Res.30, 649–659 (2020). - DOI - PMC - PubMed
    1. Wik, J. A. & Skalhegg, B. S. T Cell Metabolism in Infection. Front Immunol.13, 840610 (2022). - DOI - PMC - PubMed
    1. Cham, C. M., Driessens, G., O’Keefe, J. P. & Gajewski, T. F. Glucose deprivation inhibits multiple key gene expression events and effector functions in CD8+ T cells. Eur. J. Immunol.38, 2438–2450 (2008). - DOI - PMC - PubMed

MeSH terms

LinkOut - more resources