. 2024 Dec 21;23(1):452.
doi: 10.1186/s12933-024-02545-z.

ANXA1-FPR2 axis mitigates the susceptibility to atrial fibrillation in obesity via rescuing AMPK activity in response to lipid overload

Affiliations

ANXA1-FPR2 axis mitigates the susceptibility to atrial fibrillation in obesity via rescuing AMPK activity in response to lipid overload

Peng Liu et al. Cardiovasc Diabetol. .

Abstract

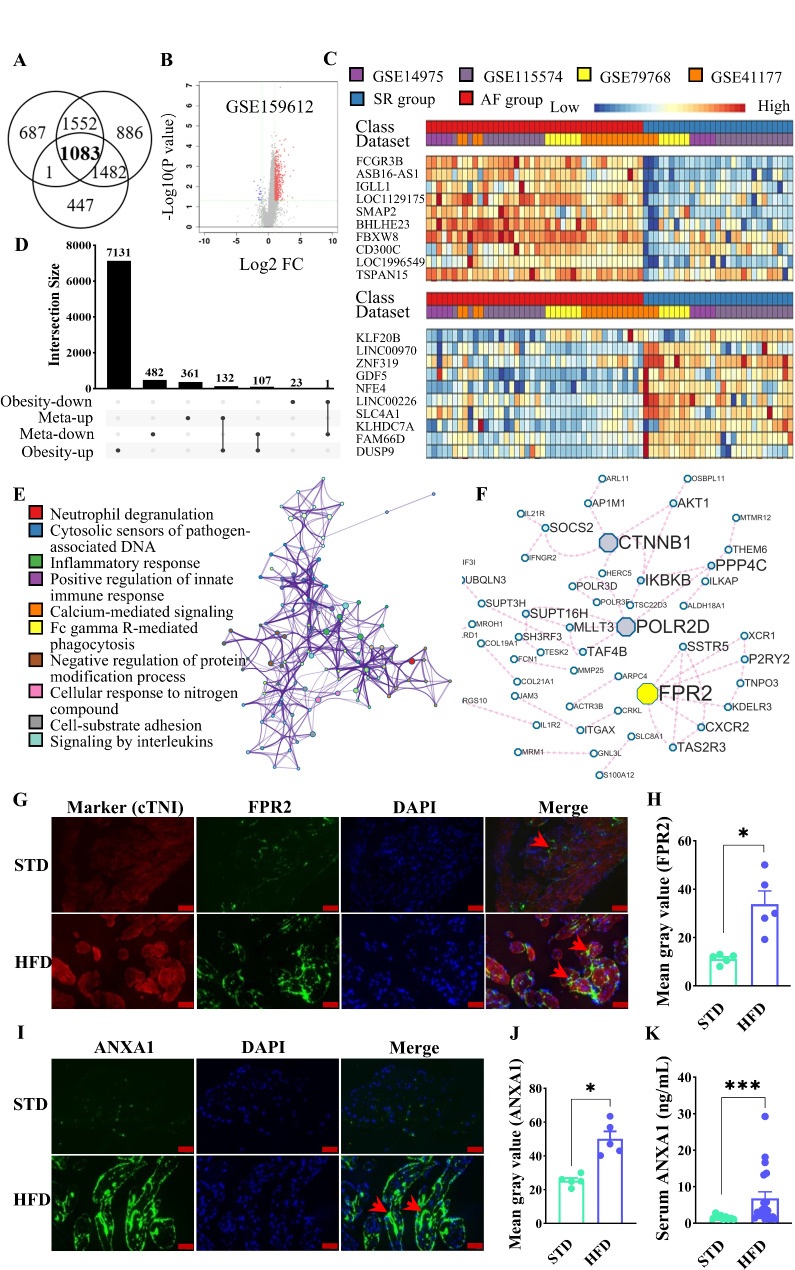
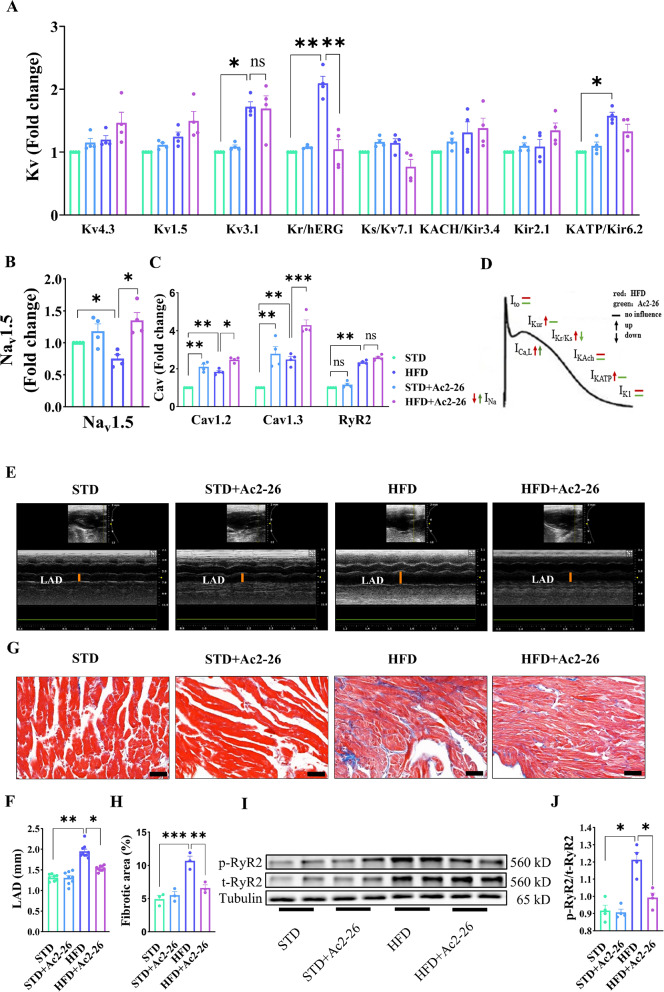
Atrial fibrillation (AF) is the most prevalent arrhythmia in clinical practice, and obesity serves as a significant risk factor for its development. The underlying mechanisms of obesity-related AF remain intricate and have yet to be fully elucidated. We have identified FPR2 as a potential hub gene involved in obesity-related AF through comprehensive analysis of four transcriptome datasets from AF patients and one transcriptome dataset from obese individuals, and its expression is up-regulated in both AF and obese individuals. Interestingly, ANXA1, the endogenous ligand of FPR2, was found to exhibit differential expression with AF and obesity. Specifically, it was observed to be down-regulated in AF patients but up-regulated in obese individuals. The susceptibility to AF in obese mice induced by high-fat diet (HFD) was increased following with the FPR2 blocker Boc-2.The administration of exogenous ANXA1 active peptide chain Ac2-26 can mitigate the susceptibility to AF in obese mice by attenuating atrial fibrosis, lipid deposition, oxidative stress injury, and myocardial cell apoptosis. However, this protective effect against AF susceptibility is reversed by AAV9-shAMPK-mediated AMPK specific knockdown in the myocardium. The vitro experiments demonstrated that silencing ANXA1 exacerbated lipid deposition, oxidative stress injury, and apoptosis induced by palmitic acid (PA) in cardiomyocytes. Additionally, Ac2-26 effectively mitigated myocardial lipid deposition, oxidative stress injury, and apoptosis induced by PA. These effects were impeded by FPR2 inhibitors Boc-2 and WRW4. The main mechanism involves the activation of AMPK by ANXA1 through FPR2 in order to enhance fatty acid oxidation in cardiomyocytes, thereby ultimately leading to a reduction in lipid accumulation and associated lipotoxicity. Our findings demonstrate that the ANXA1-FPR2 axis plays a protective role in obesity-associated AF by alleviating metabolic stress in the atria of obese mice, thereby emphasizing its potential as a promising therapeutic target for AF.

Keywords: AMP-activated protein kinase; ANXA1-FPR2; Atrial fibrillation; Lipotoxicity; Obesity.


Conflict of interest statement

Declarations. Competing interests: The authors declare no competing interests.

Figures

Fig. 1
Fig. 1
Identification and validation of hub genes in obesity-related AF. A The DEGs were identified through Fisher’s method (p <.05), fixed effects model (p <.001), and Vote Counting (Votes number < 2 and p <.05). Subsequently, the robust DEGs between the AF and control groups were identified by intersecting the DEGs obtained from each model algorithm. B The volcano plot display DEGs in obesity patients and the control group. C The heat map displays the top 10 significantly up-regulated and down-regulated DEGs between patients with AF and controls. D 133 DEGs with the same expression trend in AF and obesity patients. E Construction of PPI network and F hub gene screening. G, H Representative sections and quantification of FPR2 using immunofluorescence staining in the atrium of obese mice. I, J Representative sections and quantification of ANXA1 using immunofluorescence staining in the atrium of obese mice. K The concentration of ANXA1 in the serum of mice in each group. Data are shown as mean ± SEM. *p <.05; *** p <.001 between indicated groups. n = 5 for immunofluorescence staining analysis. The scale bar = 50 μm. AF, atrial fibrillation; DEGs, differentially expressed genes; PPI, protein–protein interaction
Fig. 2
Fig. 2
The administration of Ac2-26 improves insulin resistance and reduces susceptibility to AF in obese mice induced by HFD. A Experimental design of this study. Mice were randomly divided into four groups: STD group, STD + Ac2-26 group, HFD group, and HFD + Ac2-26 group. B Weight gain curve and C the change of body weight. D Representative ECGs showing AF induction by transesophageal burst pacing. E AF frequency and F AF duration were assessed between the groups. G Fasting blood glucose, H random blood glucose, and I fasting serum insulin among groups. J HOMA-IR (insulin resistance index) were calculated. K GTT and L calculated AUC among groups. Data are shown as mean ± SEM. *p <.05; **p <.01; *** p <.001 between indicated groups. n = 6–14 for animal experiments. AF, atrial fibrillation; AUC, area under the curve; HFD, high‐fat diet; HOMA‐IR, homeostasis model assessment of insulin resistance; GTT, glucose tolerance test
Fig. 3
Fig. 3
AMPK is a key target for Ac2-26 to improve AF susceptibility in obese mice. A Weight gain curve and B the change of body weight. Fasting blood glucose (C), GTT (D) and (E) calculated AUC among groups. F Representative ECGs showing AF induction by transesophageal burst pacing. G AF frequency and H AF duration were assessed between the groups. I-L Echocardiography and Masson staining showed that Ac2-26 did not improve atrial enlargement and fibrosis in AAV9-shAMPK group compared with AAV9-shNC group. Data are shown as mean ± SEM. *p <.05 between indicated groups. n = 3–10 for animal experiments. The scale bar = 50 μm. AF, atrial fibrillation; AAV, Adeno-associated virus; AUC, area under the curve; HFD, high-fat diet; GTT, glucose tolerance test; LAD, left atrial dimension
Fig. 4
Fig. 4
Effect of Ac2-26 on atrial remodeling in obese mice. A-C Transcriptional profile of AF-related sodium channel (Nav1.5), calcium channels (Cav1.2, Cav1.3 and RyR2), and potassium channels (Kv4.3, Kv1.5, Kv3.1, Kr/hERG, Ks/Kv7.1, KACH/Kir3.4, Kir2.1, and KATP/Kir6.2) among groups (n = 4). D Typical shape of an atrial action potential showing principle currents and the corresponding subunits (ion channels). E-H The echocardiography and Masson staining results revealed left atrial enlargement and a significant increase in fibrosis in obese mice, whereas Ac2-26 exhibited a notable improvement in structural remodeling (n = 3–9). I, J The administration of Ac2-26 resulted in a significant reduction in the phosphorylation level of RyR2 in obese mice (n = 4). Data are shown as mean ± SEM. *p <.05; **p <.01; *** p <.001 between indicated groups. The scale bar = 50 μm. HFD, high‐fat diet; RyR2, ryanodine receptor 2; LAD, left atrial dimension
Fig. 5
Fig. 5
The promotion of fatty acid oxidation by Ac2-26 may potentially mitigate lipotoxicity in atrial myocytes of obese mice. A, B The tunel staining analysis revealed that Ac2-26 significantly attenuated apoptosis in atrial myocytes of obese mice (n = 3). C-G The Western blot analysis demonstrated that Ac2-26 significantly attenuated the expression of pro-apoptotic protein molecules in obese mice (n = 4). H, I Representative sections and quantification of lipid accumulation using Oil Red O staining (n = 3). J-L Transcriptional profile of, glucose metabolism-related genes (GLUT1, GLUT4, HK2, PFKM, PKM2, and PDK4), fatty acid metabolism‐related genes (CD36, FABPpm, FABP3, and CPT1B) and metabolism regulatory genes (HIF1α, PGC1α, FOXO1, PPARα, PPARγ and PPARδ) among groups (n = 4). M-Q Representative images and Western blot analysis of Acc, AMPK, CPT1B and PPARα among groups (n = 4). Data are shown as mean ± SEM. *p <.05; **p <.01; *** p <.001 between indicated groups. The scale bar = 50 μm. AMPK, AMP‐activated protein kinase; Acc, Acetyl-CoA carboxylase; CD36, fatty acid translocase; CPT1B, carnitine palmitoylransferase-1B; FABP-pm, plasma membrane fatty acid-binding protein; FABP3, fatty acid binding protein 3; FOXO1, forkhead box protein O1, GLUT, glucose transporter; HFD, high‐fat diet; HIF1α, hypoxia inducible factor-1α; HK2, hexokinase2; PDK4, pyruvate dehydrogenase kinase 4; PFKM, phosphofructokinase; PGC1α, peroxisome proliferator-activated receptor γ coactivator1α; PKM2, pyruvate kinase isozyme type M2; PPAR, peroxisome proliferators-activated receptor
Fig. 6
Fig. 6
ANXA1 knockdown aggravates PA-induced lipotoxicity in cardiomyocytes. A-C Determination of ANXA1 knockdown efficiency by RT-qPCR and Western blot (n = 4). D Experimental design of cell experiments. E, F Representative images and statistical analysis of flow cytometry-detected apoptosis level (n = 3). (G, H) Representative images and analysis of the subcellular localization of the oxidation products of DHE (n = 100). I, J Representative images and analysis of the mitochondrial membrane potential detected by JC-1 staining (red/green) (n = 100). (K-L) Cellular MDA and SOD concentrations among the groups (n = 5). M-T Representative images and Western blot analysis of t-RyR2, Acc, Ampk, CPT1B, PPARα and caspase3 among the groups (n = 4). Data are shown as mean ± SEM. *p <.05; **p <.01; *** p <.001 between indicated groups. The scale bar = 50 μm. AMPK, AMP‐activated protein kinase; Acc, Acetyl-CoA carboxylase; BSA, bovine serum albumin; CPT1B, carnitine palmitoylransferase-1B; DHE, dihydroethidium; MDA, malondialdehyde; PA, palmitic acid; PPAR, peroxisome proliferators-activated receptors; RyR2, ryanodine receptor 2; RT‐qPCR, quantitative reverse transcription‐PCR; SOD, superoxide dismutase
Fig. 7
Fig. 7
ANXA1 attenuates PA-induced lipotoxicity via FPR2. A Experimental design of cell experiments. B-C Representative images and statistical analysis of flow cytometry-detected apoptosis level (n = 4). D, E Representative images and analysis of the subcellular localization of the oxidation products of DHE (n = 100). F, G Representative images and analysis of the mitochondrial membrane potential detected by JC-1 staining (red/green) (n = 100). H, I Cellular MDA and SOD concentrations among the groups (n = 3). J-Q Representative images and Western blot analysis of Acc, Ampk, CPT1B, PPARα, caspase3 and RyR2 among the groups (n = 4). Data are shown as mean ± SEM. *p <.05; **p <.01; *** p <.001 between indicated groups. The scale bar = 50 μm. AMPK, AMP-activated protein kinase; Acc, Acetyl-CoA carboxylase; BSA, bovine serum albumin; CPT1B, carnitine palmitoylransferase-1B; DHE, dihydroethidium; MDA, malondialdehyde; PA, palmitic acid; PPAR, peroxisome proliferators-activated receptors; RyR2, ryanodine receptor 2; SOD, superoxide dismutase
Fig. 8
Fig. 8
AMPK functions as a pivotal effector molecule within the ANXA1-FPR2 signaling pathway. A Experimental design of cell experiments. B-G Representative images and statistical analysis were conducted to assess the levels of apoptosis detected by flow cytometry, as well as the oxidation products of DHE and JC-1 staining (red/green) (n = 4-100). H, I Cellular MDA and SOD concentrations among the groups (n = 3). J-P Representative images and Western blot analysis of Acc, Ampk, CPT1B, PPARα, caspase3 and RyR2 among the groups (n = 4). Q Proposed model of ANXA1-mediated protection against lipid accumulation and lipotoxicity. Data are shown as mean ± SEM. *p <.05; **p <.01; *** p <.001 between indicated groups. The scale bar = 50 μm. AMPK, AMP-activated protein kinase; Acc, Acetyl-CoA carboxylase; BSA, bovine serum albumin; CD36, fatty acid translocase; CPT1B, carnitine palmitoylransferase-1B; DHE, dihydroethidium; FABP-pm, plasma membrane fatty acid-binding protein; HFD, high‐fat diet; MDA, malondialdehyde; PA, palmitic acid; PPAR, peroxisome proliferators-activated receptors; RyR2, ryanodine receptor 2; SOD, superoxide dismutase

Similar articles

Cited by

References

    1. Kornej J, Börschel CS, Benjamin EJ, Schnabel RB. Epidemiology of atrial fibrillation in the 21st century: novel methods and new insights. Circul Res. 2020;127(1):4–20. - PMC - PubMed
    1. Brundel B, Ai X, Hills MT, Kuipers MF, Lip GYH, de Groot NMS. Atrial fibrillation. Nat Rev Dis Primers. 2022;8(1):21. - PubMed
    1. Pascual F, Coleman RA. Fuel availability and fate in cardiac metabolism: a tale of two substrates. Biochim Biophys Acta. 2016;1861(10):1425–33. - PMC - PubMed
    1. Harada M, Melka J, Sobue Y, Nattel S. Metabolic considerations in atrial fibrillation: mechanistic insights and therapeutic opportunities. Circ J Off J Jpn Circ Soc. 2017;81(12):1749–57. - PubMed
    1. Barth AS, Tomaselli GF. Cardiac metabolism and arrhythmias. Circ Arrhythm Electrophysiol. 2009;2(3):327–35. - PMC - PubMed

Publication types

MeSH terms