. 2025 Jan 28;44(1):115091.
doi: 10.1016/j.celrep.2024.115091. Epub 2024 Dec 21.

Transcriptional profile of the rat cardiovascular system at single-cell resolution

Affiliations

Transcriptional profile of the rat cardiovascular system at single-cell resolution

Alessandro Arduini et al. Cell Rep. .

Abstract

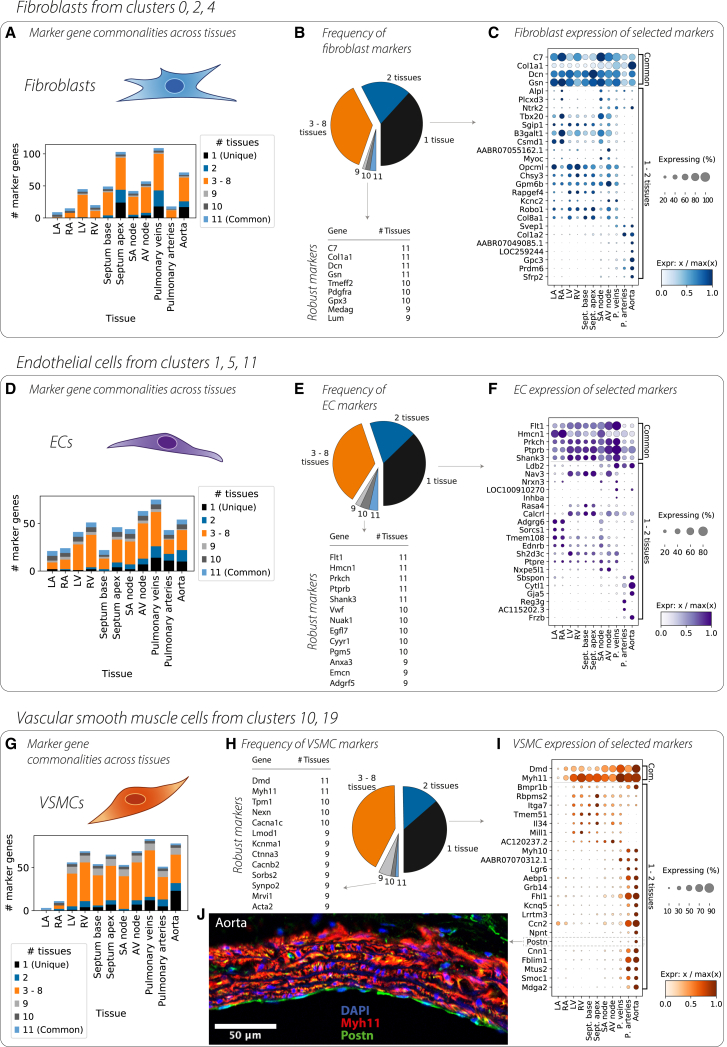
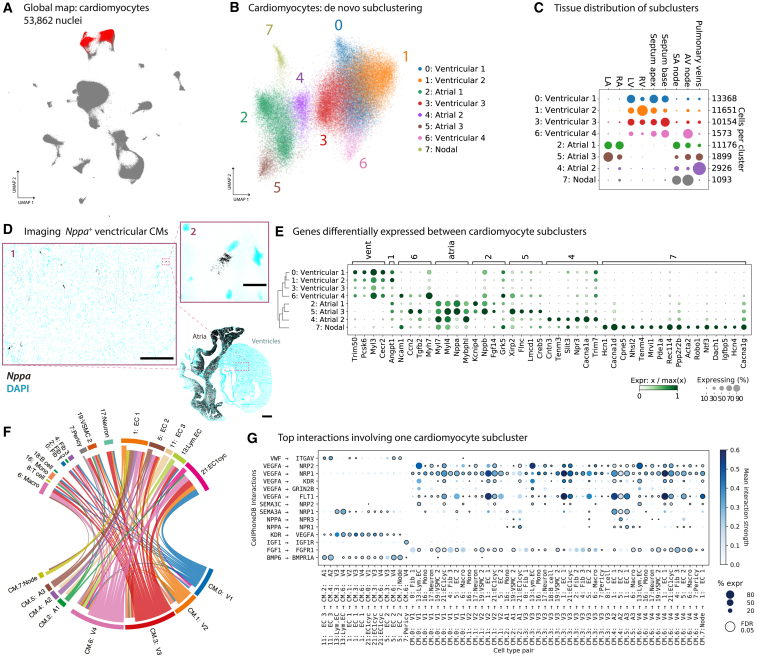
We sought to characterize cellular composition across the cardiovascular system of the healthy Wistar rat, an important model in preclinical cardiovascular research. We performed single-nucleus RNA sequencing (snRNA-seq) in 78 samples in 10 distinct regions, including the four chambers of the heart, ventricular septum, sinoatrial node, atrioventricular node, aorta, pulmonary artery, and pulmonary veins, which produced 505,835 nuclei. We identified 26 distinct cell types and additional subtypes, with different cellular composition across cardiac regions and tissue-specific transcription for each cell type. Several cell subtypes were region specific, including a subtype of vascular smooth muscle cells enriched in the large vasculature. We observed tissue-enriched cellular communication networks, including heightened Nppa-Npr1/2/3 signaling in the sinoatrial node. The existence of tissue-restricted cell types suggests regional regulation of cardiovascular physiology. Our detailed transcriptional characterization of each cell type offers the potential to identify novel therapeutic targets and improve preclinical models of cardiovascular disease.

Keywords: CP: Developmental biology; atrioventricular node; cardiovascular disease; cardiovascular system; cell-cell communication; genetics; heart; pulmonary vein; rat; single-nuclei RNA sequencing; single-nucleus RNA sequencing; sinoatrial node.


Conflict of interest statement

Declaration of interests C.K. is an employee of Bayer US LLC (a subsidiary of Bayer AG) and may own stock in Bayer AG. H.M. was an employee of the Broad Institute at the time of project completion and is now an employee of STEMCELL Technologies. A.-D.A., I.P., and C.M.S. were employees of Bayer US LLC (a subsidiary of Bayer AG) at the time of project completion. I.P. is now an employee at BioMarin Pharmaceuticals, Inc. A.-D.A. and C.M.S. are now full-time employees of Absci Corp. A.A. was an employee of the Broad Institute at the time of project completion and is now an employee of Bayer US LLC. G.G.-C. is a scientific cofounder of Riparian Pharmaceuticals. P.T.E. receives sponsored research support from Bayer AG, Bristol Myers Squibb, Pfizer. and Novo Nordisk; he has also served on advisory boards and/or consulted for Bayer AG.

Figures

None
Graphical abstract
Figure 1
Figure 1
Overview of study design and the cardiovascular cell atlas (A) Extensive tissue sampling of regions of the healthy Wistar rat cardiovascular system. Numbers denote the samples that passed quality control. (B) Map of all 505,835 nuclei measured in this study. Clustering was performed using the Leiden algorithm with resolution 1.2 and revealed 27 distinct cell types, as well as several additional microclusters that do not separate out at this clustering resolution. (C) Dendrogram displaying a hierarchy of cluster relationships. (D) Composition of each tissue region in terms of cell type abundance. Cell types are grouped into a few coarse-grained categories. Dot sizes are normalized so that each column sums to 1. (E) Composition of each tissue region in terms of cell type. Dot sizes are normalized so that each column sums to 1. (F) Location of each cell type. Dot sizes are further normalized so that each row sums to 1. (G) RNAscope imaging of Nppa (black) in a whole heart section. Scale bar, 1 mm. (H) RNAscope validates the presence of cluster 5: EC2 in the LA and its relative absence in the LV, which is expected based on the data in (E) and (F). Cemip2 (red) and Bmp6 (green) are enriched markers for EC2, while Flt1 (white) is a general EC marker. Tissue was counterstained with the nuclear marker DAPI (blue). Regions 1, 2, and 3 are shown in (G).
Figure 2
Figure 2
Differences in marker genes across tissues Differential expression tests for one cell type versus all other cells were conducted separately in each tissue. (A) Breakdown of FB marker genes in each tissue, showing the number of unique as well as shared markers. (B) Pie chart shows the proportion of markers that were tissue unique versus common and lists the marker genes common to nearly all tissues. (C) Dot plot contrasts the common marker genes (top) with genes found to be markers in only one or two tissues. Genes are prioritized based on a second differential expression test of one tissue versus all others, within FB cells, and the genes with the most variability across tissues are shown. (D–F) Same analysis for ECs. (G–I) Same analysis for VSMCs. (J) Immunostaining shows Postn+ (green)/Myh11+ (red) VSMCs in the aorta.
Figure 3
Figure 3
Cell-cell communication and its variability across the cardiovascular system (A) Putative cell-cell interactions, computed separately for each sample and then aggregated over samples, are shown as a chord diagram, where chords are colored by the cell type that secretes the ligand, and the width of each chord is proportional to the number of significant interactions that surpass some minimum interaction strength. (B) Dot plot that highlights cell-cell interactions that vary greatly by tissue. Rows represent particular interactions, each of which is annotated by the ligand-receptor interaction as well as the cell-type clusters involved. Mean interaction strength for the ligand-receptor interaction is denoted by dot color. Dot size is a p value for enrichment computed from a Wilcoxon test for differences in interaction strengths across tissues. The top five (or fewer) significant interactions for each tissue are shown, comprising a small part of a much longer list. The red, green, and blue dashed boxes highlight interactions that are examined in (C)–(E). (C) The interaction of Nppa from cluster 9, ACM, → Npr1 from cluster 11, EC3, which shows a pattern of atrial enrichment and is highest in the SAN. Error bars represent the standard deviation across samples. (D) Similar plot for Vegfb from cluster 17, Neur → Flt1 from cluster 1, EC1. This shows enrichment in the AVN and PV. (E) Similar plot for the interaction of Bmp6 from cluster 11, EC3, → Bmpr1b from cluster 13, lymphatic EC, which is enriched in the aorta.
Figure 4
Figure 4
High-resolution subclusters of cardiomyocytes (CMs) (A) All high-quality CMs from the global UMAP are shown in red. (B) De novo subclustering of the CMs reveals a large amount of transcriptional variability, here shown as a UMAP. (C) Distribution of the CM subclusters across tissues. Dot sizes sum to one in each row. (D) RNAscope validation showing that there is an exceedingly small number of Nppa-positive CMs in the ventricles. Scale bar on full heart section, 1 mm. Inset 1 scale bar, 300 μm. Inset 2 scale bar, 20 μm and shows one such cell. (E) Dot plot showing top differentially expressed genes across CM subclusters. The nodal pacemaker cells from subcluster 7 have many marker genes. (F) Chord diagram showing top cell-cell interactions involving CMs, broken down by CM subcluster. Chord width is proportional to the number of significant ligand-receptor interactions, and chords are colored by the cell type that secretes the ligand. (G) Dot plot showing the top ligand-receptor interactions from (F). Dot color denotes the interaction strength, while dot size is computed as (fraction sender cells expressing ligand) × (fraction receiver cells expressing receptor) × 100. Black edge on dots denotes that an interaction is significant at a false discovery rate of 0.05 according to CellPhoneDB.
Figure 5
Figure 5
Cardiac conduction: nodal and neuronal cell populations (A) UMAP of all 108,063 nuclei from the SAN and AVN, clustered and annotated. Cluster 16 captures the nodal pacemaker CMs. (B) Representation of clusters in the SAN and AVN. (C) Volcano plot shows the results of a differential expression test between the nodal pacemaker CMs and atrial CMs. Both cell types are present in the same samples, eliminating confounding batch effects. (D) Subclustering of all 5,790 neuronal cells from the atlas yields six subtypes. (E) Distribution of neuronal subtypes across cardiovascular tissues. (F) Top marker genes for each neuronal subtype. (G) A few canonical markers of the sympathetic and parasympathetic nervous system. (H) Immunofluorescence imaging of Mpz+ (green) subcluster 3, the myelinating Schwann cells in PV tissue. Tissue was counterstained with the nuclear marker DAPI (blue) and the CM marker Myom1 (red). Myelinating Schwann cells make contact with CMs. Scale bar, 100 μm. (I) The genes Apod and Sorbs1 are expressed in different subsets of neuronal subcluster 2. (J) RNAscope image (white background) of tissue section containing LA and PV, stained for Apod (green) and Dcn (red; FB marker). Tissue was counterstained with the nuclear marker DAPI (blue). Inset shows groups of Apod+ cells. Full field of view scale bar, 1 mm, and the inset scale bar, 100 μm.
Figure 6
Figure 6
Distinct transcriptional subtypes of ECs in the vasculature (A) Pseudo-bulk variation in EC transcription. Each dot is the summed expression of all ECs from one sample. Coloring by tissue shows that the PA and Ao samples clearly separate from other tissues in the top principal component. (B) Subclustering of the ECs from PV, PA, and Ao samples reveals seven subtypes. (C) Marker genes of each subcluster show clear distinctions. (D) Dendrogram shows that subclusters 1 and 2, the large artery and large vein ECs, are part of the same clade. (E) The EC composition of PV, PA, and Ao shows that the arteries are quite different from PV. (F) UMAPs where each point is one cell, and all ECs from all tissues are shown. In each UMAP, all cells are shown in light gray, overlaid by cells present in the tissue specified. Colors correspond to the vascular subclusters from (B).
Figure 7
Figure 7
Distinct subtypes of VSMCs in the vasculature (A) Pseudo-bulk variation in VSMC transcription. Each dot is the summed expression of all VSMCs from one sample. Coloring by tissue shows that the PA and Ao samples clearly separate from other tissues in the top principal component. (B) Subclustering of the VSMCs from PV, PA, and Ao samples reveals two subtypes. (C) Marker genes of each subcluster show clear distinctions. (D) Dot plot showing the expression of a few canonical contractile and synthetic genes in each subcluster. (E) Dot plot highlighting a few potassium and calcium channel genes, which show different patterns of expression in the two subclusters. (F) Distribution of the two VSMC subclusters in PV, PA, and Ao shows that subcluster 1 is nearly absent from PA and Ao. (G) UMAPs show all VSMCs from all tissues in light gray, with tissue-specific VSMCs highlighted in black for heart and subcluster color (blue or orange) for PV, PA, and Ao. (H) Immunofluorescence imaging of Acta2 (all VSMCs), Cnn1 (subcluster 0), and Cdh6 (subcluster 1) confirms the presence of these cells in PV, PA, and Ao. Subcluster 1 makes up a larger share of VSMCs in PV, in agreement with (F).

Update of

References

    1. Tucker N.R., Chaffin M., Fleming S.J., Hall A.W., Parsons V.A., Bedi K.C., Jr., Akkad A.D., Herndon C.N., Arduini A., Papangeli I., et al. Transcriptional and Cellular Diversity of the Human Heart. Circulation. 2020;142:466–482. - PMC - PubMed
    1. Plass M., Solana J., Wolf F.A., Ayoub S., Misios A., Glažar P., Obermayer B., Theis F.J., Kocks C., Rajewsky N. Cell type atlas and lineage tree of a whole complex animal by single-cell transcriptomics. Science. 2018;360 - PubMed
    1. Chaffin M., Papangeli I., Simonson B., Akkad A.D., Hill M.C., Arduini A., Fleming S.J., Melanson M., Hayat S., Kost-Alimova M., et al. Single-nucleus profiling of human dilated and hypertrophic cardiomyopathy. Nature. 2022;608:174–180. - PubMed
    1. Litviňuková M., Talavera-López C., Maatz H., Reichart D., Worth C.L., Lindberg E.L., Kanda M., Polanski K., Heinig M., Lee M., et al. Cells of the adult human heart. Nature. 2020;588:466–472. - PMC - PubMed
    1. Efremova M., Vento-Tormo M., Teichmann S.A., Vento-Tormo R. CellPhoneDB: inferring cell–cell communication from combined expression of multi-subunit ligand–receptor complexes. Nat. Protoc. 2020;15:1484–1506. - PubMed

Publication types

Associated data