. 2024 Dec 23;22(1):296.
doi: 10.1186/s12915-024-02097-4.

Chronic sleep deprivation disturbs energy balance modulated by suprachiasmatic nucleus efferents in mice

Affiliations

Chronic sleep deprivation disturbs energy balance modulated by suprachiasmatic nucleus efferents in mice

Tingting Du et al. BMC Biol. .

Abstract

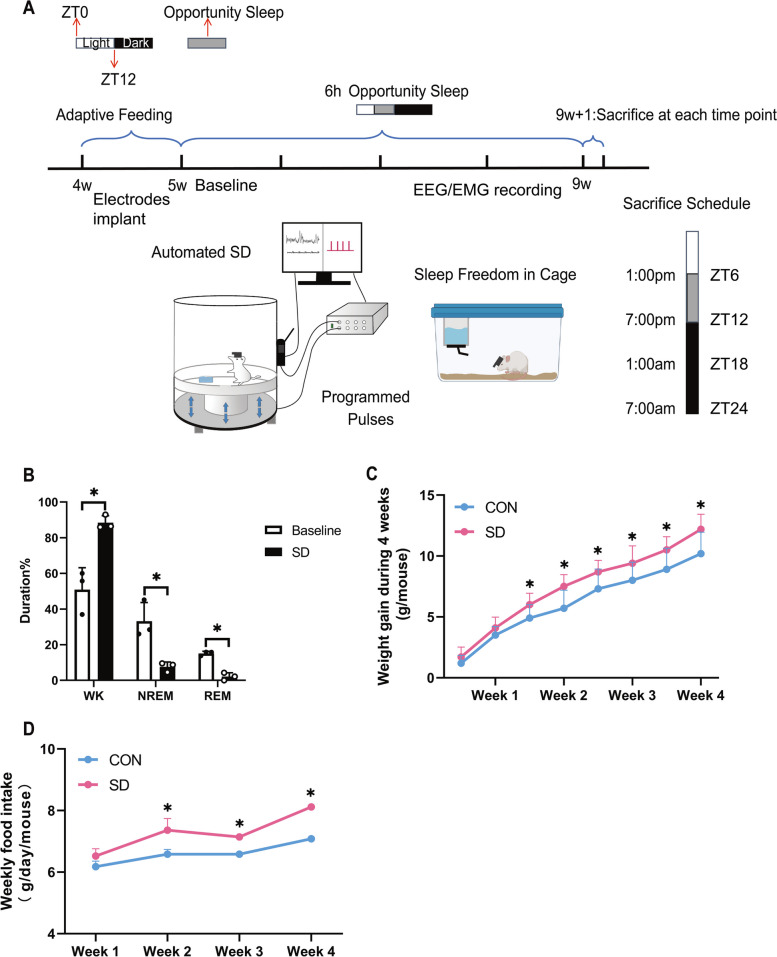
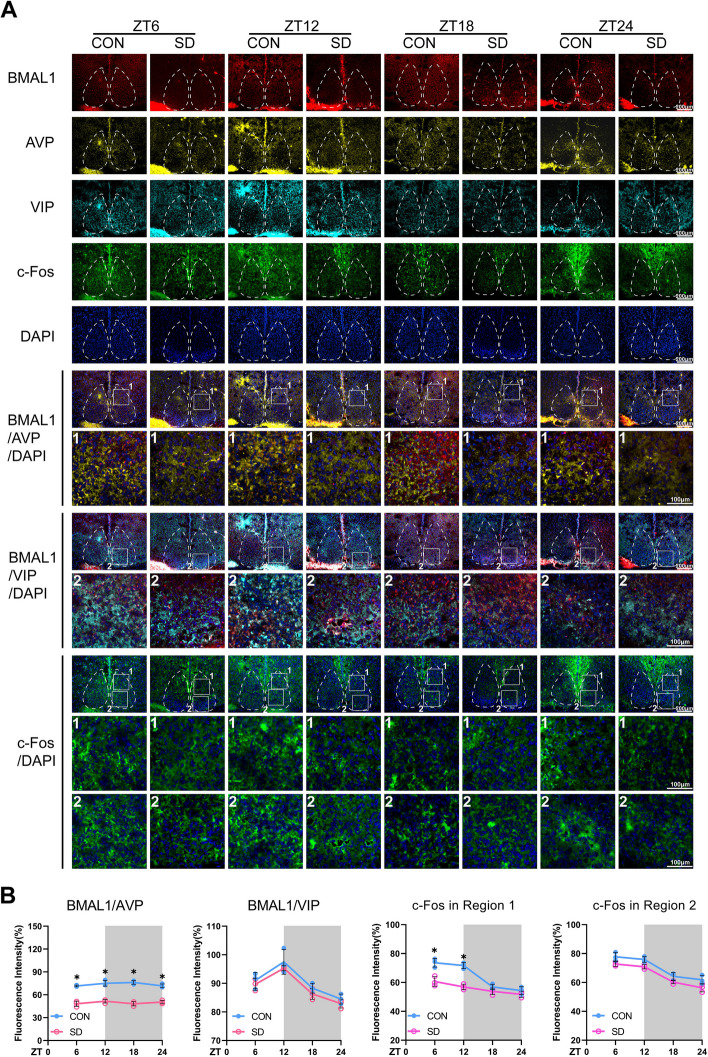
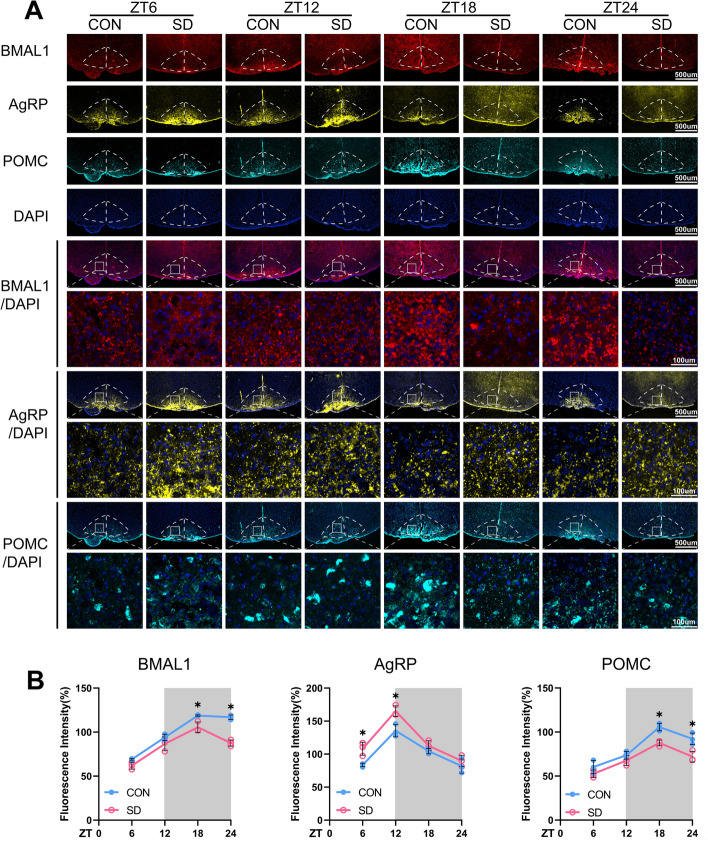
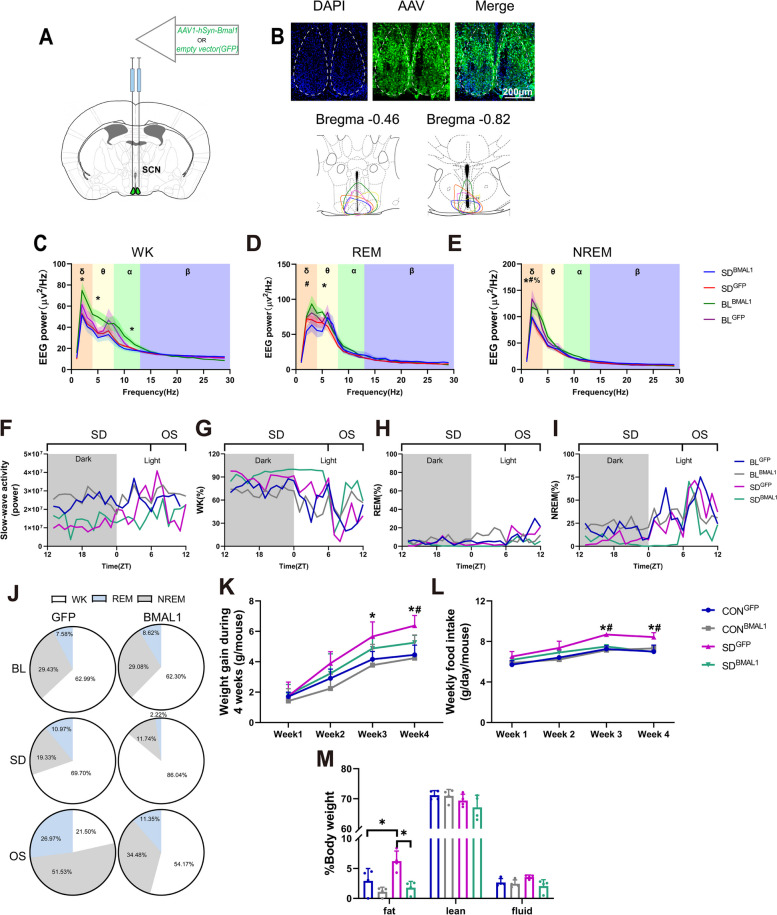
Background: Epidemiologic researches show that short sleep duration may affect feeding behaviors resulting in higher energy intake and increased risk of obesity, but the further mechanisms that can interpret the causality remain unclear. The circadian rhythm is fine-tuned by the suprachiasmatic nucleus (SCN) as the master clock, which is essential for driving rhythms in food intake and energy metabolism through neuronal projections to the arcuate nucleus (ARC) and paraventricular nucleus (PVN).

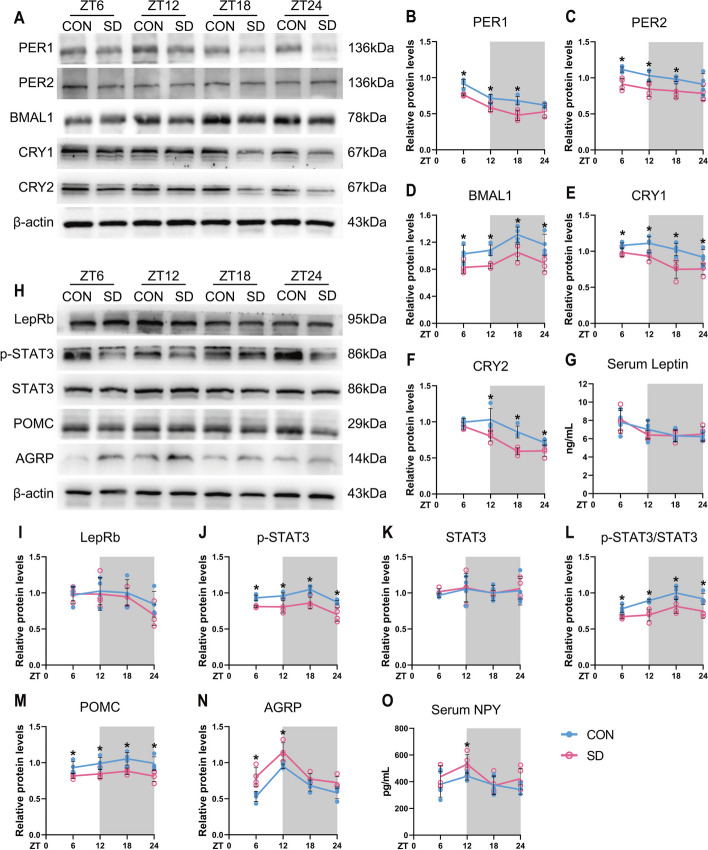
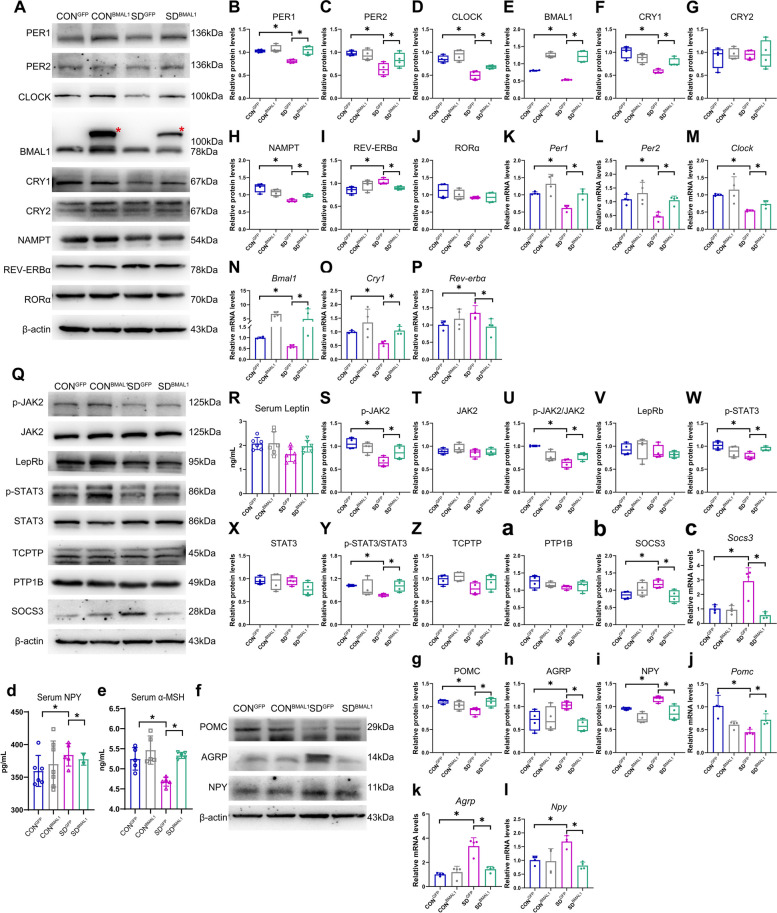
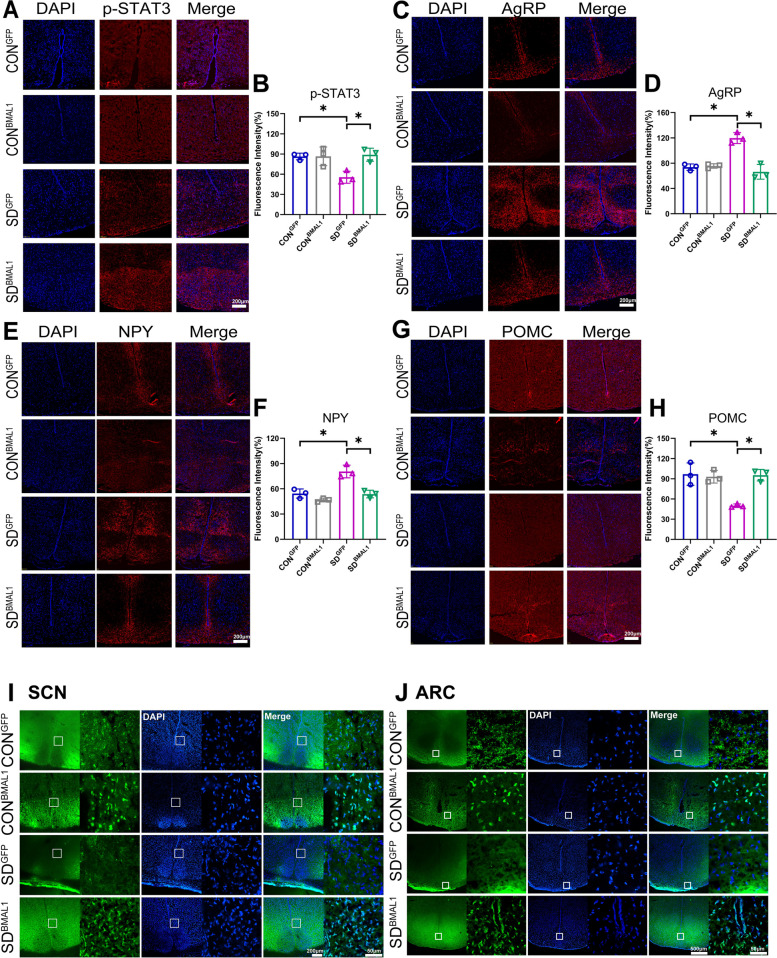
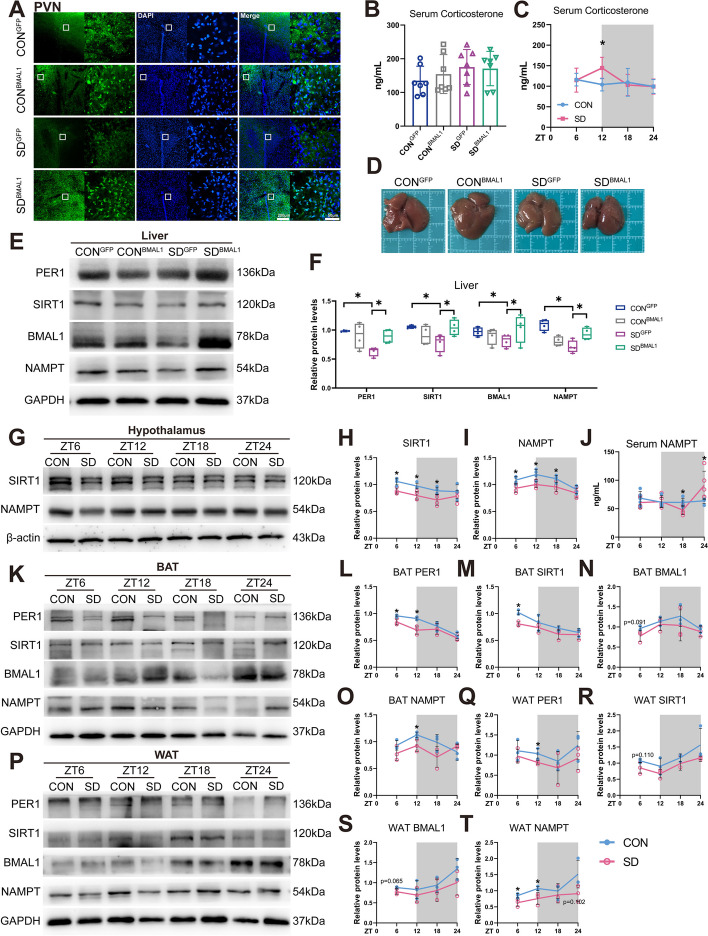
Results: We showed that chronic SD-induced aberrant expressions of AgRP/NPY and POMC attributed to compromised JAK/STAT3 signals and reduced energy expenditure in the mice, which can be rescued with AAV-genetic overexpression of BMAL1 into SCN. The potential mechanism may be related to the disruptions of SCN efferent mediated by BMAL1.

Conclusions: Chronic SD impairs energy balance through directly dampening BMAL1 expression, probably in the transcription level, in the SCN, which in turn affects the neuron projections to ARC and PVN. Remarkably, we provide evidence that may explain the causal mechanisms associated with sleep curtailment and obesity in adolescents.

Keywords: BMAL1; Chronic sleep deprivation; Energy expenditure; Food intake; SCN.


Conflict of interest statement

Declarations. Ethics approval and consent to participate: This study was approved by the Ethics Committee of China Medical University (KT2022384), following the National Institutes of Health Guide for the Care and Use of Laboratory Animals. Consent for publication: All authors consent for this manuscript to be published. Competing interests: The authors declare that they have no competing interests.

Figures

Fig. 1
Fig. 1
Chronic sleep deprivation-induced aberrant feeding behavior. A Experimental design and timeline. B Changes of different sleep stages duration after sleep deprivation for 4 weeks (n = 3) and presented as bar graphs. EEG data were recorded on the last sleep deprivation day. Significant difference (single asterisk) was defined as p < 0.05 by a two-sided unpaired t-test. C Line chart, weekly body weight gain during chronic sleep deprivation (n = 10). Significant difference (single asterisk) was defined as p < 0.05 by two-way repeated-measures ANOVA and pairwise comparisons. D Line chart, weekly food intake during chronic sleep deprivation (n = 12, 3 mice per cage for distribution). Significant difference (single asterisk) was defined as p < 0.05 by two-way repeated-measures ANOVA and pairwise comparisons. Data were represented as means + standard deviations for B, C, and D. Data were presented as the means ± standard deviations. NREM, non-rapid eye movement; REM, rapid eye moment; SD, sleep deprivation group, mice received 4 weeks of sleep deprivation (18 h/day); CON, control group. ZT, Zeitgeber time
Fig. 2
Fig. 2
Chronic sleep deprivation changed expressions of circadian clock genes and appetite-related peptides in the hypothalamus. A Western blot analysis, the typical blots of circadian clocks in the entire hypothalamus. B–F Relative protein levels for circadian clocks in the entire hypothalamus. β-actin was used as an internal control. The band intensities were quantified using Image J software and presented as line charts to show relative quantification (n = 4 mice/group/time point). G Line chart, serum leptin concentrations in CON and SD mice at 6-h intervals after 4-week sleep deprivation (n = 4 mice/group/time point). H Western blot analysis, the typical blots of appetite-related peptides in the entire hypothalamus. I-N. Relative protein levels for appetite-related peptides in the entire hypothalamus. β-actin was used as an internal control. The band intensities were quantified using Image J software and presented as line graphs to show relative quantification (n = 4 mice/group/time point). O Line chart, serum NPY concentrations in CON and SD mice at 6-h intervals after 4-week sleep deprivation (n = 5 mice/group/time point). The white part represented the light phase and the gray part represented the dark phase. Significant difference (single asterisk) was defined as p < 0.05 by two-way repeated-measures ANOVA and pairwise comparisons. Data were presented as the means ± standard deviations for the line charts. Mice were sacrificed at 6-h intervals across the 12:12 light/dark cycle (ZT0, 7:00 am). CON, control group; SD, sleep deprivation group, mice received 4 weeks of sleep deprivation (18 h/day); ZT, Zeitgeber
Fig. 3
Fig. 3
Chronic sleep deprivation changed the in situ expressions of BMAL1 and c-Fos in the SCN. A Representative immunofluorescence (IF) staining for BMAL1 (red), AVP (yellow), VIP (cyan), c-Fos (green), and DAPI (blue) (scale bars = 500 μm) and merged images of BMAL1/AVP/DAPI, BMAL1/VIP/DAPI, and c-Fos/DAPI (scale bars, upper, 500 μm; lower, 100 μm) in the SCN of the mice in CON and SD group at each time point. The number 1 represented the shell region, and the number 2 represented the core region of the SCN. B The average IF intensities of BMAL1 co-stained with AVP or VIP, and the average IF intensities of c-Fos were determined by Image J software and presented as line charts (n = 3). Mean intensity = integrated density in co-staining area/area of AVP (or VIP). The white part represented the light phase, and the gray part represented the dark phase. Data were presented as the means ± standard deviations. Significant difference (single asterisk) was defined as p < 0.05 by two-way repeated-measures ANOVA and pairwise comparisons. Mice were sacrificed at 6-h intervals across the 12:12 light/dark cycle (ZT0, 7:00 am). CON, control group; SD, sleep deprivation group, mice received 4 weeks of sleep deprivation (18 h/day); ZT, Zeitgeber time
Fig. 4
Fig. 4
Chronic sleep deprivation changed in situ expressions of AgRP and POMC in the ARC. A Representative immunofluorescence (IF) staining for BMAL1 (red), AgRP (yellow), POMC (cyan), and DAPI (blue) (scale bars = 500 μm), and merged images of BMAL1 and DAPI, AgRP and DAPI, POMC and DAPI (scale bars, upper, 500 μm; lower, 100 μm) in the ARC of the mice in CON and SD group at each time point. B The average IF intensities of BMAL1, AgRP, and POMC were determined by Image J software and presented as bar graphs (n = 3). Mean intensity = integrated density/area. The white part represented the light phase and the gray part represented the dark phase. Data were presented as the means ± standard deviations. Significant difference (single asterisk) was defined as p < 0.05 by two-way repeated-measures ANOVA and pairwise comparisons. Mice were sacrificed at 6-h intervals across the 12:12 light/dark cycle (ZT0, 7:00 am). CON, control group; SD, sleep deprivation group, mice received 4 weeks of sleep deprivation (18 h/day); ZT, Zeitgeber time
Fig. 5
Fig. 5
Chronic sleep deprivation changed sleep behavior. A Viral injection, empty vector/AAV1-hSyn-Bmal1 was injected at the shell of SCN bilaterally in the mice. B Schematic timeline. C Representative images showing GFP, DAPI, and merged images in the SCN, and schematic showing dissection neurons. D–F. EEG power during wakefulness (WK), rapid eye movement (REM), and non-rapid eye movement (NREM) (n = 4 for BLGFP, n = 5 for BLBMAL1, n = 6 for SDGFP and SDBMAL1). Single asterisk, BLBMAL1 vs. SDBMAL1 p < 0.05; percent, BLGFP vs. SDGFP p < 0.05; number sign, SDGFP vs. SDBMAL1 p < 0.05 by one-way ANOVA. G A representative 24-h recording of slow-wave activity (SWA), and SWA is plotted as the power of the mean activity during NREM over 24 h. H–J Representative hourly amounts of sleep during a constant 24-h. K Representative pie chart for sleep distribution during 24-h baseline (BL), 18-h sleep deprivation (SD), and 6-h opportunity sleep (OS). L Weight gain during 4 weeks of sleep deprivation (18 h/day) (n = 8). Single asterisk was defined as p < 0.05 by two-way repeated-measures ANOVA with Tukey’s post hoc test. Data were represented as means + standard deviations for L, M, and N. M Weekly food intake during 4 weeks of sleep deprivation (18 h/day) (n = 8, 2 or 3 mice per cage for distribution). Single asterisk was defined as p < 0.05 by two-way repeated-measures ANOVA with Tukey’s post hoc test. N Body composition after chronic sleep deprivation (n = 4). BLGFP, mice received injection of AAV-GFP before sleep deprivation; BLBMAL1, mice received injection of AAV-BMAL1 before sleep deprivation; CONGFP, the control group with empty vector; CONBMAL1, the control group with AAV-genetic overexpression of BMAL1; SDGFP, the chronic SD group with empty vector; SD.BMAL1, the chronic SD with AAV-genetic overexpression of BMAL1
Fig. 6
Fig. 6
Compensation of BMAL1 in SCN rescued compromised molecular clocks induced by chronic sleep deprivation. A The typical blots of circadian clocks in the entire hypothalamus. The red asterisk represented as AAV-genetic compensation of BMAL1 in the SCN. B–J. Relative protein levels for circadian clocks in the entire hypothalamus. β-actin was used as an internal control (n = 4). The band intensities were quantified using Image J software and presented as box graphs to show relative quantification for B–J, S–Z, a–b, and g–i. Data were presented as the means ± standard deviations. K–P. Relative mRNA levels for circadian clocks in the entire hypothalamus. β-actin was used as an internal control (n = 4). Data were represented as means + standard deviations for K–P and j–l and presented as bar graphs to show relative quantification. Q The typical blots of JAK2/STAT3 signal pathway in the hypothalamus. R Serum leptin concentrations (n = 6). The serum indicators were presented as bar graphs with means + standard deviations. S–Z and a–b. Relative protein levels for JAK2/STAT3 signal pathway in the entire hypothalamus. β-actin was used as an internal control (n = 4). c Relative mRNA levels for SOCS3 in the entire hypothalamus (n = 4). Data were represented as means + standard deviations. d, e Serum NPY and α-MSH concentrations (n = 5). f–i The typical blots of POMC, AgRP, and NPY in the entire hypothalamus and relative protein levels in the entire hypothalamus. β-actin was used as an internal control (n = 4). j–l. Relative mRNA levels for POMC, AgRP, and NPY in the entire hypothalamus. β-actin was used as an internal control (n = 4). CONGFP, the control group with empty vector; CONBMAL1, the control group with AAV-genetic overexpression of BMAL1; SDGFP, the chronic SD group with empty vector; SDBMAL1, the chronic SD with AAV-genetic overexpression of BMAL1. Samples were taken at ZT6 (1:00 pm). Significant difference (single asterisk) was defined as p < 0.05 by one-way ANOVA
Fig. 7
Fig. 7
Compensation of BMAL1 rescued in situ expressions of p-STAT3 and appetite-related peptides in the ARC. A–B Representative immunofluorescence (IF) staining for p-STAT3, DAPI, and merged images in the ARC (scale bars = 200 μm). C–D Representative IF staining for AgRP, DAPI, and merged images in the ARC (scale bars = 200 μm). E–F Representative IF staining for NPY, DAPI, and merged images in the ARC (scale bars = 200 μm). G–H Representative IF staining for POMC, DAPI, and merged images in the ARC (scale bars = 200 μm). The average IF intensities were determined by Image J software and presented as bar graphs (n = 3) for A–H. Mean intensity = integrated density/area. I Representative autofluorescence (green), DAPI, and merged images in the SCN (scale bars, left, 200 μm; right, 50 μm). J Representative autofluorescence (green), DAPI, and merged images in the ARC (scale bars, left, 500 μm; right 50 μm). Data were presented as the means ± standard deviations. Significant difference (single asterisk) was defined as p < 0.05 by one-way ANOVA. CONGFP, the control group with empty vector; CONBMAL1, the control group with AAV-genetic overexpression of BMAL1; SDGFP, the chronic SD group with empty vector; SD.BMAL1, the chronic SD with AAV-genetic overexpression of BMAL1. Samples were taken at ZT6 (1:00 pm)
Fig. 8
Fig. 8
Chronic sleep deprivation-induced disruption of energy homeostasis and metabolic disorder. A Representative autofluorescence, DAPI, and merged images in the PVN. B Serum CORT concentrations (n = 7) in the intervention experiments and presented as the bar graph. Significant difference (single asterisk) was defined as p < 0.05 by one-way ANOVA. C Serum CORT concentrations in wild-type mice of CON and SD groups at 6-h intervals after 4-week sleep deprivation and presented as the line chart (n = 6 mice/group/time point). D Representative photograph of the autopsy of the liver in different groups. E Western blot detects changes in circadian clock expression in the liver. F Relative protein levels for circadian clock expression in the liver and presented as box graphs (n = 4). Significant difference (single asterisk) was defined as p < 0.05 by one-way ANOVA. G Representative Western blot for changes in SIRT1 and NAMPT protein levels in the entire hypothalamus. H, I Relative protein levels for SIRT1 and NAMPT in the entire hypothalamus and presented as line charts (n = 4 mice/group/time point). J Serum NAMPT concentrations in CON and SD mice at 6-h intervals after 4-week sleep deprivation (n = 5 mice/group/time point). K–O Representative Western blots and relative protein levels for PER1, SIRT1, BMAL1, and NAMPT in brown adipose tissue and presented as line charts (BAT) (n = 3 mice/group/time point). P–T Representative Western blots and relative protein levels for PER1, SIRT1, BMAL1, and NAMPT in white adipose tissue and presented as line charts (WAT) (n = 3 mice/group/time point). Significant difference between CON and SD at each time point was calculated by two-way repeated-measures ANOVA and pairwise comparisons (*p < 0.05). The white part represented the light phase and the gray part represented the dark phase (ZT0, 7:00 am). CONGFP, the control group with empty vector; CONBMAL1, the control group with AAV-genetic overexpression of BMAL1; SDGFP, the chronic SD group with empty vector; SD.BMAL1, the chronic SD with AAV-genetic overexpression of BMAL1

Similar articles

References

    1. Robbins R, Beebe DW, Byars KC, Grandner M, Hale L, Tapia IE, Wolfson AR, Owens JA. Adolescent sleep myths: identifying false beliefs that impact adolescent sleep and well-being. Sleep Health. 2022;8(6):632–9. - PMC - PubMed
    1. Owens JA, Weiss MR. Insufficient sleep in adolescents: causes and consequences. Minerva Pediatr. 2017;69(4):326–36. - PubMed
    1. Suglia SF, Kara S, Robinson WR. Sleep duration and obesity among adolescents transitioning to adulthood: do results differ by sex? J Pediatr. 2014;165(4):750–4. - PMC - PubMed
    1. Sun Q, Bai Y, Zhai L, Wei W, Jia L. Association between Sleep Duration and Overweight/Obesity at Age 7–18 in Shenyang, China in 2010 and 2014. Int J Environ Res Public Health. 2018;15(5):854. - PMC - PubMed
    1. Sun Q, Liu Y, Wei W, Wu D, Lin R, Wen D, Jia L. Chronic timed sleep restriction attenuates LepRb-mediated signaling pathways and circadian clock gene expression in the rat hypothalamus. Front Neurosci. 2020;14:909. - PMC - PubMed

Substances

LinkOut - more resources