

Molecular dissection of laboratory contamination between two schistosome populations
- PMID: 39710691
- PMCID: PMC11665219
- DOI: 10.1186/s13071-024-06588-9
Molecular dissection of laboratory contamination between two schistosome populations
Abstract
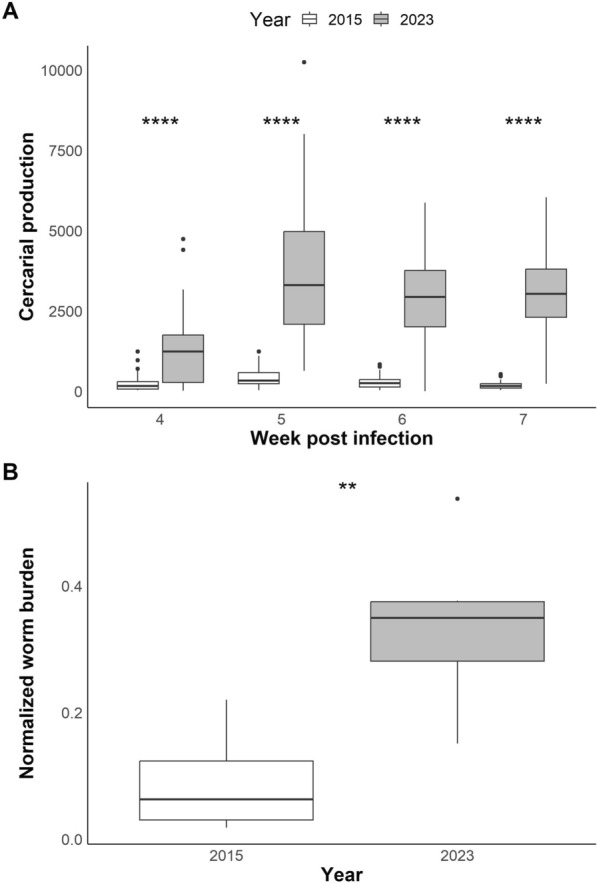
Background: Genomic analysis has revealed extensive contamination among laboratory-maintained microbes including malaria parasites, Mycobacterium tuberculosis, and Salmonella spp. Here, we provide direct evidence for recent contamination of a laboratory schistosome parasite population, and we investigate its genomic consequences. The Brazilian Schistosoma mansoni population SmBRE has several distinctive phenotypes, showing poor infectivity, reduced sporocyst number, low levels of cercarial shedding and low virulence in the intermediate snail host, and low worm burden and low fecundity in the vertebrate rodent host. In 2021 we observed a rapid change in SmBRE parasite phenotypes, with a 10-fold increase in cercarial production and fourfold increase in worm burden.
Methods: To determine the underlying genomic cause of these changes, we sequenced pools of SmBRE adults collected during parasite maintenance between 2015 and 2023. We also sequenced another parasite population (SmLE) maintained alongside SmBRE without phenotypic changes.
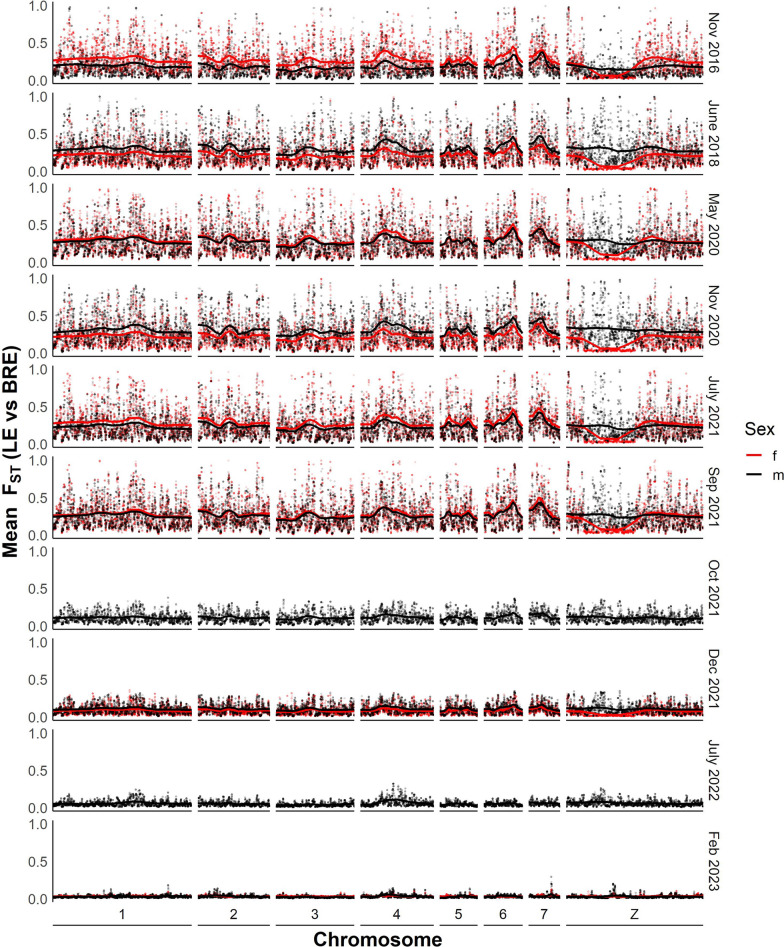
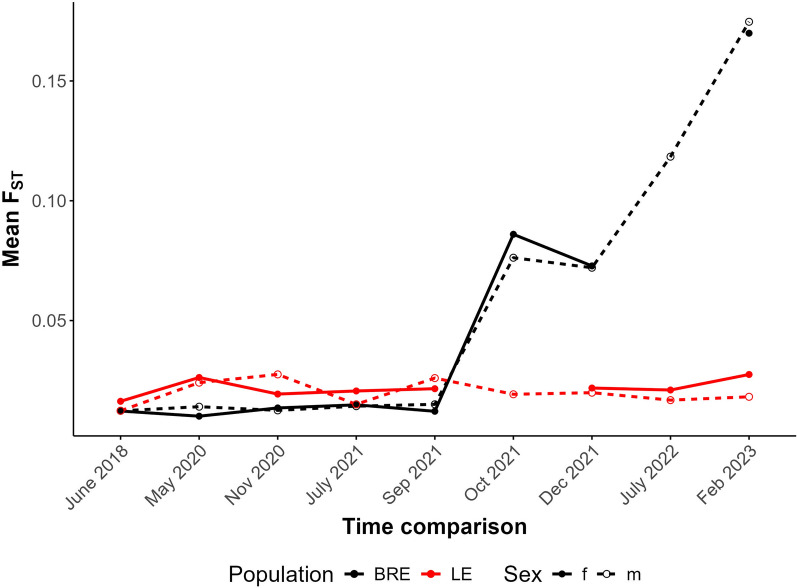
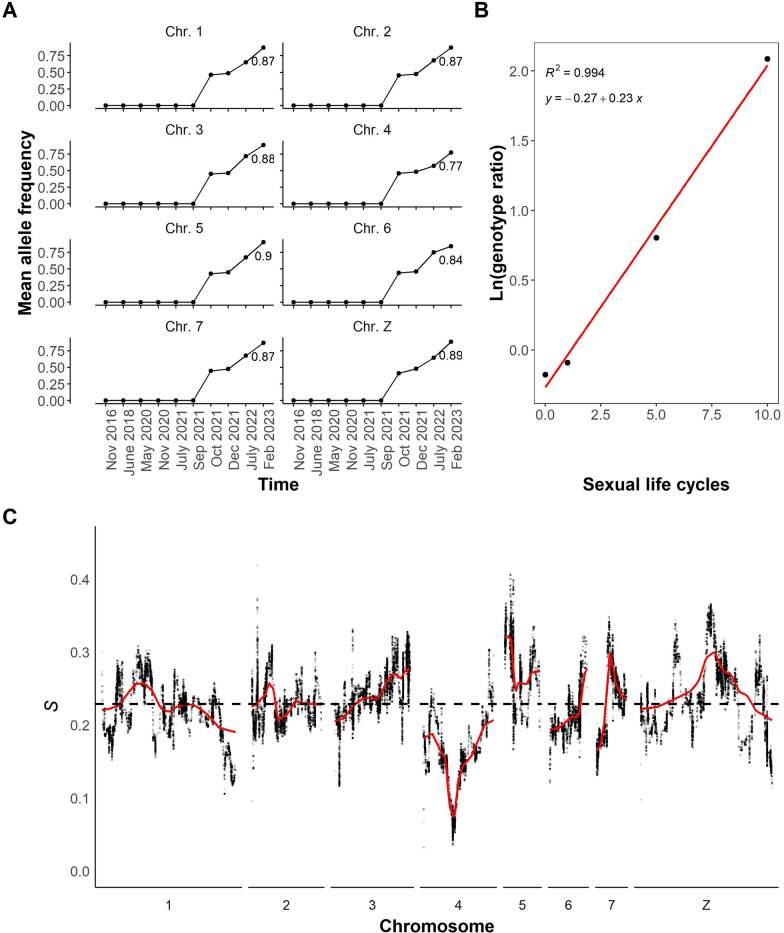
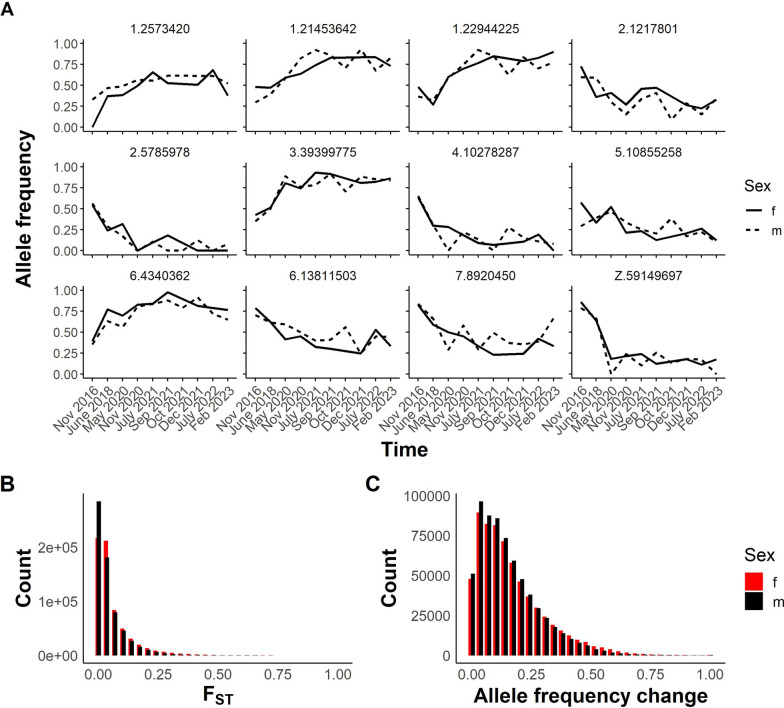
Results: While SmLE allele frequencies remained stable over the 8-year period, we observed sudden changes in allele frequency across the genome in SmBRE between July 2021 and February 2023, consistent with expectations of laboratory contamination. (i) SmLE-specific alleles increased in the SmBRE population from 0 to 41-46% across the genome between September and October 2021, reflecting the timing and magnitude of the contamination event. (ii) After contamination, strong selection (s ≅0.23) drove the replacement of low-fitness SmBRE with high-fitness SmLE alleles. (iii) Allele frequency changed rapidly across the whole genome, except for a region on chromosome 4, where SmBRE alleles remained at high frequency.
Conclusions: We were able to detect contamination in this case because SmBRE shows distinctive phenotypes. However, this would likely have been missed with phenotypically similar parasites. These results provide a cautionary tale about the importance of tracking the identity of parasite populations, but also showcase a simple approach to monitor changes within populations using molecular profiling of pooled population samples to characterize single-nucleotide polymorphisms. We also show that genetic drift results in continuous change even in the absence of contamination, causing parasites maintained in different labs (or sampled from the same lab at different times) to diverge.
Keywords: Schistosoma mansoni; Contamination; Laboratory populations; Parasite; Pool-sequencing; Population genomics; SmBRE; SmLE.
© 2024. The Author(s).
Conflict of interest statement
Declarations. Competing interests: The authors declare no competing interests. Consent for Publication: Not applicable. Ethical approval and consent to participate: Not applicable.
Figures
Update of
-
Rapid phenotypic and genotypic change in a laboratory schistosome population.Res Sq [Preprint]. 2024 Sep 16:rs.3.rs-4869982. doi: 10.21203/rs.3.rs-4869982/v1. Res Sq. 2024. Update in: Parasit Vectors. 2024 Dec 22;17(1):528. doi: 10.1186/s13071-024-06588-9. PMID: 39372934 Free PMC article. Updated. Preprint.
Similar articles
-
Rapid phenotypic and genotypic change in a laboratory schistosome population.Res Sq [Preprint]. 2024 Sep 16:rs.3.rs-4869982. doi: 10.21203/rs.3.rs-4869982/v1. Res Sq. 2024. Update in: Parasit Vectors. 2024 Dec 22;17(1):528. doi: 10.1186/s13071-024-06588-9. PMID: 39372934 Free PMC article. Updated. Preprint.
-
Rapid phenotypic and genotypic change in a laboratory schistosome population.bioRxiv [Preprint]. 2024 Aug 8:2024.08.06.606850. doi: 10.1101/2024.08.06.606850. bioRxiv. 2024. PMID: 39149304 Free PMC article. Preprint.
-
Striking differences in virulence, transmission and sporocyst growth dynamics between two schistosome populations.Parasit Vectors. 2019 Oct 16;12(1):485. doi: 10.1186/s13071-019-3741-z. Parasit Vectors. 2019. PMID: 31619284 Free PMC article.
-
Epigenetic modulation, stress and plasticity in susceptibility of the snail host, Biomphalaria glabrata, to Schistosoma mansoni infection.Int J Parasitol. 2016 Jun;46(7):389-94. doi: 10.1016/j.ijpara.2016.03.003. Epub 2016 Apr 4. Int J Parasitol. 2016. PMID: 27056272 Review.
-
Coevolution and compatibility in the snail-schistosome system.Parasitology. 2001;123 Suppl:S41-56. doi: 10.1017/s0031182001008071. Parasitology. 2001. PMID: 11769292 Review.
References
MeSH terms
Grants and funding
LinkOut - more resources
Full Text Sources
Research Materials
Miscellaneous
