. 2025 May;93(5):1860-1873.
doi: 10.1002/mrm.30395. Epub 2024 Dec 22.

3D deuterium metabolic imaging (DMI) of the human liver at 7 T using low-rank and subspace model-based reconstruction

Affiliations

3D deuterium metabolic imaging (DMI) of the human liver at 7 T using low-rank and subspace model-based reconstruction

Kyung Min Nam et al. Magn Reson Med. 2025 May.

Abstract

Purpose: To implement a low-rank and subspace model-based reconstruction for 3D deuterium metabolic imaging (DMI) and compare its performance against Fourier transform-based (FFT) reconstruction in terms of spectral fitting reliability.

Methods: Both reconstruction methods were applied on simulated and experimental DMI data. Numerical simulations were performed to evaluate the effect of increasing acceleration factors. The impact on spectral fitting results, SNR, and the overall normalized root mean square error (NRMSE) compared to ground-truth data were calculated. A comparative analysis was performed on DMI data acquired from the human liver, including both natural abundance and post-deuterated glucose intake data at 7 T.

Results: Simulation showed the Cramer-Rao lower bound [%] of water, glucose, sum of glutamate and glutamine (Glx), and lipid signals for the low-rank and subspace model-based reconstruction at R = 1.0 was 12.4, 14.7, 17.3, and 11.0 times lower than FFT. At R = 1.1, NRMSE was 1.4%, 1.3%, 0.8%, and 4.2% lower for the water, glucose, Glx, and lipid, respectively, compared to FFT. However, the NRMSE of the Glx and lipid increased by 0.4% and 3.2% at R = 1.3. For the in vivo DMI experiment, SNR was 2.5-3.0 times higher compared to FFT. The fitted amplitude of water and glucose peaks showed Cramer-Rao lower bound [%] values that were approximately 2.3 times lower than FFT.

Conclusion: Simulations and in vivo experiments on the human liver demonstrate that low-rank and subspace model-based reconstruction with undersampled data mitigates noise and enhances spectral fitting quality.

Keywords: 2H; 7 T; DMI; SPICE; deuterium; deuterium MRSI; liver; low rank; subspace model.


Figures

FIGURE 1
FIGURE 1
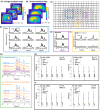
Schematic overview of the numerical simulation setup depicting the ROIs, along with representative spectra obtained from each region. (A) 3D high‐resolution phantom mask was transformed to 3D k‐space and truncated to a lower resolution (B). (C) In the deuterium spectra, ROI are shown, including the liver (blue box), stomach (purple box), and the boundary of the body (yellow box). Metabolite signals for water, glucose, Glx, and lipid (chemical shifts: 4.7 ppm, 3.8 ppm, 2.25 ppm, and 1.3 ppm) were generated. (D, E, F) Representative spectra in each ROI: deuterated water, glucose, and Glx signals are shown in the liver (D); water and glucose in the stomach (E); and water in the body, and water and lipids (i.e., subcutaneous fat) in the boundary of the body (F). (G) The spectra from a voxel in the liver ROI (green box in D) are shown for different SNR levels (60, 30, 15, and 5) using both FFT reconstruction and low‐rank and subspace model‐based reconstruction. The ground truth spectrum is displayed at the bottom for comparison. Noise was added to the ground truth data to simulate the four different SNR conditions. The figure illustrates how increasing noise levels affect spectral quality, with the low‐rank and subspace model‐based reconstruction maintaining better spectral fidelity at lower SNRs compared to FFT reconstruction. (H) To determine the optimal D1 size, the CRLB [%] was calculated as the model order L increased for metabolites at two different D1 sizes (3 × 3 × 3 and 3 × 5 × 3), with an acceleration factor of R = 1.0 and SNR = 60. The CRLB for lipid was the highest among all metabolites, followed by Glx, glucose, and water. The results show that the CRLB values were lower for D1 size 3 × 5 × 3 compared to 3 × 3 × 3. (I) The effect of decreasing SNR on CRLB is shown for D1 size 3 × 5 × 3. As SNR decreases (e.g., SNR = 60, 30, and 5), the CRLB values for all metabolites increase, demonstrating the impact of noise on estimation precision. CRLB, Cramer‐Rao lower bound; FFT, Fourier transform‐based; Glx, sum of glutamate and glutamine; ROI, region of interest.
FIGURE 2
FIGURE 2
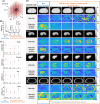
(A) The Poisson disk sampling pattern (red circles) is shown under undersampling conditions at an acceleration factor of R = 1.3. The sampling data (i.e., D1 size = 3 × 5 × 3) of the center (dark blue circles) is used for temporal basis estimation. (B) The changes in CRLB [%] for FFT reconstruction and low‐rank and subspace model‐based reconstruction with acceleration factors of R = 1.0, 1.1, and 1.3 are presented using noisy data with SNR = 15, with a zoomed view for the low‐rank and subspace model‐based reconstruction. (C) The NRMSE of the fitted signals for each metabolite was calculated for both FFT reconstruction and low‐rank and subspace model‐based reconstruction at acceleration factors of R = 1.0, 1.1, and 1.3. (D) Metabolite maps were created from the fitted signals for ground truth, FFT reconstruction, and low‐rank and subspace model‐based reconstruction. The first column shows the ground truth metabolite maps: The first row shows water, the fourth row presents glucose, the seventh row displays Glx, and the tenth row depicts lipid. The second column displays the metabolite maps from FFT reconstruction, along with the corresponding mean bias and mean bias SD maps. The third column presents the results from low‐rank and subspace model‐based reconstruction at R = 1.0, where the temporal basis was estimated from the ground truth. Columns four through six show the metabolite maps, mean bias maps, and mean bias SD maps for low‐rank and subspace model‐based reconstruction at R = 1.0, 1.1, and 1.3, respectively. NRMSE, normalized root mean square error.
FIGURE 3
FIGURE 3
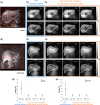
3D deuterium MRSI dataset of the human liver at natural abundance processed by two reconstruction methods: FFT reconstruction and low‐rank and subspace model‐based reconstruction (orange). (A) The 1H MRI image (Dixon) shows the liver, contoured with a white line, and the voxel of interest indicated by the green box. (B) Deuterium spectra from this voxel within the liver are shown for both reconstruction methods at different acceleration factors (R = 1.0, 1.1, and 1.3), with corresponding SNR values. The average SNR for the water peak within the liver was computed from the middle slice. (C) CRLB [%] of the fitted water signals was calculated from FFT reconstruction and low‐rank and subspace model‐based reconstruction for R = 1.0, 1.1, and 1.3. (D) Deuterium MRSI spectra from the middle slice are displayed for both reconstruction methods, with the SNR of the water peak calculated across 22 voxels in the liver region (highlighted in gray). Low‐rank and subspace model‐based reconstruction was performed with a D1 size of 3 × 5 × 3 in k‐space and L = 5. (E) Deuterated water metabolite maps are shown for FFT reconstruction (top row) and low‐rank and subspace model‐based reconstruction at R = 1.0, 1.1, and 1.3. (F) CRLB [%] maps of water from both reconstruction methods for the liver ROI are displayed. 1H, hydrogen‐1 (proton).
FIGURE 4
FIGURE 4
3D DMI datasets captured from the human liver, acquired 2.5 h post‐oral glucose intake, processed using two reconstruction methods: FFT reconstruction (blue) and low‐rank and subspace model‐based reconstruction (orange). (A) The 1H MRI image (Dixon) displays the liver, contoured by a white line. The SNR for a selected voxel in the liver ROI (white) was calculated using two reconstruction methods. (B) Water signals from the voxel within the liver (green box) are presented, with SNR values calculated for both FFT reconstruction and low‐rank and subspace model‐based reconstruction at different acceleration factors (R = 1.0, 1.1, and 1.3). (C) FFT reconstruction results are shown for the liver region, with the average SNR of the water peak calculated for 23 voxels in the liver ROI (highlighted in gray). (D) Low‐rank and subspace model‐based reconstruction results are shown for the same 23 voxels in the liver region, with spectra displayed at R = 1.0, 1.1, and 1.3. The SNR is significantly higher than that of FFT reconstruction. Low‐rank and subspace model‐based reconstruction used a D1 size of 3 × 3 × 3 and L = 5.
FIGURE 5
FIGURE 5
Deuterated water and glucose metabolite maps obtained from DMI data in the axial and coronal planes, processed using FFT reconstruction and low‐rank and subspace model‐based reconstruction. The 1H MRI image (Dixon) displays the liver in both axial (A) and coronal (B) planes, outlined with a white contour. The metabolite maps illustrate the intensity of glucose and water signals 2.5 h after oral glucose intake, highlighting the difference in reconstruction methods. Axial deuterated water and glucose maps are shown for both FFT reconstruction (C) and low‐rank and subspace model‐based reconstruction (D) at acceleration factors R = 1.0, 1.1, and 1.3. Similarly, the coronal metabolite maps are displayed, again comparing FFT reconstruction (E) and low‐rank and subspace model‐based reconstruction (F) at the same acceleration factors. Both methods show similar patterns in the metabolite distribution, but the low‐rank method consistently provides still higher signal intensities and good definition, even at higher acceleration factor. The CRLB [%] of the deuterated water (G) and glucose (H) signals were calculated for both reconstruction methods, with the FFT reconstruction exhibiting higher CRLB values compared to the low‐rank and subspace model‐based reconstruction across all acceleration factors. This indicates lower fitting accuracy in FFT reconstruction compared to the low‐rank approach, particularly for water and glucose signals. DMI, deuterium metabolic imaging.

Similar articles

Cited by

References

    1. De Feyter HM, Behar KL, Corbin ZA, et al. Deuterium metabolic imaging (DMI) for MRI‐based 3D mapping of metabolism in vivo. Sci Adv. 2018;4:eaat7314. - PMC - PubMed
    1. De Feyter HM, de Graaf RA. Deuterium metabolic imaging – back to the future. J Magn Reson. 2021;326:106932. - PMC - PubMed
    1. Straathof M, Meerwaldt AE, De Feyter HM, de Graaf RA, Dijkhuizen RM. Deuterium metabolic imaging of the healthy and diseased brain. Neuroscience. 2021;474:94‐99. - PMC - PubMed
    1. Ip KL, Thomas MA, Behar KL, de Graaf RA, De Feyter HM. Mapping of exogenous choline uptake and metabolism in rat glioblastoma using deuterium metabolic imaging (DMI). Front Cell Neurosci. 2023;17:1130816. - PMC - PubMed
    1. Warburg VO. Über den Stoffwechsel der Carcinomzelle. Naturwissenschaften. 1924;12:1131‐1137.