. 2025 Jan 14;97(1):166-174.
doi: 10.1021/acs.analchem.4c03444. Epub 2024 Dec 22.

Trifluoroacetic Acid as a Molecular Probe for the Dense Phase in Liquid-Liquid Phase-Separating Peptide Systems

Affiliations

Trifluoroacetic Acid as a Molecular Probe for the Dense Phase in Liquid-Liquid Phase-Separating Peptide Systems

Jessica Lim et al. Anal Chem. .

Abstract

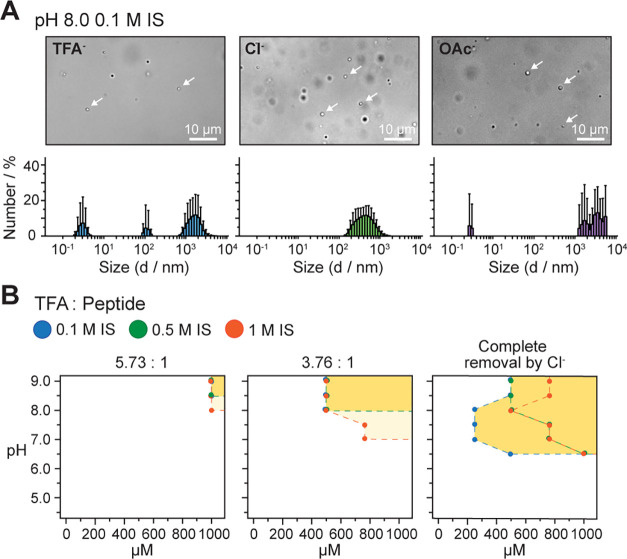
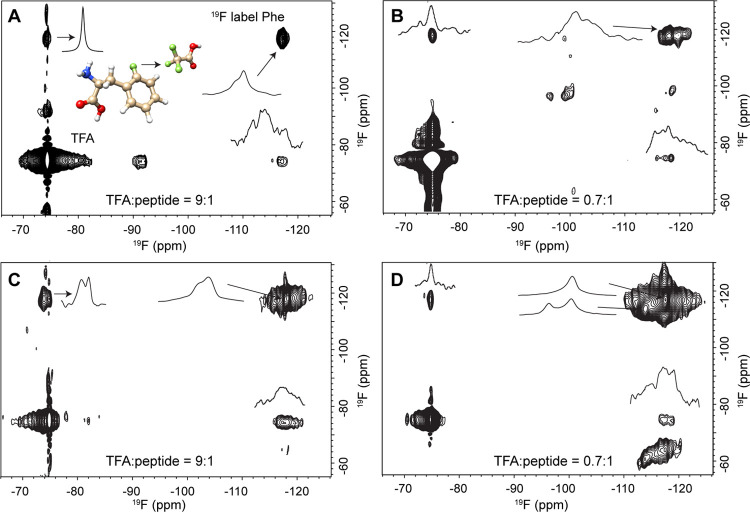
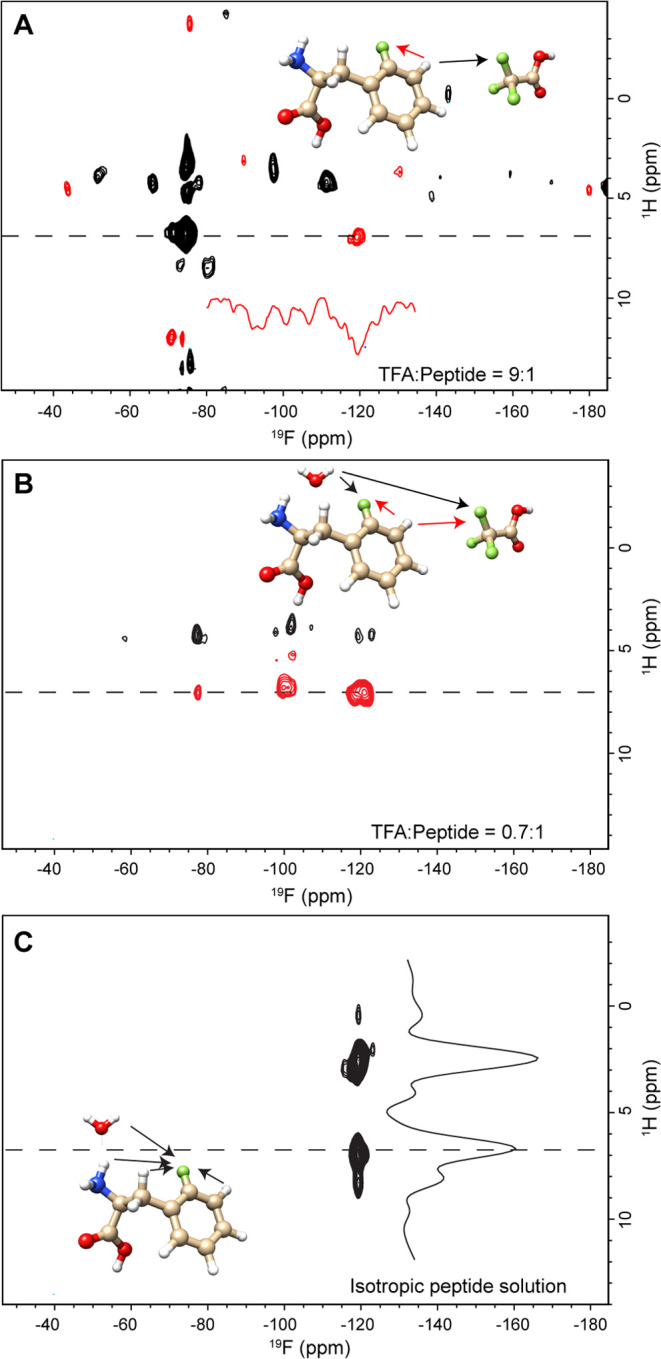
Although trifluoroacetic acid (TFA) is not typically considered a Hofmeister reagent, it has been demonstrated to modulate biocoacervation. We show that TFA can be employed to probe specific interactions in coacervating bioinspired peptide phenylalanine (Phe) 19F-labeled at a single site, altering its liquid-liquid phase separation (LLPS) behavior. Solid-state nuclear magnetic resonance (NMR) spectroscopy revealed two dynamically distinct binding modes of TFA with Phe, resulting in a structured, dipolar-ordered complex and a more dynamic complex, highlighting the proximity between TFA and Phe. Quantum chemistry modeling of 19F chemical shift differences indicates that the structured complex is formed by the intercalation of one TFA molecule between two stacked Phe aromatic rings, possibly contributing to the stabilization of the condensed dense phase. Thus, we propose that TFA can be used as a convenient molecular probe in 19F NMR-based studies of the structure and dynamics of the dense phase in LLPS peptide systems.


Conflict of interest statement

The authors declare no competing financial interest.

Figures

Figure 1
Figure 1
(A) Brightfield optical microscopy observation and DLS number-based size distributions of the phase separation behavior of unlabeled (i.e., no 19F) GY23 with different counterions. Corresponding intensity- and volume-based plots can be found in Figure S2. (B) LLPS phase diagrams as a function of pH and GY23 concentration at varying TFA:peptide stoichiometry and ionic strength (colored dots). Unlabeled GY23 is used here. The LLPS conditions were determined by the appearance of droplets in brightfield microscopic images and in diagrams, demarcated by the dotted lines and colored space. IS: the ionic strength of the buffers tested. The maximum peptide concentration tested is 1 mM.
Figure 2
Figure 2
1D 19F MAS NMR spectrum and 2D overlay of 1H–19F cross-polarization (CP) HETCOR spectra using CP mixing times of 1 ms (red) and 2 ms (black) for samples with TFA:peptide ratio of (A) 9:1 and (B) 0.7:1. The pulse sequence used in the experiments is reported in Figure S3. (C) Overlay of one pulse 1D 19F MAS spectra with two horizontal slices from corresponding 2D 1H–19F CP HETCOR of the sample with a TFA:peptide ratio of 0.7:1. Slices were taken at 7.01 ppm (1H) corresponding to the resonances of the aromatic protons of Phe. Spinning sidebands are marked with an asterisk.
Figure 3
Figure 3
2D 19F–19F correlation spectra of the condensed dense phase samples with a (A) TFA:peptide ratio of 9:1 and a (B) TFA:peptide ratio of 0.7:1. Dipolar-assisted rotational resonance (DARR) spectra for a (C) TFA:peptide ratio of 9:1 and a (D) TFA:peptide ratio of 0.7:1.
Figure 4
Figure 4
2D 1H–19F HetNOE spectra recorded on samples with different TFA:peptide ratios. The pulse sequence is included in Figure S3. (A) 1H-Phe/19F-Phe cross-peak showed a different sign than 1H-Phe/TFA peak for sample TFA:peptide = 9:1. (B) Mixing peaks showed the same negative phase in TFA:peptide = 0.7:1. (C) Spectrum was recorded by using the isotropic peptide solution at pH 3.5. The w1(1H) profile taken at −120 ppm (19F-Phe) exhibits three groups of cross-peaks at δ{1H} = 2.41, 6.95, and 8.41 ppm.
Figure 5
Figure 5
Energy-optimized geometries and 19F chemical shift variations of (A) with two stacked toluene (methylbenzene) molecules substituted with a fluorine atom at the methylbenzene ring used to model the phenylalanine residue. (B) Intercalated and (C) lateral configuration of TFA with two fluorinated toluene molecules calculated using Gaussian 16. The 19F chemical shift variations, Δδ (ppm), are reported as the difference of the calculated 19F chemical shifts in the reported configuration and with the constituent molecules displaced from each other by more than 11 Å and averaged for the three fluorine atoms of TFA. Additional explored geometries are in Figure S6.

Similar articles

References

    1. Alberti S. Phase separation in biology. Curr. Biol. 2017, 27 (20), R1097–R1102. 10.1016/j.cub.2017.08.069. - DOI - PubMed
    1. Shin Y. Rich phase separation behavior of biomolecules. Mol. Cells 2022, 45 (1), 6–15. 10.14348/molcells.2021.0204. - DOI - PMC - PubMed
    1. Shil S.; Tsuruta M.; Kawauchi K.; Miyoshi D. Biomolecular liquid-liquid phase separation for biotechnology. BioTech 2023, 12 (2), 26.10.3390/biotech12020026. - DOI - PMC - PubMed
    1. Harrington M. J.; Mezzenga R.; Miserez A. Fluid protein condensates for bio-inspired applications. Nat. Rev. Bioeng. 2024, 2 (3), 260–278. 10.1038/s44222-023-00133-6. - DOI
    1. Maruri-Lopez I.; Chodasiewicz M. Involvement of small molecules and metabolites in regulation of biomolecular condensate properties. Curr. Opin. Plant. Biol. 2023, 74, 10238510.1016/j.pbi.2023.102385. - DOI - PubMed

MeSH terms

LinkOut - more resources