

Transient Absorption Microscopy Maps Spatial Heterogeneity and Distinct Chemical Environments in Photocatalytic Carbon Nitride Particles
- PMID: 39711254
- PMCID: PMC11798357
- DOI: 10.1002/smll.202406652
Transient Absorption Microscopy Maps Spatial Heterogeneity and Distinct Chemical Environments in Photocatalytic Carbon Nitride Particles
Abstract
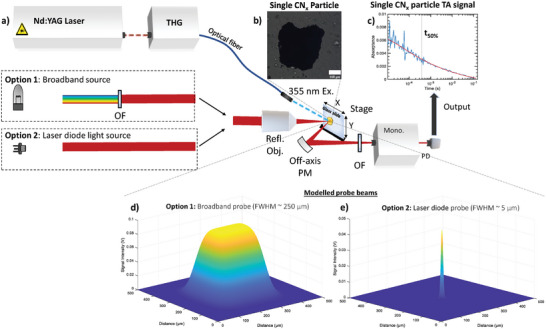
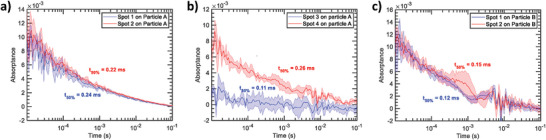
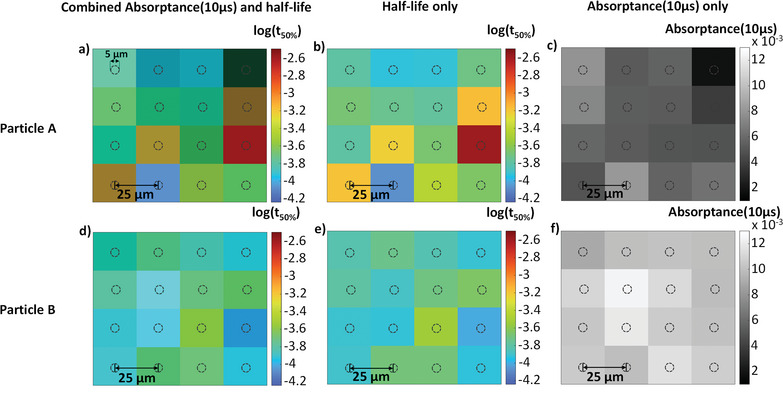
Limitations in solar energy conversion by photocatalysis typically stem from poor underlying charge carrier properties. Transient Absorption (TA) reveals insights on key photocatalytic properties such as charge carrier lifetimes and trapping. However, on the microsecond timescale, these measurements use relatively large probe sizes ranging in millimetres to centimetres which averages the effect of spatial heterogeneity at smaller length scales. A home-built Transient Absorption Microscopy (TAM) setup is reported and used to study single particles of carbon nitride (CNx), an emerging photocatalyst. For the first time, to the best of the authors' knowledge, µs-s timescales are explored within individual particles to gain a more complete understanding of their photophysics. The dynamics of trapped charges are monitored, enabling measurement and quantification of heterogeneity in the transient absorptance signal of individual CNx particles and within them. Particle-to-particle heterogeneity in the trapped charge density is observed, while spatial heterogeneity in lifetimes within a particle is revealed using a smaller probe beam with a ≈5 µm diameter. Overall, the observations suggest that contributions from different local environments independently influence charge trapping at different timescales. TAM on the micron and microsecond spatiotemporal resolution will aid in tackling design questions about optimal chemical environments for the promotion of photoactivity.
Keywords: carbon nitride; charge carrier dynamics; photocatalysis; transient absorption microscopy.
© 2024 The Author(s). Small published by Wiley‐VCH GmbH.
Conflict of interest statement
The authors declare no conflict of interest.
Figures


References
-
- Lewis N. S., Science 2016, 351, aad1920. - PubMed
-
- Wang Y., Vogel A., Sachs M., Sprick R. S., Wilbraham L., Moniz S. J. A., Godin R., Zwijnenburg M. A., Durrant J. R., Cooper A. I., Tang J., Nat. Energy 2019, 4, 746.
-
- Jean J., Brown P. R., Jaffe R. L., Buonassisi T., Bulović V., Energy Environ. Sci. 2015, 8, 1200.
-
- Spanggaard H., Krebs F. C., Sol. Energy Mater. Sol. Cells 2004, 83, 125.
Grants and funding
LinkOut - more resources
Full Text Sources
