. 2025 Dec;57(1):2442529.
doi: 10.1080/07853890.2024.2442529. Epub 2024 Dec 23.

Identification of ALDH7A1 as a DNA-methylation-driven gene in lung squamous cell carcinoma

Affiliations

Identification of ALDH7A1 as a DNA-methylation-driven gene in lung squamous cell carcinoma

Gaofeng Liang et al. Ann Med. 2025 Dec.

Abstract

Background: Deoxyribose nucleic acid (DNA) methylation is an important epigenetic modification that plays an important role in the occurrence and development of tumors. Identifying key methylation-driven genes that affect the prognosis of lung squamous cell carcinoma (LUSC) can provide direction for targeted therapy research.

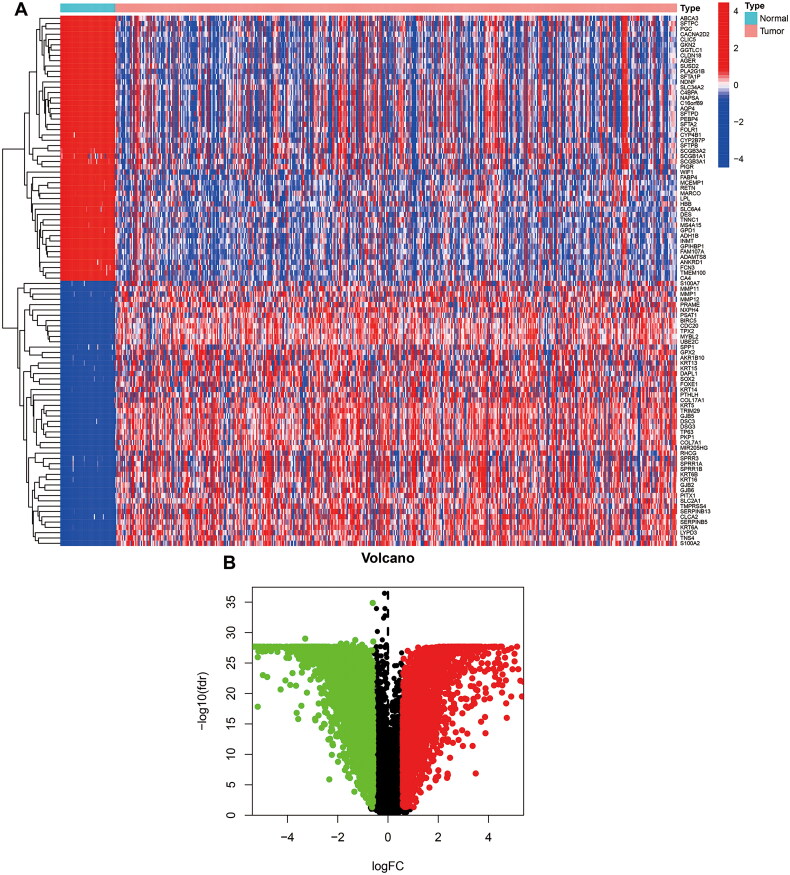
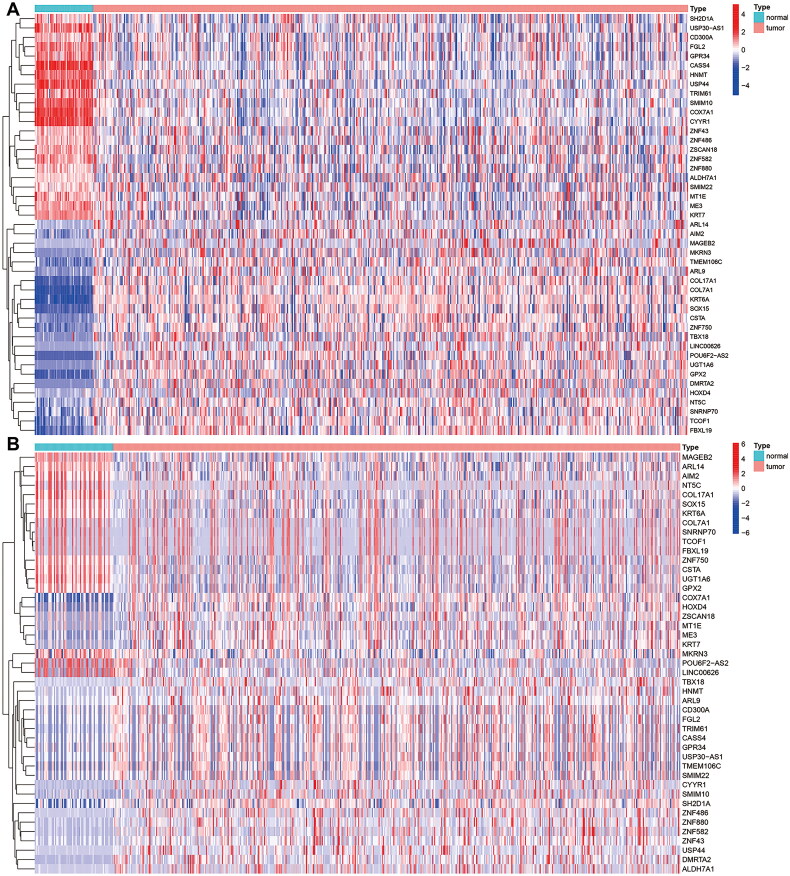
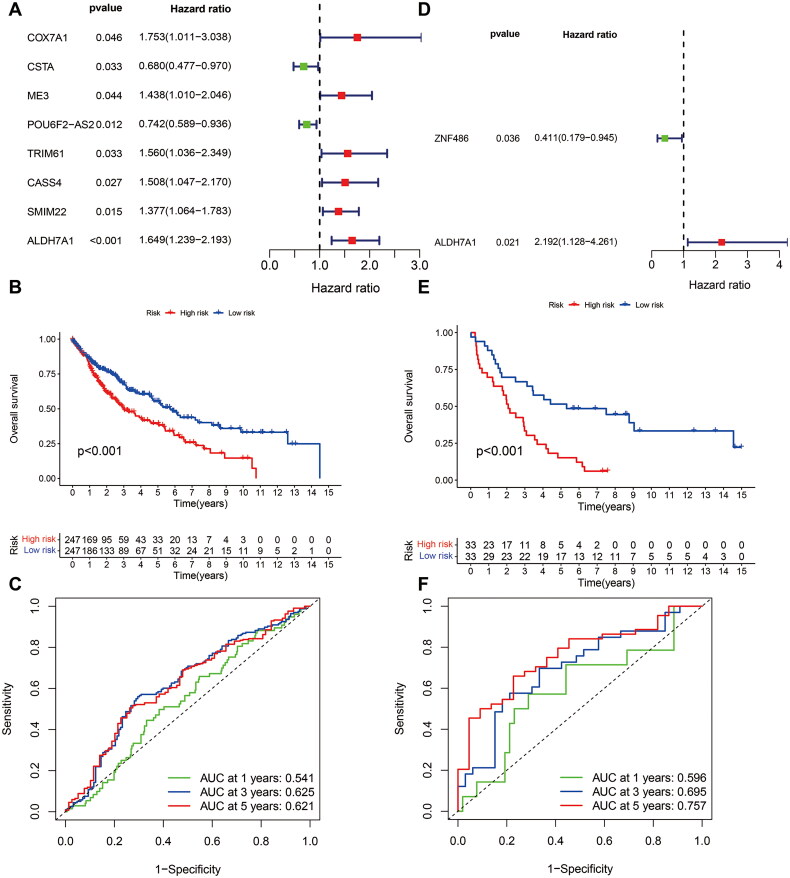
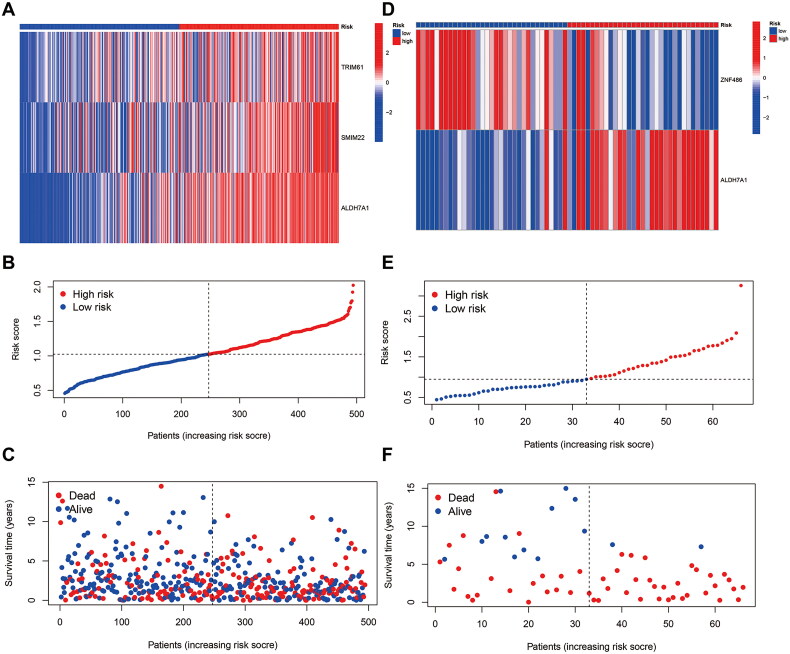
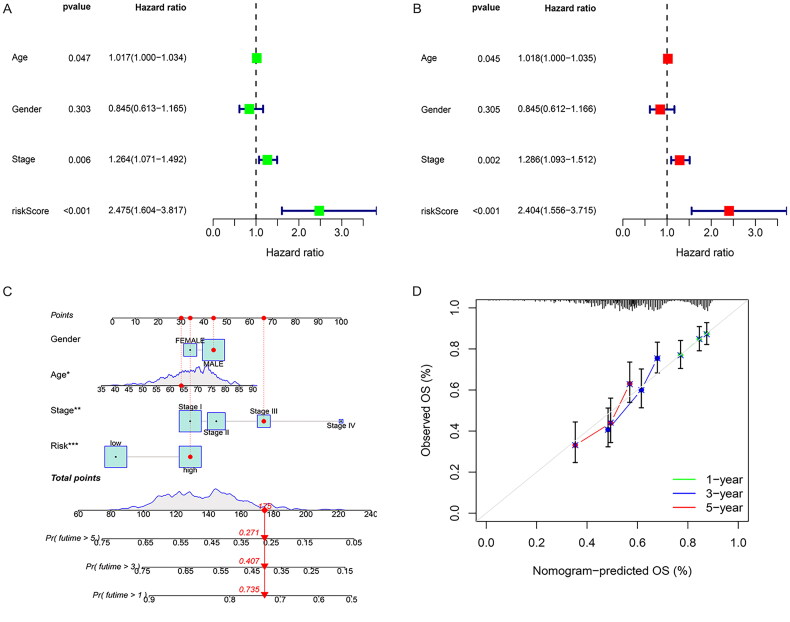
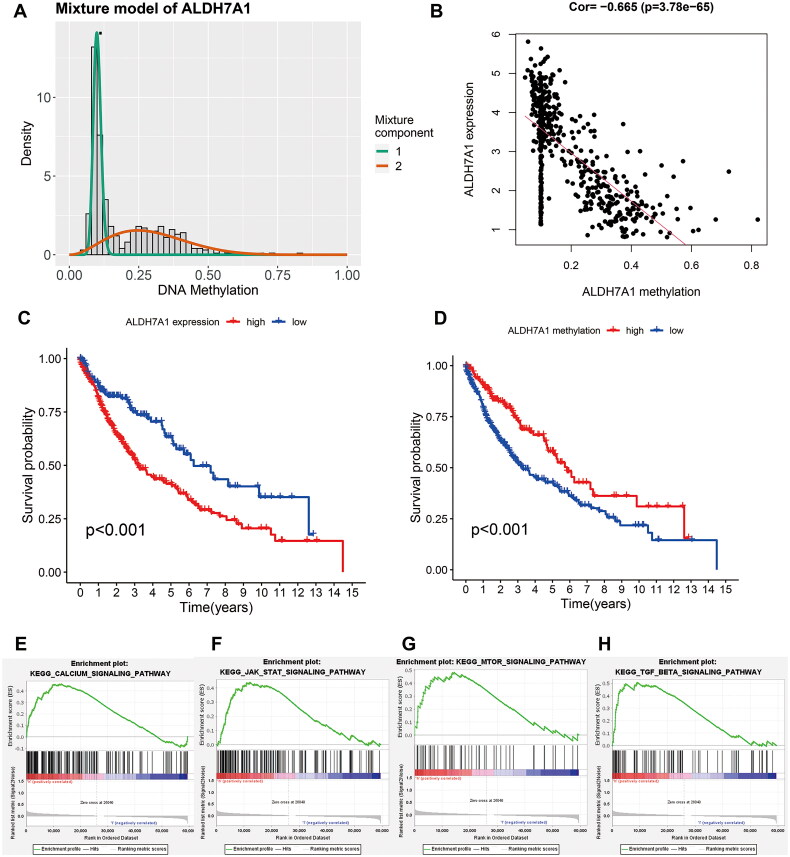
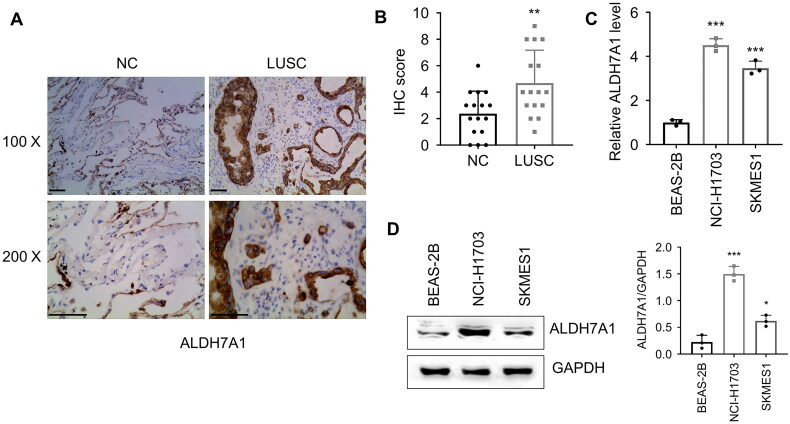
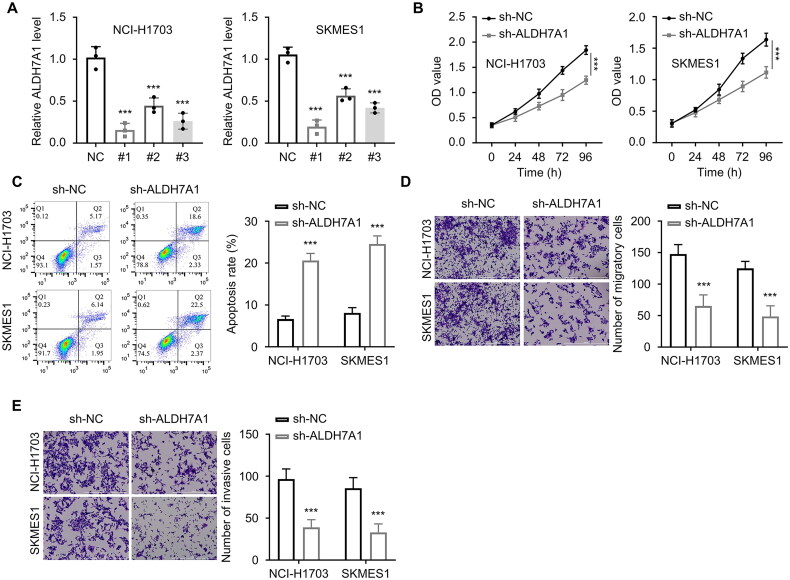
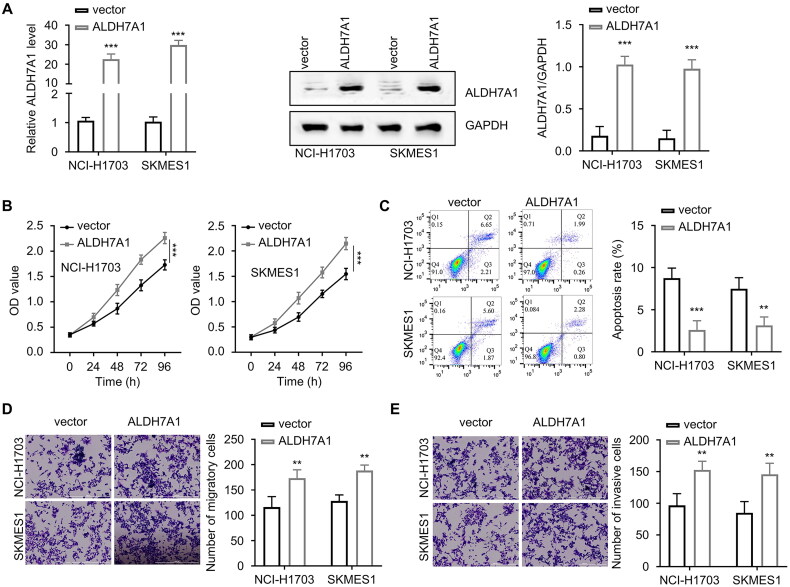
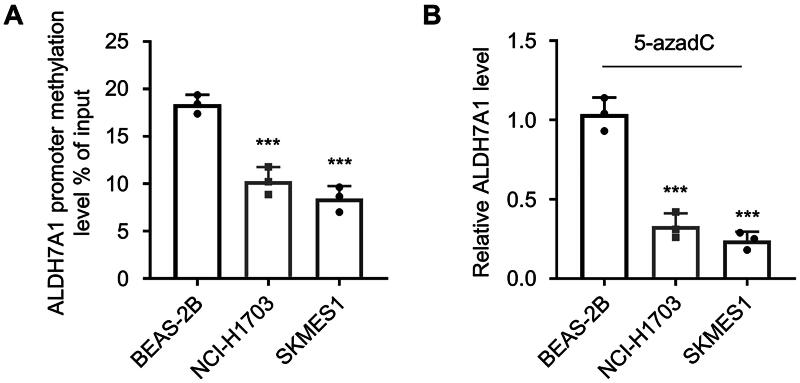
Methods and results: Methylation and RNA-seq data were downloaded from The Cancer Genome Atlas (TCGA). The MethylMix package was used to integrate and analyze the methylation and gene expression data from TCGA, and the LUSC dataset (GSE37745) was downloaded from GEO for validation. Forty-five DNA-methylation-driven genes (MDGs) were obtained, and 3 genes (TRIM61, SMIM22, and ALDH7A1) were significantly associated with survival by using univariate and multivariate Cox regression. A risk model was constructed. KM analysis showed that patients with high-risk scores had poor survival. A nomination plot for prognosis prediction of LUSC patients was constructed, which showed a good predictive efficiency for tumor prognosis. The high expression of ALDH7A1 was an independent risk factor for poor prognosis in LUSC. The expression of ALDH7A1 in LUSC was negatively correlated with its methylation status (COR = -0.655). GSEA analysis showed that high expression of ALDH7A1 could activate multiple signaling pathways (JAK-STAT signaling pathway and mTOR signaling pathway). In vitro cell experiments confirmed that in LUSC, silencing ALDH7A1 could inhibit tumor progression, while overexpression of ALDH7A1 could promote tumor progression.

Conclusion: Our results indicated that ALDH7A1, a newly discovered MDG in LUSC, could act as an independent prognostic factor for OS in LUSC, with the potential to become a potential target for LUSC diagnosis and treatment. High expression of ALDH7A1 in LUSC could promote the occurrence and development of tumors. Signaling pathways, such as JAK-STAT and mTOR signaling pathways, might regulate the high expression of ALDH7A1.

Keywords: ALDH7A; DNA methylation; Lung squamous cell carcinoma; methylation driver gene; survival analysis.


Conflict of interest statement

No potential conflict of interest was reported by the author(s).

Figures

Figure 1.
Figure 1.
Screen DEGs between normal and LUSC in TCGA. (A) Heat map of DEGs in LUSC. The light blue and pink colors represent normal and tumor samples, respectively. (B) The volcano plot of DEGs. The red plots represent the upregulated genes, and the green plots represent the downregulated genes between tumor and normal tissues.
Figure 2.
Figure 2.
Heatmap of 45MDGs s in LUSC. (A) The expression pattern of 45 MDGs. Red represents upregulated genes, and blue represents downregulated genes between tumor and normal tissues. (B) The methylation pattern of 51 MDGs. Red represents highly methylated genes, and green represents low methylated genes between tumor and normal tissues.
Figure 3.
Figure 3.
Constructing and validating an MDG risk profile model. (A) Eight MDGs were significantly related to prognosis in patients with LUSC by univariate Cox regression analysis. (B) KM curves showed that high-risk patients had poorer survival in the TCGA cohort (p < 0.001). (C) The AUC of the ROC curve in the TCGA cohort. (D) Two MDGs were significantly related to prognosis in patients with LUSC by univariate Cox regression analysis. (E) KM curves showed that high-risk patients had poorer survival in the GEO cohort (p < 0.001). (F) The AUC value of the ROC curve in the GEO cohort. AUC: area under curve.
Figure 4.
Figure 4.
Heatmap and scatterplot of risk factors for patients. (A) TRIM61, SMIM22, ALDH7A1. (B,C) Risk score and survival status analysis of MDGs prognostic signature: the blue dots represent low-risk patients, and red dots represent high-risk patients; (D) ALDH7A1 was highly expressed in high-risk patients in the GEO cohort, and ZNF486 was highly expressed in low-risk patients in the GEO cohort; (E,F) risk score and survival status analysis of MDGs prognostic signature: the blue dots represent low-risk patients and red dots represent high-risk patients.
Figure 5.
Figure 5.
The risk score is an independent prognostic factor. (A) Forest plot of univariate survival analysis. (B) Forest plot of multivariate survival analysis. HR: hazard ratio; T: description of the primary tumor site; N: description of regional lymph node involvement; M: description of the presence or otherwise distance of metastatic spread. (C) Curve the nomogram of clinicopathological characteristics and RiskScore to predict the 1-, 3-, and 5-year OS of LUSC patients. (D) Calibration curve for the risk score model in the validation cohort. The dotted line represents the ideal predictive model, and the solid line represents the observed model.
Figure 6.
Figure 6.
Effect of ALDH7A1 expression and methylation status on prognosis and function in LUSC. (A) Distribution map of the methylation degree of ALDH7A1. The X-axis represents the degree of methylation, and the Y-axis represents the number of methylated samples. The black horizontal line represents the methylation status distribution in the normal samples. (B) Correlation between the expression and methylation degree of ALDH7A1. The X-axis represents the methylation degree, and the Y-axis represents the gene expression level. (C,D) The survival analysis of the two subgroups stratified based on the median of ALDH7A1 expression and methylation status. (E–H) Terms enriched in ALDH7A1 high/low subgroups based on KEGG of GSEA.
Figure 7.
Figure 7.
Validation of ALDH7A1 expression in lung squamous cell carcinoma cell lines and clinical specimens. (A,B) Detection of the expression of ALDH7A1 in matched tumor tissue and Para-cancerous tissues of LUSC via immunohistochemistry (IHC), student’s t-test, ***p < 0.001. (C,D) Detection of the expression of ALDH7A1 in NCI-H1703, SKMES1, and BEAS-2B. *p < 0.05, **p < 0.01, ***p < 0.001 using a two-sided student’s t-test.
Figure 8.
Figure 8.
Effect of ALDH7A1 expression on malignant behavior of lung squamous cell carcinoma cells with silence. (A) The mRNA and protein expression levels of ALDH7A1 were detected by qRT-PCR to verify the interference efficiency. (B) The CCK-8 method was used to detect the absorbance at 450 nm wavelength of cells in different groups (NC, ALDH7A1shRNA) in NCI-H1703 and SKMES1 at 0, 24, 48, 72, and 96 h. (C) Cell apoptosis assay was used to detect the effect of si-ALDH7A1 on tumor cell apoptosis. (D) Transwell assay (without extracellular matrix gel EMC) was used to detect the cell migration ability of cells transfected with si-ALDH7A1 in NCI-H1703 and SKMES1. (E) Transwell assay (with extracellular matrix gel EMC) was used to detect the cell invasion ability of cells transfected with si-ALDH7A1 in NCI-H1703 and SKMES1. ***p < 0.001 using a two-sided student’s t-test.
Figure 9.
Figure 9.
Effect of ALDH7A1 overexpression on malignant behavior of lung squamous cell carcinoma cells. (A) The mRNA and protein expression levels of ALDH7A1 were detected by qRT-PCR to verify the overexpression efficiency. (B) The CCK-8 method was used to detect the absorbance at 450 nm wavelength of cells in different groups (NC, ALDH7A1_OE) in NCI-H1703 and SKMES1 at 0, 24, 48, 72, and 96 h. (C) Cell apoptosis assay was used to detect the effect of ALDH7A1 overexpression on tumor cell apoptosis. (D) Transwell assay (without extracellular matrix gel EMC) was used to detect the cell migration ability of cells transfected with ALDH7A1_OE in NCI-H1703 and SKMES1. (E) Transwell assay (with extracellular matrix gel EMC) was used to detect the cell invasion ability of cells transfected with ALDH7A1_OE in NCI-H1703 and SKMES1. **p < 0.01, ***p < 0.001 using a two-sided student’s t-test.
Figure 10.
Figure 10.
Validation of ALDH7A1 as a methylation-driven gene in LUSC. (A) MeDIP was used to examine the DNA methylation levels of the ALDH7A1 promoter region in LUSC cell lines NCI-H1703 and SK-MES-1, as well as in normal human lung epithelial cells BEAS-2B. (B) The expression of ALDH7A1 was examined through PCR in squamous cell carcinoma cell lines NCI-H1703 and SK-MES-1 after treatment with methylation inhibitor 5-aza (1 μmol/L). ***p < 0.001 using a two-sided student’s t-test.

Similar articles

Cited by

References

    1. Socinski MA, Obasaju C, Gandara D Jr., et al. . Current and emergent therapy options for advanced squamous cell lung cancer. J Thorac Oncol. 2018;13(2):165–183. doi: 10.1016/j.jtho.2017.11.111. - DOI - PubMed
    1. Felip E, Altorki N, Zhou C, et al. . Adjuvant atezolizumab after adjuvant chemotherapy in resected stage IB-IIIA non-small-cell lung cancer (IMpower010): a randomised, multicentre, open-label, phase 3 trial. Lancet. 2021;398(10308):1344–1357. doi: 10.1016/S0140-6736(21)02098-5. - DOI - PubMed
    1. Forde PM, Spicer J, Lu S, et al. . Neoadjuvant nivolumab plus chemotherapy in resectable lung cancer. N Engl J Med. 2022;386(21):1973–1985. doi: 10.1056/NEJMoa2202170. - DOI - PMC - PubMed
    1. Paz-Ares L, Vicente D, Tafreshi A, et al. . A randomized, placebo-controlled trial of pembrolizumab plus chemotherapy in patients with metastatic squamous NSCLC: protocol-specified final analysis of KEYNOTE-407. J Thorac Oncol. 2020;15(10):1657–1669. doi: 10.1016/j.jtho.2020.06.015. - DOI - PubMed
    1. Moore LD, Le T, Fan G.. DNA methylation and its basic function. Neuropsychopharmacology. 2013;38(1):23–38. doi: 10.1038/npp.2012.112. - DOI - PMC - PubMed