. 2024 Nov;76(8):e70022.
doi: 10.1111/jpi.70022.

Melatonin Inhibits Endometriosis Growth via Specific Binding and Inhibition of EGFR Phosphorylation

Affiliations

Melatonin Inhibits Endometriosis Growth via Specific Binding and Inhibition of EGFR Phosphorylation

Yiran Li et al. J Pineal Res. 2024 Nov.

Abstract

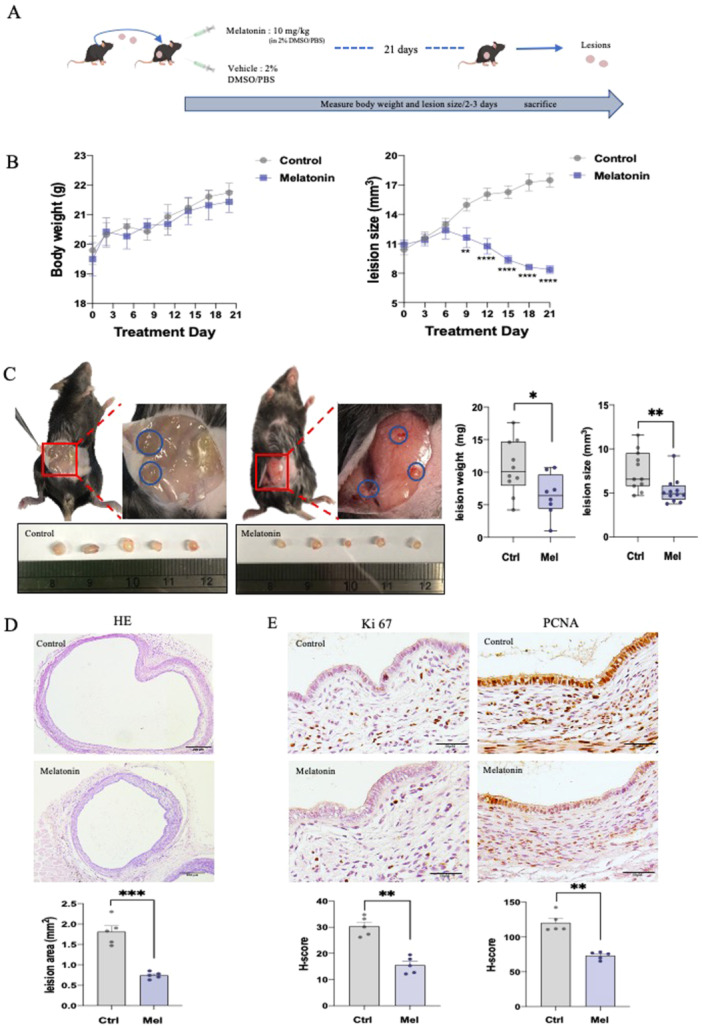
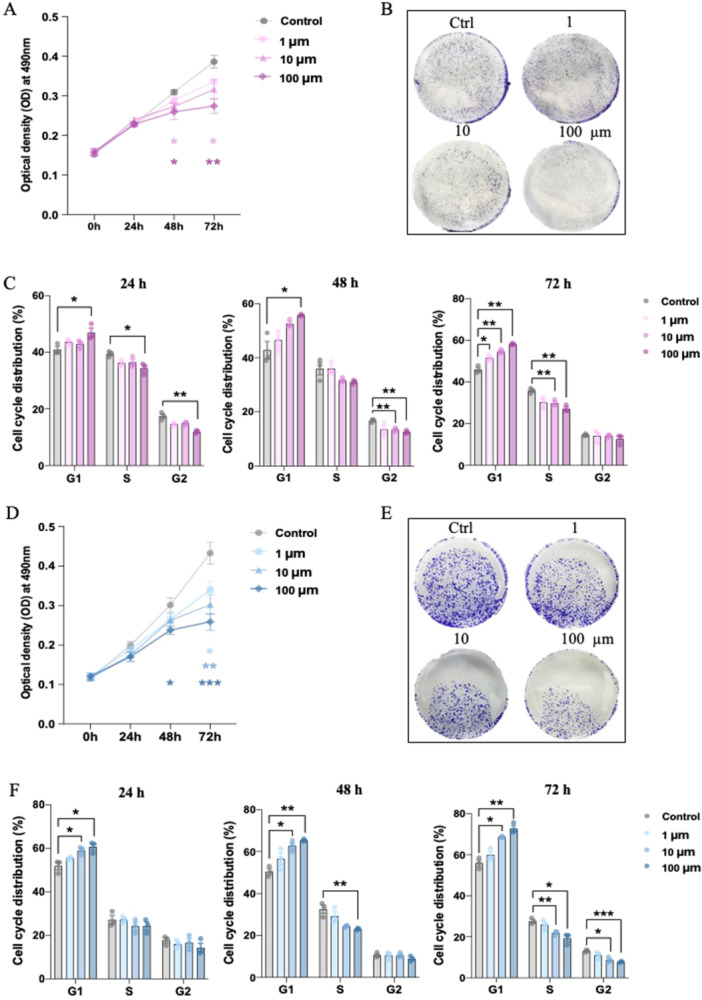
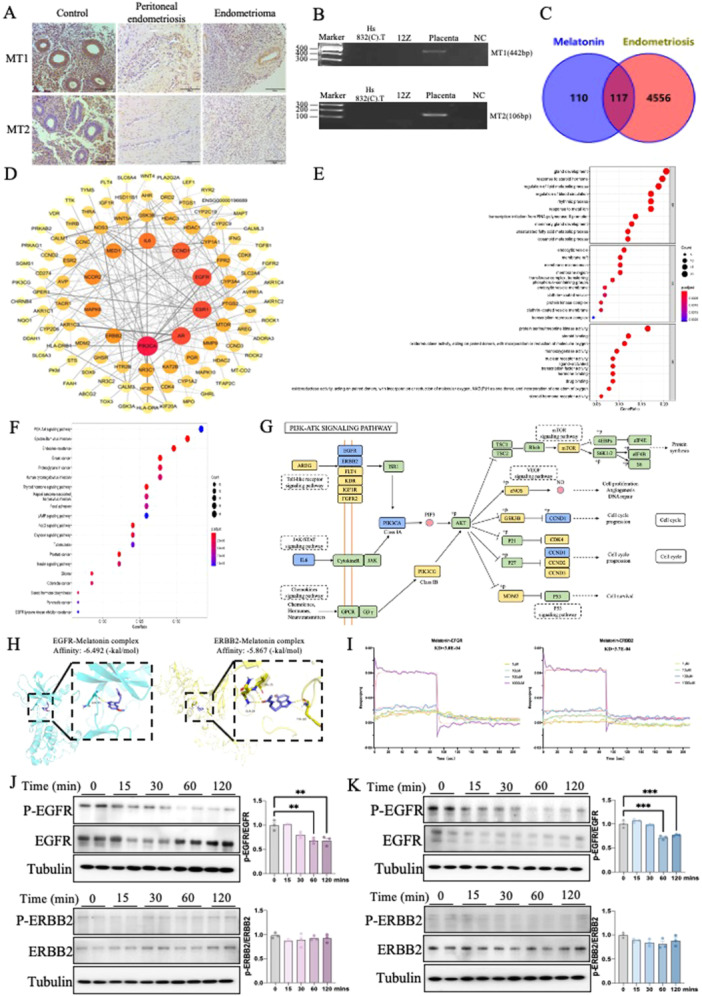
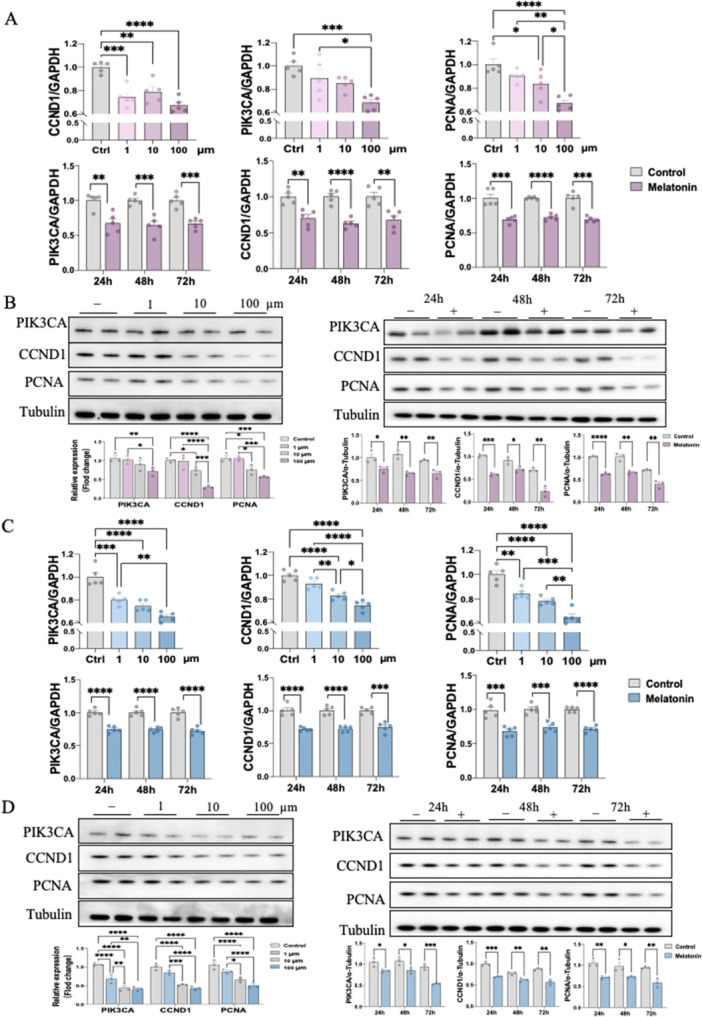
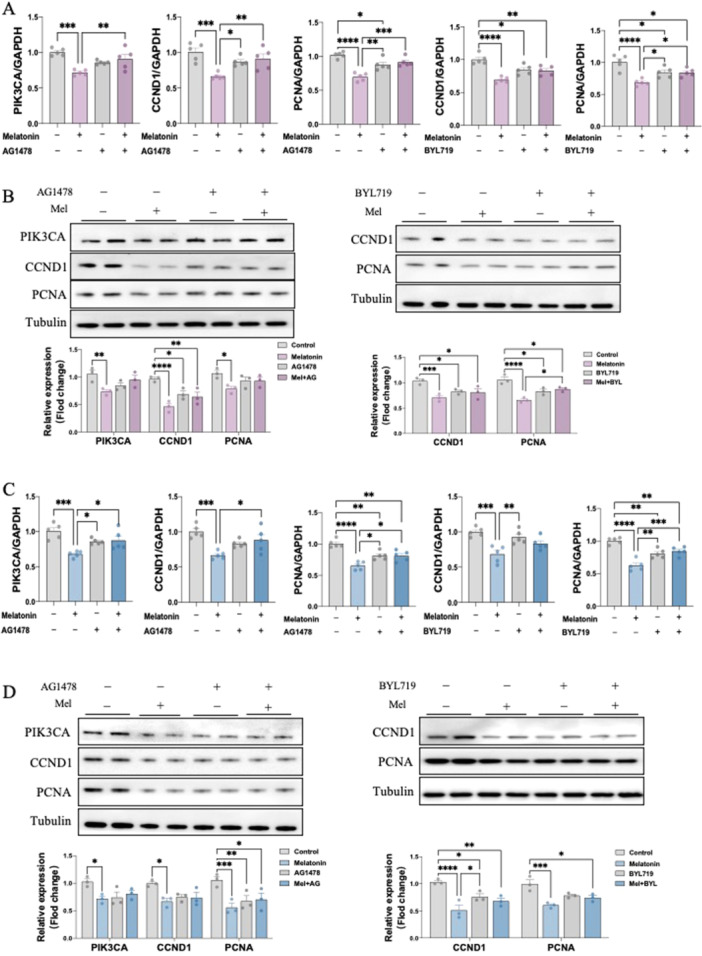
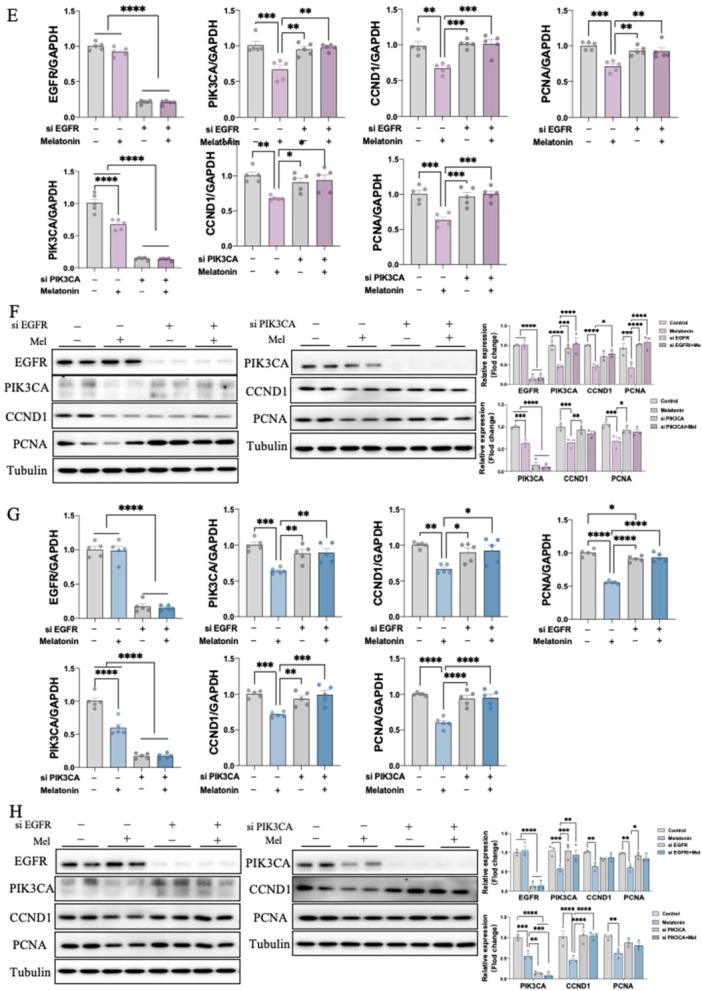
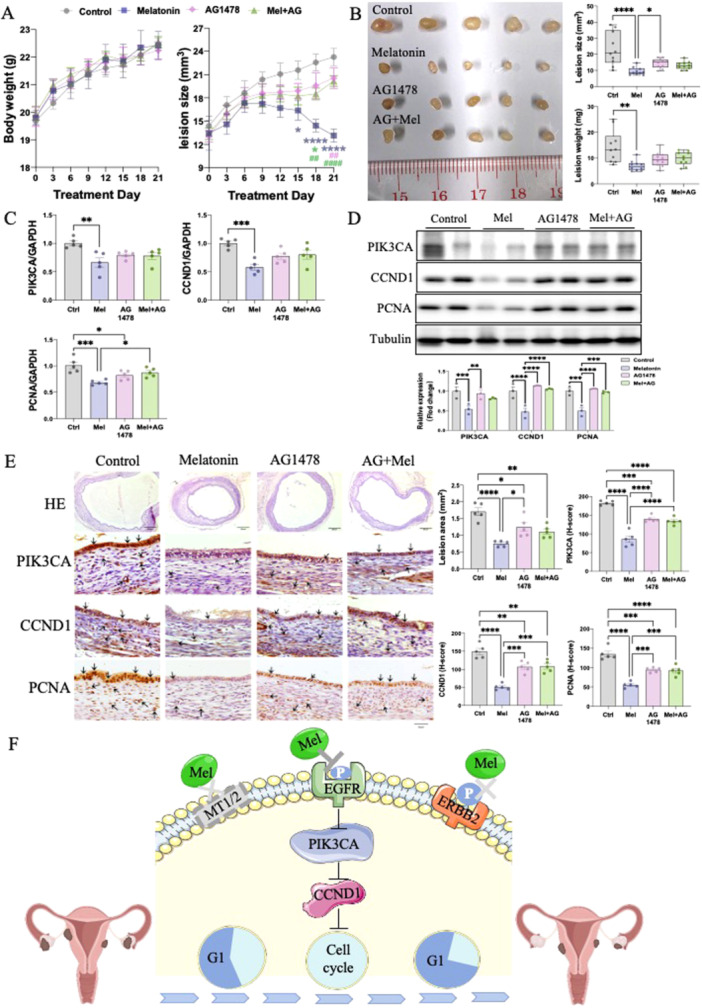
As a chronic gynecological disease, endometriosis is defined as the implantation of endometrial glands as well as stroma outside the uterine cavity. Proliferation is a major pathophysiology in endometriosis. Previous studies demonstrated a hormone named melatonin, which is mainly produced by the pineal gland, exerts a therapeutic impact on endometriosis. Despite that, the direct binding targets and underlying molecular mechanism have remained unknown. Our study revealed that melatonin treatment might be effective in inhibiting the growth of lesions in endometriotic mouse model as well as in human endometriotic cell lines. Additionally, the drug-disease protein-protein interaction (PPI) network was built, and epidermal growth factor receptor (EGFR) was identified as a new binding target of melatonin treatment in endometriosis. Computational simulation together with BioLayer interferometry was further applied to confirm the binding affinity. Our result also showed melatonin inhibited the phosphorylation level of EGFR not only in endometriotic cell lines but also in mouse models. Furthermore, melatonin inhibited the phosphatidylinositol-4,5-bisphosphate 3-kinase (PI3K)-protein kinase B (Akt) pathway and arrested the cell cycle via inhibiting CyclinD1 (CCND1). In vitro and in vivo knockdown/restore assays further demonstrated the involvement of the binding target and signaling pathway that we found. Thus, melatonin can be applied as a novel therapy for the management of endometriosis.

Keywords: CCND1; EGFR; PI3K/AKT; cell cycle; endometriosis; melatonin; proliferation.


Conflict of interest statement

The authors declare no conflict of interest.

Figures

Figure 1
Figure 1
Administration of melatonin suppressed the development of endometriotic lesions in C57/BL6 mice (n = 5/group). (A) In vivo mouse model (schematic). (B) Body weight and lesion size were measured every 2–3 d. (C) Representative images of endometriotic lesions implanted in mouse subcutaneous. After sacrificing, lesions were isolated, photographed, measured and weighted. (D) Representative H&E staining images of lesions. (E) IHC staining of Ki67 and PCNA in paraffin sections of lesions. *p < 0.05, **p < 0.01, ***p < 0.001, ****p < 0.0001.
Figure 2
Figure 2
Inhibitory effects of melatonin on the cell growth in endometriotic cells (n = 3/group). (A, D) MTT assay analysis of cell viability in 12Z and Hs 832(C).T cell lines with melatonin treatment. (B, E) Crystal violet stain assay of 12Z and Hs 832(C). T cell lines with melatonin treatment. (C, F) Cell cycle distribution of 12Z and Hs 832(C).T cell lines with melatonin treatment. *p < 0.05, **p < 0.01, ***p < 0.001, ****p < 0.0001.
Figure 3
Figure 3
Melatonin inhibits endometriosis via a non‐classic pathway. (A) IHC staining was performed to detect the expression levels of MT1 and MT2 in normal and endometriosis patients. (B) MT1 and MT2‐specific primers and visualized in agarose gels by ethidium bromide staining. (C) 117 collective targets of melatonin and endometriosis were identified. (D) Protein‐protein interaction network of these collective targets. The node sizes and colors are illustrated from red to yellow and big to small in descending order of degree values. (E, F) Gene Ontology (GO) and Kyoto Encyclopedia of Genes and Genomes (KEGG) analysis of collective targets of melatonin and endometriosis. Top 10 significantly enriched terms in biological processes (BPs), molecular functions (MFs) and cellular components (CCs) respectively. Top 20 significantly enriched KEGG pathways statistics. The X‐axis is the GeneRatio of the term and the Y‐axis is the name of the terms. The darker the color, the smaller the adjusted p‐value. The larger the circle, the greater the number of target genes in the term. (G) Distribution of the most potential therapeutic targets on significantly enriched PI3K‐AKT signaling pathway. The blue nodes represent key genes, the yellow nodes represent overlapping targets of melatonin and endometriosis targets, and the green nodes represent the other targets in the PI3K‐AKT signaling pathway. (H) The interaction of melatonin with EGFR and ERBB2 was analyzed by molecular docking. (I) The binding affinity of melatonin with EGFR and ERBB2 was measured by bio‐layer interferometry assay. (J, K) The levels of p‐EGFR and p‐ERBB2 with melatonin treatment in 12Z (n = 3) and Hs 832(C).T (n = 3) cell lines were evaluated by western blot analysis, and their relative intensity were calculated by Image J. NC (negative control), water. *p < 0.05, **p < 0.01, ***p < 0.001, ****p < 0.0001.
Figure 4
Figure 4
Inhibitory mechanism of melatonin on endometriosis in vitro (n = 3/group). (A, C) The RNA expression levels of PIK3CA, CCND1and PCNA in 12Z and Hs 832(C).T cells were determined by RT‐qPCR. (B, D) The protein expression levels of PIK3CA, CCND1and PCNA in 12Z and Hs 832(C).T cells were determined by western blot and their relative intensity were calculated by Image J. *p < 0.05, **p < 0.01, ***p < 0.001, ****p < 0.0001.
Figure 5
Figure 5
EGFR and PIK3CA directly mediate the inhibiting effects of melatonin in endometriotic cell lines (n = 3/group). 12Z and Hs 832(C).T cells were pretreated with vehicle control (DMSO), AG1478, or BYL719 for 1 h and then exposed to melatonin for 24 h. (A and C) The RNA expression levels of PIK3CA, CCND1and PCNA were determined by RT‐qPCR. (B, D) The protein expression levels of PIK3CA, CCND1and PCNA were determined by western blot and their relative intensity were calculated by Image J. 12Z and Hs 832(C).T Cells were transfected with 100 nM control siRNA (si‐Ctrl), EGFR siRNA (si‐EGFR) or PIK3CA siRNA (si‐PIK3CA) for 24 h and then treated with melatonin for 24 h. (E, G) The RNA expression levels of EGFR, PIK3CA, CCND1and PCNA were determined by RT‐qPCR. (F, H) The protein expression levels of EGFR, PIK3CA, CCND1and PCNA were determined by western blot and their relative intensity were calculated by Image J. *p < 0.05, **p < 0.01, ***p < 0.001, ****p < 0.0001.
Figure 5
Figure 5
EGFR and PIK3CA directly mediate the inhibiting effects of melatonin in endometriotic cell lines (n = 3/group). 12Z and Hs 832(C).T cells were pretreated with vehicle control (DMSO), AG1478, or BYL719 for 1 h and then exposed to melatonin for 24 h. (A and C) The RNA expression levels of PIK3CA, CCND1and PCNA were determined by RT‐qPCR. (B, D) The protein expression levels of PIK3CA, CCND1and PCNA were determined by western blot and their relative intensity were calculated by Image J. 12Z and Hs 832(C).T Cells were transfected with 100 nM control siRNA (si‐Ctrl), EGFR siRNA (si‐EGFR) or PIK3CA siRNA (si‐PIK3CA) for 24 h and then treated with melatonin for 24 h. (E, G) The RNA expression levels of EGFR, PIK3CA, CCND1and PCNA were determined by RT‐qPCR. (F, H) The protein expression levels of EGFR, PIK3CA, CCND1and PCNA were determined by western blot and their relative intensity were calculated by Image J. *p < 0.05, **p < 0.01, ***p < 0.001, ****p < 0.0001.
Figure 6
Figure 6
Inhibitory mechanism of melatonin on endometriosis in vivo (n = 5/group). (A) Body weight and lesion size were measured every 2–3 d throughout the treatments. (B) Representative endometriotic lesions were photographed, measured, and weighed from each group. (C) PIK3CA, CCND1and PCNA mRNA levels in endometriotic lesions were examined by RT‐qPCR. The protein expression levels of PIK3CA, CCND1and PCNA in each group were determined by western blot and their relative intensity was calculated by Image J. (E) Representative H&E staining images of lesions. IHC staining of PIK3CA, CCND1 and PCNA in paraffin sections of lesions. (F) Schematic representation of melatonin‐induced mechanisms in endometriosis. *p < 0.05, **p < 0.01, ***p < 0.001, ****p < 0.0001.

Similar articles

References

    1. Zondervan K. T., Becker C. M., and Missmer S. A., “Endometriosis,” Longo D. L., ed. The New England Journal of Medicine 382, no. 13 (2020): 1244–1256, 10.1056/NEJMra1810764. - DOI - PubMed
    1. Bulun S. E., Yilmaz B. D., Sison C., et al., “Endometriosis,” Endocrine Reviews 40, no. 4 (2019): 1048–1079, 10.1210/er.2018-00242. - DOI - PMC - PubMed
    1. Fuldeore M. J. and Soliman A. M., “Prevalence and Symptomatic Burden of Diagnosed Endometriosis in the United States: National Estimates From a Cross‐Sectional Survey of 59,411 Women,” Gynecologic and Obstetric Investigation 82, no. 5 (2017): 453–461, 10.1159/000452660. - DOI - PubMed
    1. Sampson J. A., “Peritoneal Endometriosis Due to the Menstrual Dissemination of Endometrial Tissue Into the Peritoneal Cavity,” American Journal of Obstetrics and Gynecology 14, no. 4 (1927): 422–469, 10.1016/s0002-9378(15)30003-x. - DOI
    1. Nap A. W., “Theories on the Pathogenesis of Endometriosis,” in Endometriosis: Science and Practice, 1st ed. (2012): 42–53, 10.1002/9781444398519.ch5. - DOI