[Preprint]. 2024 Dec 11:rs.3.rs-5566817.
doi: 10.21203/rs.3.rs-5566817/v1.

Desaturase-dependent secretory functions of hepatocyte-like cells control systemic lipid metabolism during starvation in Drosophila

Affiliations

Desaturase-dependent secretory functions of hepatocyte-like cells control systemic lipid metabolism during starvation in Drosophila

Jiayi Li et al. Res Sq. .

Abstract

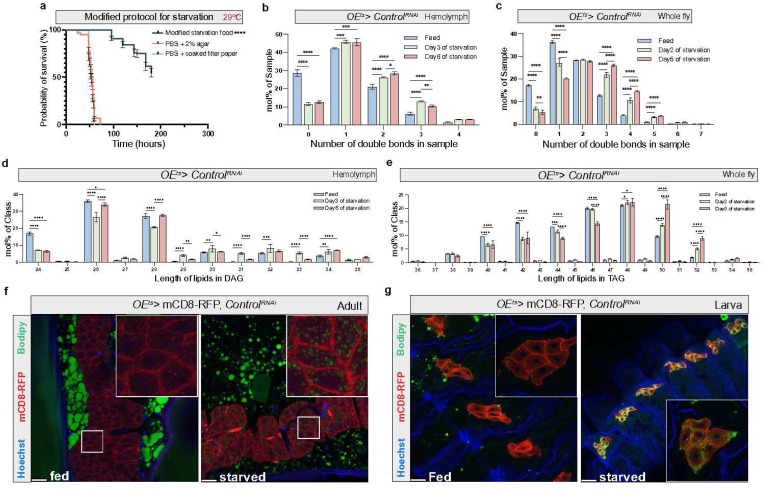
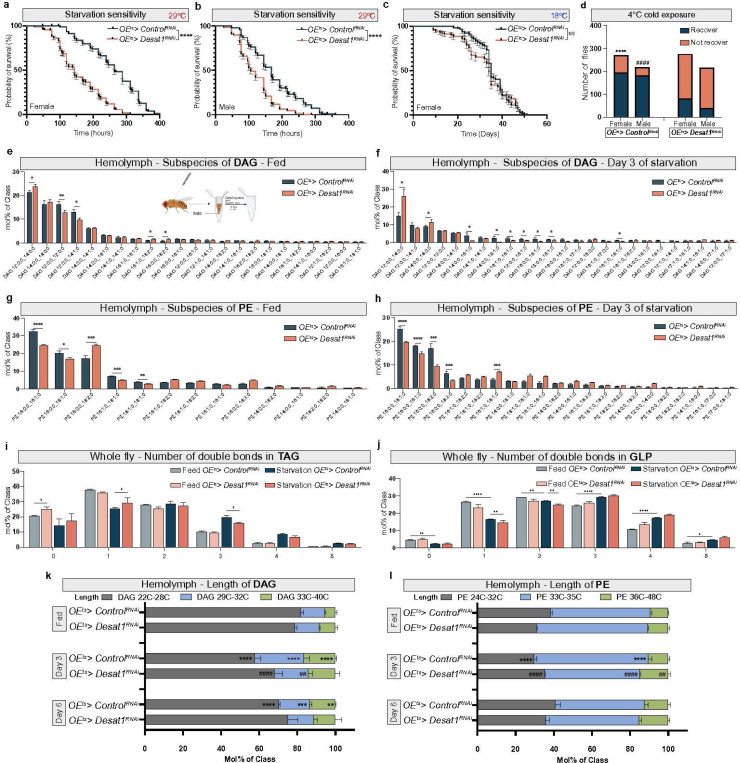
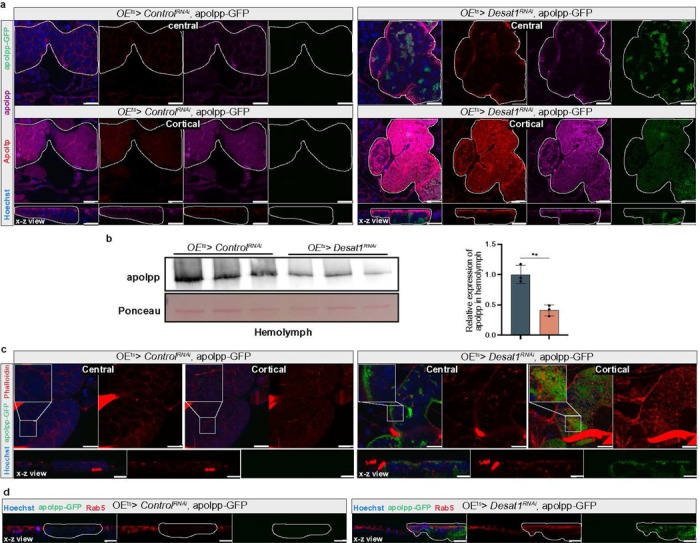
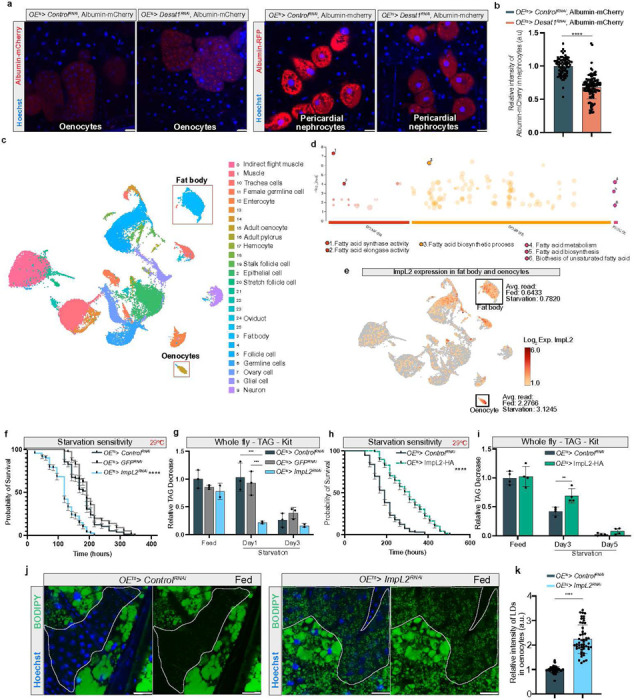
Similar to the mammalian hepatocytes, Drosophila oenocytes accumulate fat during fasting, but it is unclear how they communicate with the fat body, the major lipid source. Using a modified protocol for prolonged starvation, we show that knockdown (KD) of the sole delta 9 desaturase, Desat1 (SCD in mammals), specifically in oenocytes leads to more saturated lipids in the hemolymph and reduced triacylglycerol (TAG) storage in the fat body. Additionally, oenocytes with Desat1 KD exhibited an accumulation of lipoproteins and actin filaments at the cortex, which decreased lipoproteins in the hemolymph. We further show that ImpL2 (IGFBP7 in mammals) is secreted from oenocytes during starvation in a Desat1-dependent manner. Flies with oenocyte-specific KD and overexpression of ImpL2 exhibited higher and lower sensitivity to starvation as well as lower and higher levels of TAG, respectively. Intriguingly, the depolymerization of cortical actin in the oenocytes decreased lipoprotein sequestration and alleviated the secretion defect of Impl2 in Desat1 KD cells, leading to rescued TAG levels and starvation sensitivity. Overall, this study highlights the central role of oenocytes in systemic lipid metabolism in Drosophila as well as the importance of Desat1 in maintaining the proper functioning of oenocytes during periods of starvation.


Conflict of interest statement

Additional Declarations: There is NO Competing Interest.

Figures

Figure 1
Figure 1
Lipidome shifts in adult Drosophila during starvation a, Starvation sensitivity assay using a modified protocol for long-term starvation experiments, n≈120 adult female flies. P value was calculated using Log-rank (Mantel-Cox) test. PBS, Phosphate Buffered Saline. b,c, The number of double bonds in hemolymph or whole fly samples at different days of starvation, n=3. Statistical tests: two-way ANOVA with Tukey’s multiple comparisons test. d,e, Length analysis of major lipids class from hemolymph or whole fly samples, n=3. Statistical tests: two-way ANOVA with Tukey’s multiple comparisons test. f,g, Lipid droplets (LD) were visualized with BODIPY (green) during modified starvation protocol in adult flies and during PBS starvation in larvae. Cell outlines were marked with mCD8-RFP (red). Scale bars, 20μm. *, P< 0.05; **, P<0.01; ***, P<0.001; ****, P<0.0001. Error bars indicate standard deviation
Figure 2
Figure 2
OEts>Desat1RNAi flies exhibit altered lipid profiles and higher sensitivity to starvation and cold stress a,b, OEts>Desat1RNAi adult flies show higher starvation sensitivity at 29°C compared with OEts> ControlRNAi flies in both male and female, n=270 in female flies and n=238 in male flies. P value was calculated using Log-rank (Mantel-Cox) test. c, OEts>Desat1RNAi adult female flies show no different in lifetime during starvation compared with control group at 18°C, n=113, P value was calculated using Log-rank (Mantel-Cox) test. d, Both OEts>Desat1RNAi adult female and male flies show a better recovery from cold exposure. 24 hours cold exposure for male adult flies and 48 hours for female flies, n≈217 for male, n≈270 for female. P value was calculated using Chi-square, ****P<0.0001: female OEts>Desat1RNAi vs. OEts>ControlRNAi flies, ####P<0.0001: male OEts> Desat1RNAi vs. OEts>ControlRNAi flies. e-h, Subspecies lipid analysis (diacylglycerol (DAG) and phosphatidylethanolamine (PE)) of hemolymph samples between Desat1 KD and control groups in fed or starvation conditions, n=3. Statistical tests: multiple unpaired t tests. i,j, The number of double bonds in triacylglycerol (TAG) and GLP (glycerophospholipids) from flies samples in fed or starvation conditions, n=3. Statistical tests: two-way ANOVA with Tukey’s multiple comparisons test. k,l, Changes in the percentage of different chain lengths of DAG and PE in hemolymph during starvation, n=3. Statistical tests: two-way ANOVA with Tukey’s multiple comparisons test. #: OEts>Desat1RNAi flies at day 3 of starvation vs. OEts>ControlRNAi flies day 3 of starvation, *: OEts>ControlRNAi flies at day 3 or day 6 of starvation vs. OEts>ControlRNAi flies at feed condition. *, P<0.05; **, P<0.01; ***, P<0.001; ****, P<0.0001. ##, P<0.01; ####, P<0.0001. Error bars indicate standard deviation.
Figure 3
Figure 3
OEts > Desat1RNAi adult flies exhibit a faster lipid consumption in the fat body during starvation a, the amount of DAG and PE at different days of starvation in hemolymph between OEts> Desat1RNAi adult female flies and OEts>ControlRNAi adult female flies measured by mass spectrometry, n=3. Statistical tests: two-way ANOVA with Tukey’s multiple comparisons test. b, The amount of TAG at different days of starvation in whole fly sample between OEts>Desat1RNAi and OEts>ControlRNAi adult female flies measured by lipidomics, n=3. Statistical tests: two-way ANOVA with Tukey’s multiple comparisons test. c, the BODIPY intensity in oenocyte or surround fat body during different days of starvation. d,e, LD staining (green) at different days of starvation. mCD8-RFP (red) was overexpressed in oenocytes to mark the the oenocytes (dashed line). Scale bars: 20 μm. f, TAG level at different days of starvation in control, Desat1 KD and double KD of Desat1 and bmm specifically in oenocytes measured by TAG kit, n=4. Statistical tests: two-way ANOVA with Tukey’s multiple comparisons test. *: OEts>ControlRNAi vs. OEts>Desat1RNAi or OEts> Desat1RNAi, bmmRNAi adult female flies. g, TAG level at different days of starvation measured by TAG kit, n=3. Statistical tests: two-way ANOVA with Tukey’s multiple comparisons test. *: Desat1 KD group vs. all other groups. h, Starvation sensitivity assay between control flies, Desat1 KD flies and Desat1 KD flies carrying one alle of bmm loss-of-function mutation, n=180. P value was calculated using Log-rank (Mantel Cox) test. *, P<0.05; ****, P<0.0001. Error bars indicate standard deviation.
Figure 4
Figure 4
OEts > Desat1RNAi flies causes lipoprotein sequestering in the oenocyte cortex a, Representative immunofluorescence images of lipoproteins in central or cortical sections of oenocytes with or without Desat1 KD. Oenocytes with Desat1 KD exhibit a strong lipoprotein accumulation in the cortex region. X-z view displayed a vertical cross-section along the X-axis and dashed lines showed the oenocytes. Note that the gain in the Desat1 KD group (right panel) was decreased by around 40% to avoid the saturation of image. n>4, scale bars: 20μm. b, Western blot analysis of apolpp in hemolymph from control and Desat1 KD group and quantification of hemolymph apolpp level in hemolymph. Only one band was seen after Ponceau staining, and this was used for normalization. n=3, statistical tests: unpaired t test. c, Representative immunofluorescence images of phalloidin (red) and endogenous apolpp-GFP (green) in central or cortical sections of of oenocytes with or without Desat1 KD. n=3, scale bars: 20 μm. d, X-z view of Rab5 staining and apolpp-GFP with and without Desat1 KD. Dashed lines mark the oenocytes, n=3, scale bars: 20 μm
Figure 5
Figure 5
Lowering of F-actin can rescue the sequestration of lipoproteins in oenocytes with Desat1 KD a, Representative immunofluorescence images of phalloidin (red) in central or cortical sections of oenocytes. Actin depolymerization via knocking down Limk1 or overexpressing Tsr reduces cortical actin accumulation. n=4, scale bars: 20 μm. b, Representative immunofluorescence images of apoLpp in central or cortical sections of oenocytes. Dashed lines mark the oenocytes, n=3, scale bars: 20 μm. c, Western blot analysis of apolpp in the hemolymph. OEts>Desat1RNAi exhibit a reduced level of apolpp in the hemolymph compared with OEts>ControlRNAi, which can be rescued by actin depolymerization. Only one band was seen after Ponceau staining, and this was used for normalization. d, Quantification of apolpp in hemolymph, n=6. Statistical tests: one-way ANOVA. *, P<0.05; **, P<0.01; ****, P<0.0001
Figure 6
Figure 6
Single-nucleus RNA-seq identifies ImpL2 as important factor during starvation a, Representative immunofluorescence images of albumin-mCherry in oenocytes or pericardial nephrocytes. Albumin-mCherry secreted by oenocytes into the hemolymph is taken up by pericardial nephrocytes. n=4. b, Quantification of relative intensity of albumin-mCherry in pericardial nephrocytes, each data point represents the relative intensity of albumin-mCherry in a pericardial nephrocyte. scale bars: 20 μm. Statistical tests: unpaired t test, ****, P<0.0001. c, A uniform manifold approximation and projection (UMAP) plot. Each color and dot in the plot represented a cluster and a single nucleus, respectively. d, Gene enrichment analysis of these significant different genes (day 2 of starvation vs. fed) was performed demonstrating that many genes were involved in lipid metabolism. e, ImpL2 expression pattern shows a high expression level of impL2 in oenocytes. f, Starvation assay in flies with oenocytes specific ImpL2 knockdown at 29°C. Both OEts>ControlRNAi and OEts>GFPRNAi flies were represented control groups. n=151, P value was calculated using Log rank (Mantel-Cox) test. ****, P<0.0001, OEts>ImpL2RNAi vs. OEts>ControlRNAi or OEts>GFPRNAi. g, TAG levels in whole fly sample were measured at different time point of starvation. n=3, statistical tests: two-way ANOVA with Tukey’s multiple comparisons test. ***, P<0.001. h, Starvation assay in flies with oenocytes specific ImpL2-HA overexpression at 29°C. n=200, P value was calculated using Log-rank (Mantel-Cox) test. ****, P<0.0001. i, TAG level in whole fly sample were measured by TAG kit at different time point of starvation. n=4, statistical tests: multiple unpaired t tests. **, P<0.01. j, LDs (green) during fed condition in oenocytes with ImpL2 knockdown, n=3. k, Quantification of relative intensity of LDs in oenocytes, each data point represented the relative intensity of BODIPY signal in a cluster of oenocytes. Dashed lines mark the oenocytes. Statistical tests: multiple unpaired t tests, ****, P<0.0001. Error bars indicate standard deviation
Figure 7
Figure 7
Lowering F-actin rescues the impaired secretion of ImpL2 from oenocytes leading to better starvation resistance a, ImpL2-HA overexpression in oenocytes with or without Desat1 deficiency. ImpL2-HA (red) accumulates in oenocytes in the Desat1 KD group. X-z view shows cortical accumulation in oenocytes (marked by dashed line), n>4, scale bars: 20 μm. b, Quantification of relative intensity of ImpL2-HA in oenocytes, each data point represented the relative intensity of ImpL2-HA signal in a cluster of oenocytes. Statistical tests: multiple unpaired t tests. c, Western blot analysis of ImpL2 in the hemolymph. OEts>Desat1RNAi exhibited a reduced level of ImpL2 in the hemolymph, which can be rescued by actin depolymerization, n=5. d, Quantification of ImpL2 level in hemolymph. Statistical tests: one-way ANOVA, **, P<0.01; ***, P<0.001. e, TAG levels at different days of starvation in whole fly sample measured by TAG kit, n=5. Statistical tests: one-way ANOVA. **, P<0.01; ***, P<0.001. f, starvation assay at 29℃. n=150, P value was calculated using Log rank (Mantel-Cox) test. ****, P<0.0001.
Figure 8
Figure 8
Overview of the role of oenocytes in systemic metabolism during starvation and the impairment by Desat1 deficiency

Similar articles

References

    1. Steinhauser M. L. et al. The circulating metabolome of human starvation. JCI Insight 3, (2018). - PMC - PubMed
    1. Gonzalez-Gil A. M. & Elizondo-Montemayor L. The Role of Exercise in the Interplay between Myokines, Hepatokines, Osteokines, Adipokines, and Modulation of Inflammation for Energy Substrate Redistribution and Fat Mass Loss: A Review. Nutrients 12, 1899 (2020). - PMC - PubMed
    1. Rajan A. & Perrimon N. Drosophila as a Model for Interorgan Communication: Lessons from Studies on Energy Homeostasis. Dev Cell 21, 29–31 (2011). - PMC - PubMed
    1. Gutierrez E., Wiggins D., Fielding B. & Gould A. P. Specialized hepatocyte-like cells regulate Drosophila lipid metabolism. Nature 445, 275–80 (2007). - PubMed
    1. Tsai J.-H. et al. Aggressive non-alcoholic steatohepatitis following rapid weight loss and/or malnutrition. Mod Pathol 30, 834–842 (2017). - PMC - PubMed

Publication types

LinkOut - more resources