[Preprint]. 2024 Dec 11:rs.3.rs-5182601.
doi: 10.21203/rs.3.rs-5182601/v1.

Towards pandemic preparedness: ability to estimate high-resolution social contact patterns from longitudinal surveys

Affiliations

Towards pandemic preparedness: ability to estimate high-resolution social contact patterns from longitudinal surveys

Shozen Dan et al. Res Sq. .

Update in

Abstract

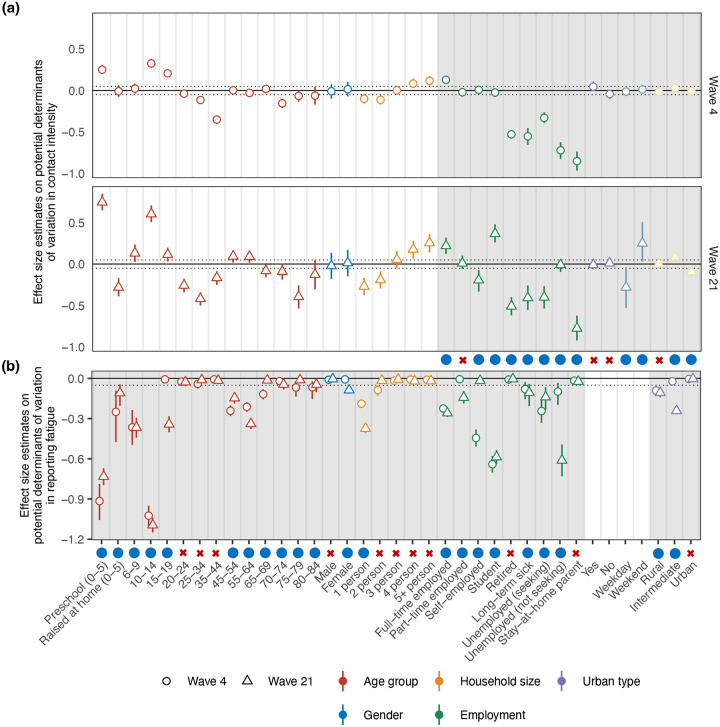
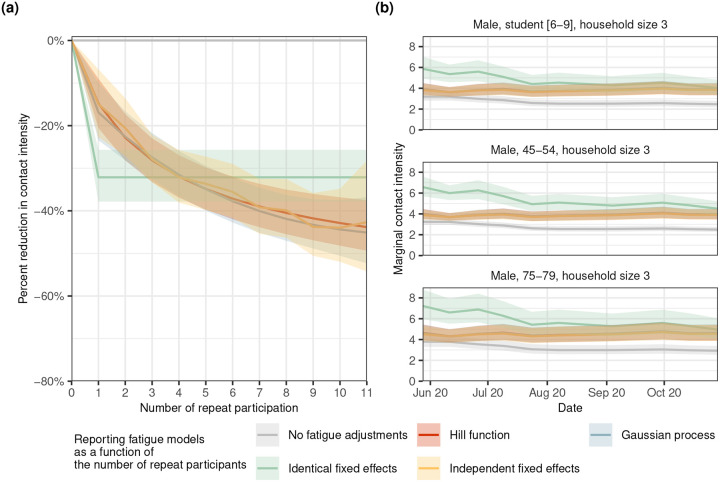
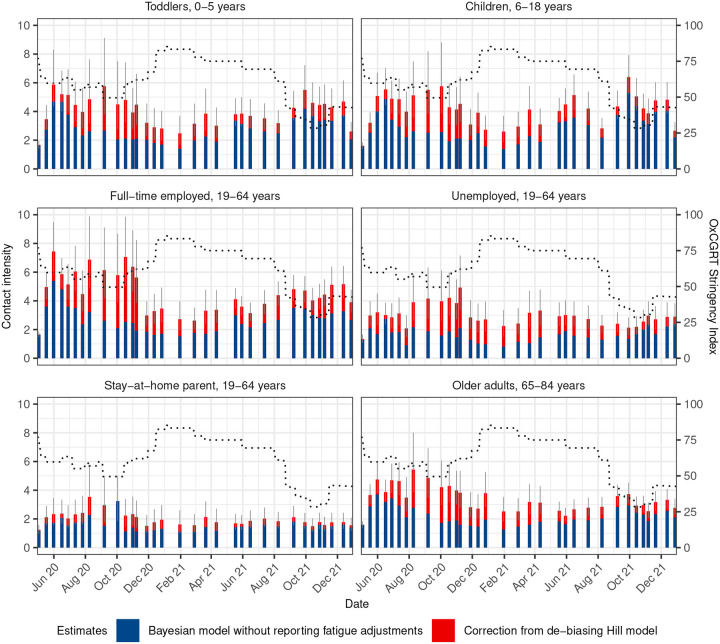
Social contact surveys are an important tool to assess infection risks within populations, and the effect of non-pharmaceutical interventions on social behaviour during disease outbreaks, epidemics, and pandemics. Numerous longitudinal social contact surveys were conducted during the COVID-19 era, however data analysis is plagued by reporting fatigue, a phenomenon whereby the average number of social contacts reported declines with the number of repeat participations and as participants' engagement decreases over time. Using data from the German COVIMOD Study between April 2020 to December 2021, we demonstrate that reporting fatigue varied considerably by sociodemographic factors and was consistently strongest among parents reporting children contacts (parental proxy reporting), students, middle-aged individuals, those in full-time employment and those self-employed. We find further that, when using data from first-time participants as gold standard, statistical models incorporating a simple logistic function to control for reporting fatigue were associated with substantially improved estimation accuracy relative to models with no reporting fatigue adjustments, and that no cap on the number of repeat participations was required. These results indicate that existing longitudinal contact survey data can be meaningfully interpreted under an easy-to-implement statistical approach adressing reporting fatigue confounding, and that longitudinal designs including repeat participants are a viable option for future social contact survey designs.


Conflict of interest statement

Additional Declarations: No competing interests reported. Competing interests The authors declare no competing interests.

Figures

Figure 1.
Figure 1.. Longitudinal contact intensity estimates during the COVID-19 pandemic in Germany.
(a) Longitudinal structure of 33 survey waves of the COVIMOD contact survey study, showing sample sizes for each survey wave on the y-axis. Colours indicate the number of repeat participations of each participant in previous survey waves. (b): Longitudinal, national-level contact intensity estimates (point: simple bootstrap mean or posterior median estimate, linerange: 95% bootstrap confidence or 95% credible intervals) are shown according to different estimation approaches: Bayesian model using data from first-time participants only, for waves with more than 300 first-time participants (orange); simple bootstrap using data from all participants and not accounting for reporting fatigue (blue), Bayesian model using data from all participants and not adjusting for reporting fatigue (pink); Bayesian model using data from all participants and adjusting for reporting fatigue (purple). The dashed line represents the OxCGRT Stringency Index with higher values indicating a higher degree of contact restrictions (min: 0, max: 100).
Figure 2.
Figure 2.. Effect size estimates on determinants of variation in contact intensity and reporting fatigue in the variable selection models.
(a) Posterior effect size estimates on contact intensity determinants in the variable selection model on survey data from survey waves 4 and 21 (circles and triangles: posterior median estimate in the Bayesian model using data from first-time participants, linerange: corresponding 50% credible intervals) relative to the overall baseline contact intensity term in the model. Gray solid lines denote the average contact intensity, and gray dotted lines the variable selection cutoff threshold (> ±5% change). White background indicates features that were always included in the model, and grey background indicates features that were tested for inclusion through Bayesian variable selection. Blue solid dots denote selected variables and red crosses denote variables that were not identified to have > ±5% deviations in average contact intensities. (b) Posterior effect size estimates on reporting fatigue determinants in the variable selection model on survey data from survey waves 4 and 21 (points: posterior median estimate in the Bayesian model using data from repeating participants, linerange: corresponding 50% credible intervals) relative to no effect. Other plot features are as in subfigure (a), except that the gray solid lines denotes no change in contact intensity as compared to first-time participants in the same subgroup, and the gray dotted line denotes the variable selection cutoff threshold (> 5% decrease).
Figure 3.
Figure 3.. Dynamics in the severity of reporting fatigue with increasing repeat participation in the COVIMOD Study.
(a) Estimated percent reduction in contact intensity as a function of the number of repeat participation for no reporting fatigue adjustments (gray), the Hill model (red), the Gaussian process model (blue), the identical fixed effects model (green), and the independent effects model (yellow) (line: posterior median estimate, ribbon: 95% credible interval). (b) Estimated longitudinal contact intensities for men aged 6–9, 45–54, and 75–79 years living in a 3-person household for no reporting fatigue adjustments (gray), the Hill model (red), the Gaussian Process model (blue), the identical fixed effects model (green), and the independent effects model (yellow)
Figure 4.
Figure 4.. Accuracy of the reporting fatigue Hill model in de-biasing age-specific contact intensity estimates from wave 21 of the COVIMOD Study.
(a) Posterior median contact intensity estimates for ages 0 to 84 during the COVIMOD survey wave 21, obtained from the reporting fatigue Hill model that adjusts for population subgroup-specific reporting fatigue effects via separate Hill functions (left) and the same model without reporting fatigue adjustments (right). In both panels, the gold curve represent posterior median estimates obtained from first-time participants. Coloured curves represent the posterior median estimates obtained from including participants with increasingly larger maximum number of repeats participations. (b) Mean absolute percentage error between the baseline (gold curve) and estimates obtained from the reporting fatigue Hill model on data including participants with more repeats (turquoise) and from the same model without reporting fatigue adjustments(purple). (c) Proportion of posterior median age-specific contact intensity estimates from data of first-time participants that fell within the 95% credible intervals of the posterior age-specific estimates of the reporting fatigue Hill model on data including participants with more repeats.
Figure 5.
Figure 5.. De-biased longitudinal contact intensity estimates during the COVID-19 pandemic in Germany.
Posterior median contact intensity estimate corrections for eight different population subgroups from the de-biasing Hill model (turquoise) on top of posterior median contact intensity estimates derived without reporting fatigue adjustments (orange). 95% credible intervals of the debiased contact intensity estimates from the Hill model are shown as lineranges. The purple dashed lines denote the OxCGRT stringency index. Percent relative corrections of estimates from the Hill model against the Bayesian model without reporting fatigue adjustments are given in Supplemental Figure 2.

Similar articles

References

    1. James S. L. et al. Global, regional, and national incidence, prevalence, and years lived with disability for 354 diseases and injuries for 195 countries and territories, 1990–2017: a systematic analysis for the Global Burden of Disease Study 2017. The Lancet 392, 1789–1858, DOI: 10.1016/S0140-6736(18)32279-7 (2018). Publisher: Elsevier. - DOI - PMC - PubMed
    1. Roth G. A. et al. Global, regional, and national age-sex-specific mortality for 282 causes of death in 195 countries and territories, 1980–2017: a systematic analysis for the Global Burden of Disease Study 2017. The Lancet 392, 1736–1788, DOI: 10.1016/S0140-6736(18)32203-7 (2018). Publisher: Elsevier. - DOI - PMC - PubMed
    1. Brankston G., Gitterman L., Hirji Z., Lemieux C. & Gardam M. Transmission of influenza A in human beings. The Lancet Infect. Dis. 7, 257–265, DOI: 10.1016/S1473-3099(07)70029-4 (2007). Publisher: Elsevier. - DOI - PubMed
    1. Killingley B. & Nguyen-Van-Tam J. Routes of influenza transmission. Influ. Other Respir. Viruses 7, 42–51, DOI: 10.1111/irv.12080 (2013). _eprint: https://onlinelibrary.wiley.com/doi/pdf/10.1111/irv.12080. - DOI - DOI - PMC - PubMed
    1. Mousa A. et al. Social contact patterns and implications for infectious disease transmission – a systematic review and meta-analysis of contact surveys, DOI: 10.7554/eLife.70294 (2021). Publisher: eLife Sciences Publications Limited. - DOI - PMC - PubMed

Publication types

LinkOut - more resources