[Preprint]. 2024 Dec 11:rs.3.rs-5510856.
doi: 10.21203/rs.3.rs-5510856/v1.

A novel behavioral paradigm reveals the nature of confidence computation in multi-alternative perceptual decision making

Affiliations

A novel behavioral paradigm reveals the nature of confidence computation in multi-alternative perceptual decision making

Kai Xue et al. Res Sq. .

Abstract

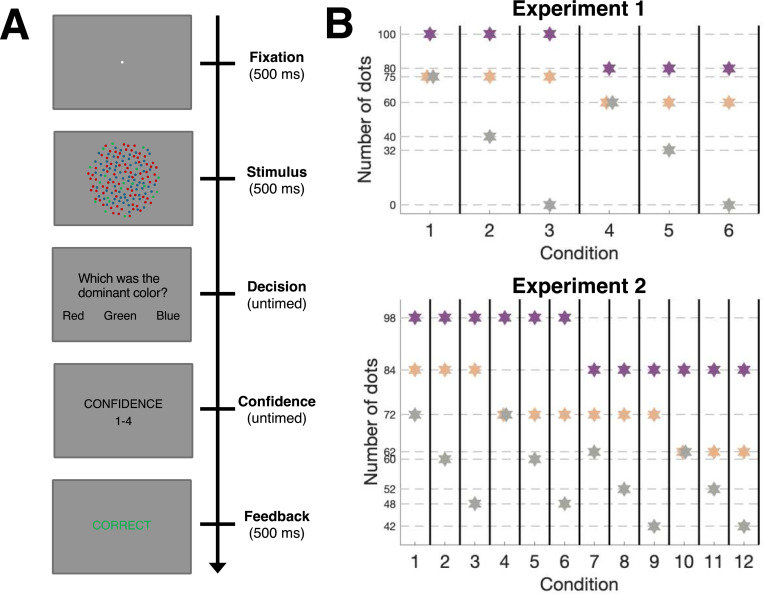
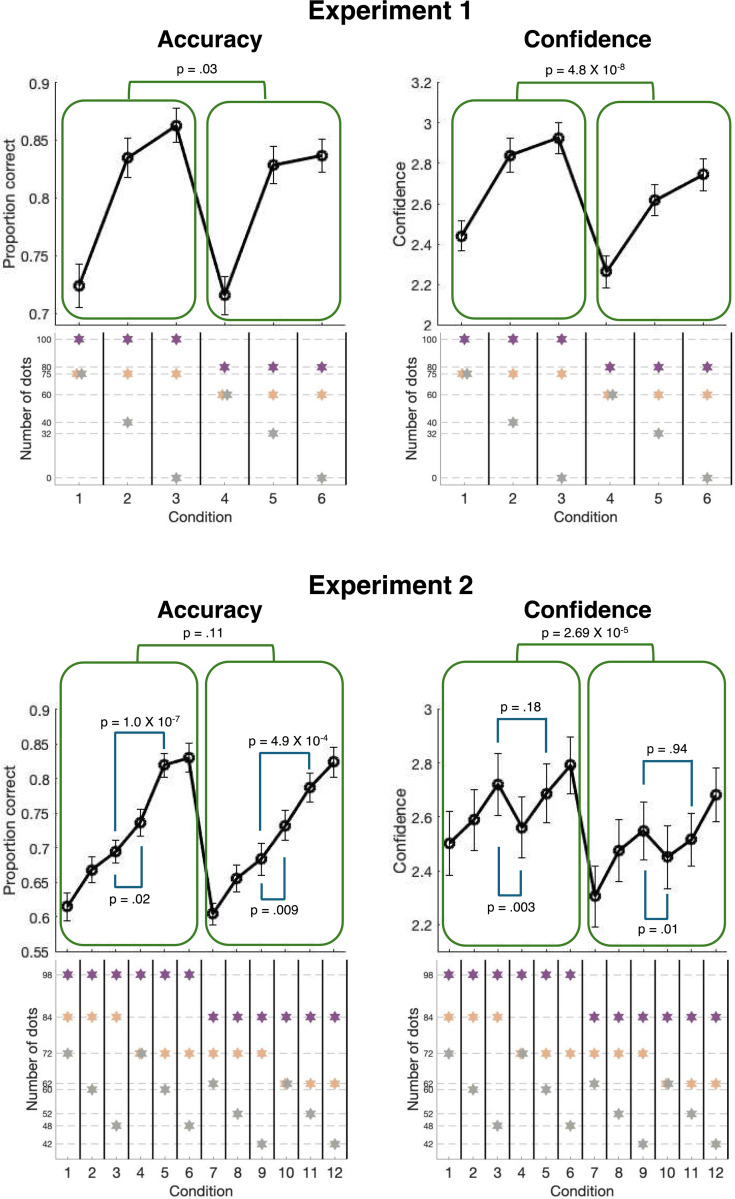
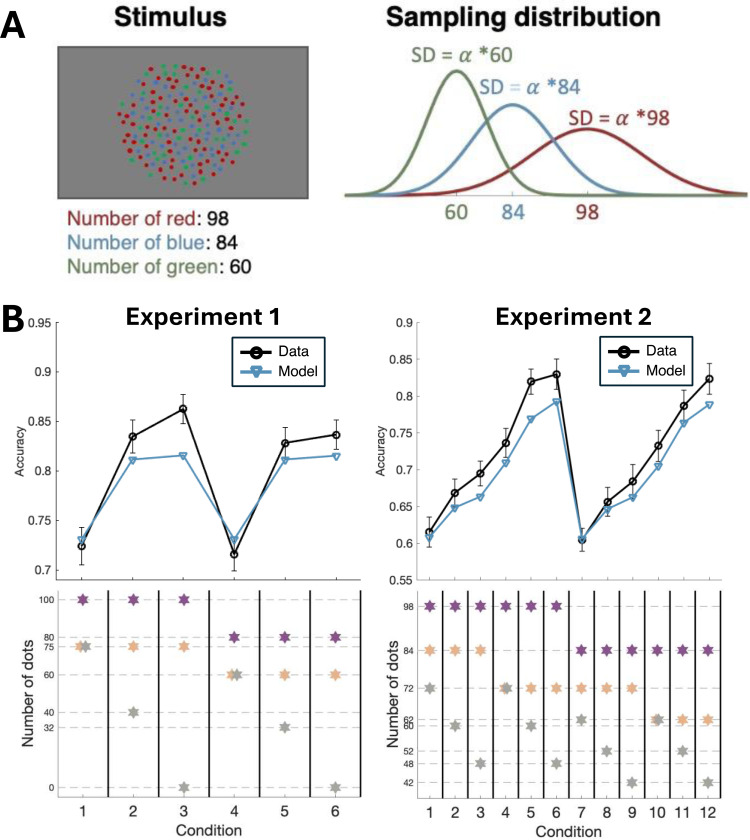
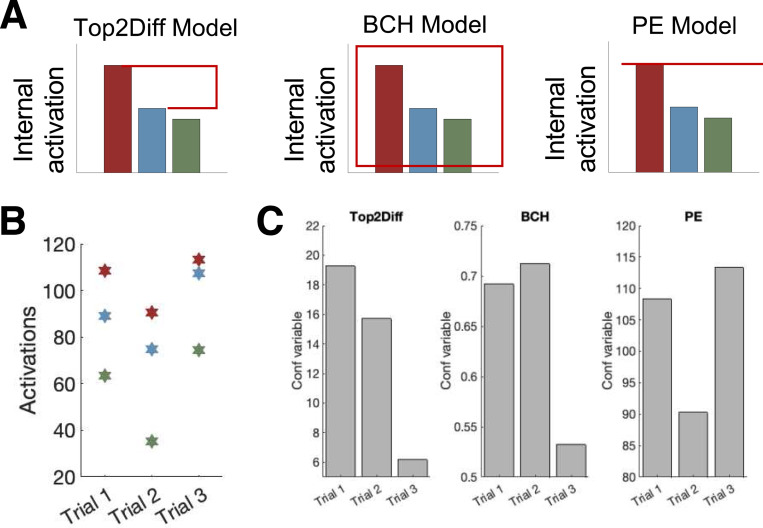
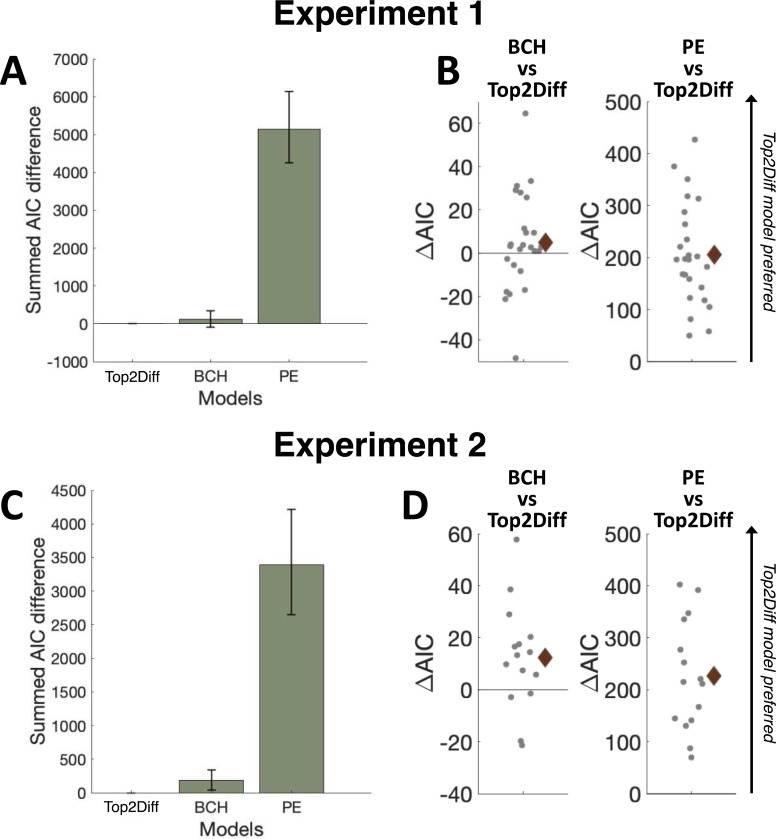
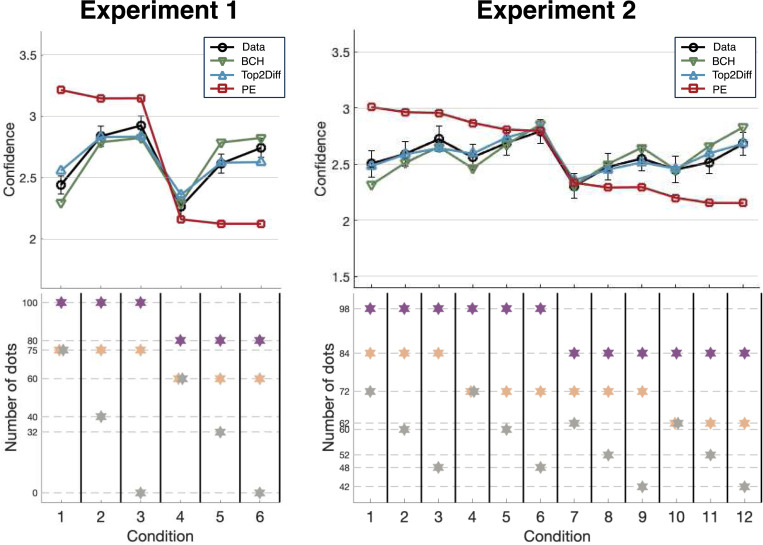
A central goal of research in perceptual decision making is to determine the internal computations underlying choice and confidence in complex, multi-alternative tasks. However, revealing these computations requires knowledge of the internal representation upon which the computations operate. Unfortunately, it is unknown how traditional stimuli (e.g., Gabor patches and random dot motion) are represented internally, which calls into question the computations inferred when using such stimuli. Here we develop a new behavioral paradigm where subjects discriminate the dominant color in a cloud of differently colored dots. Critically, we show that the internal representation for these stimuli can be described with a simple, one-parameter equation and that a single free parameter can explain multi-alternative data for up to 12 different conditions. Further, we use this paradigm to test three popular theories: that confidence reflects (1) the probability of being correct, (2) only choice-congruent (i.e., positive) evidence, or (3) the evidence difference between the highest and the second-highest signal.The predictions of the first two theories were falsified in two experiments involving either six or 12 conditions with three choices each. We found that the data were best explained by a model where confidence is based on the difference of the two alternatives with the largest evidence. These results establish a new paradigm in which a single parameter can be used to determine the internal representation for an unlimited number of multi-alternative conditions and challenge two prominent theories of confidence computation.

Keywords: Confidence; computational models; metacognition; perceptual decision making.


Conflict of interest statement

Additional Declarations: There is NO Competing Interest.

Figures

Figure 1.
Figure 1.. Experimental design.
(A) Trial structure. On each trial, we presented a cloud of dots of three different colors. Subjects first indicated the dominant color (i.e., the color with the largest number of dots) and then rated their confidence on a 4-point scale. They received trial-by-trial feedback in both experiments. (B) Number of dots in each condition. Experiment 1 (top) included six conditions. In conditions 1–3, the highest dot number was always 100, the second highest was always 75, and the lowest changed across conditions to be 75, 40, and 0. In conditions 4–6, all dot numbers were 80% of the ones in conditions 1–3. Experiment 2 (bottom) included 12 conditions. In conditions 1–6, the highest dot number was always 98, while the second highest was 84 in conditions 1–3 and 72 in conditions 4–6. The lowest dot numbers took the values 72, 60, and 48 for both conditions 1–3 and 4–6. In conditions 7–12, all dot numbers were about 85.7% of the ones in conditions 1–6, such that the highest number was always 84, the second highest was 72 or 62, and the lowest was 62, 52, or 42. The purple, orange, and gray stars represent the colors with the highest, second highest, and lowest dots numbers.
Figure 2.
Figure 2.. Accuracy and confidence for each condition in Experiments 1 and 2.
The left two panels display accuracy data, and the right two panels display confidence data. The top two panels depict results from Experiment 1, and the bottom two panels depict results from Experiment 2. The number of dots in each condition is at the bottom of each figure. Green boxes represent the Numerosity effect, while the blue lines represent the adjacent option effect. Error bars represent SEM.
Figure 3.
Figure 3.. Modeling internal activation and decision.
(A) The stimulus is a cloud of dots with different colors and we used the condition 2 in Experiment 2 as an example here. We modeled the internal activations for each color as a Gaussian distribution with a mean that is equal to the number of dots of that color and standard deviation that is equal to the number of dots of that color times a fixed parameter alpha (α). On a given trial, the activations for the three colors are obtained by independently sampling from the three distributions. (B) Model fit for the 1-parameter model (blue) overlaid on the empirical data (black). Despite its extreme simplicity, the 1-parameter model fits the empirical choice data well. Error bars depict SEM.
Figure 4.
Figure 4.. Confidence models.
(A) Graphical depiction of the computations assumed by each model. The Top-2 Difference model (Top2Diff) computes confidence based on the difference in evidence for the top two options. The Bayesian Confidence Hypothesis (BCH) computes confidence based on the probability that the perceptual decision is correct. The Positive Evidence model (PE) computes confidence based on the strength of the evidence for the chosen option only. (B) Internal activations for red, blue, and green in three example trials. (C) The value of the confidence variable according to each model for the three trials in panel B. Top2Diff, BCH, and PE predict the highest confidence for trials 1, 2, and 3, respectively. Note that the confidence variables cannot be meaningfully compared across models.
Figure 5.
Figure 5.. Model fitting results.
(A) Summed AIC difference scores between each model and the best fitting model in Expt1. The error bar shows the 95% bootstrapped confidence interval. The Top2Diff model provided better fits compared to the BCH and the PE models. (B) The AIC difference between the BCH or the PE and the Top2Diff model for individual subjects in Expt 1. A positive value indicates that the Top2Diff model is preferred. The Top2Diff model outperformed the BCH model for 17 out of 25 subjects and outperformed the PE model for all 25 subjects. The brown diamond shows the mean value of the AIC differences across subjects. (C) Summed AIC difference scores between each model and the best fitting model in Expt 2. The Diff model significantly outperformed both the BCH and the Top2Diff model. (D). The AIC difference between the BCH or the PE and the Diff model for individual subjects in Expt2. The Top2Diff model outperformed the BCH model for 11 out of 15 subjects and outperformed the PE model for all 15 subjects.
Figure 6.
Figure 6.. Confidence models fits.
The predicted confidence for each of the three models – Top2Diff, BCH, and PE – is plotted against their observed values. The black lines show the observed values, and the colored lines show the predicted values for each model. For both Experiments 1 and 2, the Top2Diff model provides the best fit to the data, with the BCH model providing an almost equally good fit. In contrast, the PE model completely failed to capture the pattern of the observed confidence data. Error bars show SEM.

Similar articles

References

    1. Abid G. (2019). Deflating inflation: The connection (or lack thereof) between decisional and metacognitive processes and visual phenomenology. Neuroscience of Consciousness, 2019(1), niz015. 10.1093/nc/niz015 - DOI - PMC - PubMed
    1. Acerbi L., & Ma W. J. (2017). Practical Bayesian Optimization for Model Fitting with Bayesian Adaptive Direct Search. Advances in Neural Information Processing Systems, 1836–1846.
    1. Adler W. T., & Ma W. J. (2018). Comparing Bayesian and non-Bayesian accounts of human confidence reports. PLOS Computational Biology, 14(11), e1006572. 10.1371/journal.pcbi.1006572 - DOI - PMC - PubMed
    1. Aguilar-Lleyda D., Lemarchand M., & de Gardelle V. (2020). Confidence as a Priority Signal. Psychological Science, 31(9), 1084–1096. 10.1177/0956797620925039 - DOI - PubMed
    1. Aitchison L., Bang D., Bahrami B., & Latham P. E.(2015). Doubly Bayesian Analysis of Confidence in Perceptual Decision-Making. PLOS Computational Biology, 11(10), e1004519. 10.1371/journal.pcbi.1004519 - DOI - PMC - PubMed

Publication types

LinkOut - more resources