[Preprint]. 2024 Dec 12:rs.3.rs-5494074.
doi: 10.21203/rs.3.rs-5494074/v1.

Precision targeting of β-catenin induces tumor reprogramming and immunity in hepatocellular cancers

Affiliations

Precision targeting of β-catenin induces tumor reprogramming and immunity in hepatocellular cancers

Brandon M Lehrich et al. Res Sq. .

Update in

  • Precision targeting of β-catenin induces tumor reprogramming and immunity in hepatocellular cancers.
    Lehrich BM, Delgado ER, Yasaka TM, Liu S, Cao C, Liu Y, Taheri MN, Guan X, Koeppen H, Singh S, Meadows V, Liu JJ, Singh-Varma A, Krutsenko Y, Poddar M, Hitchens TK, Foley LM, Liang B, Rialdi A, Rai RP, Patel P, Riley M, Bell A, Raeman R, Dadali T, Luke JJ, Guccione E, Ebrahimkhani MR, Lujambio A, Chen X, Maier M, Wang Y, Broom W, Tao J, Monga SP. Lehrich BM, et al. Nat Commun. 2025 May 30;16(1):5009. doi: 10.1038/s41467-025-60457-2. Nat Commun. 2025. PMID: 40442146 Free PMC article.

Abstract

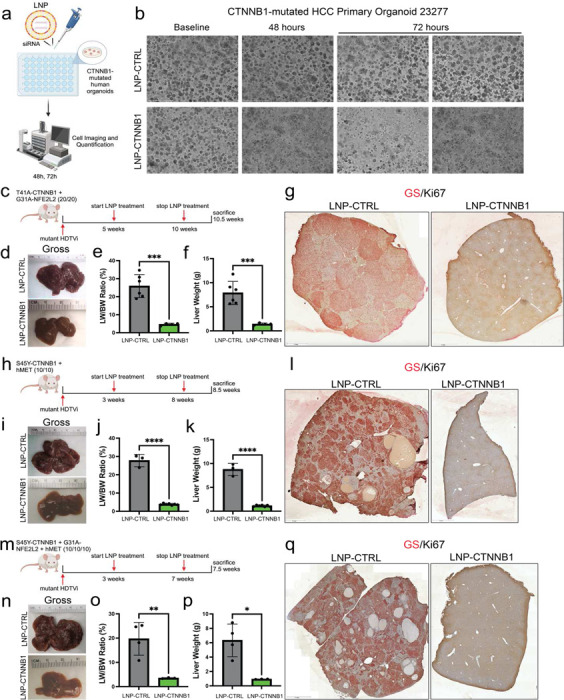
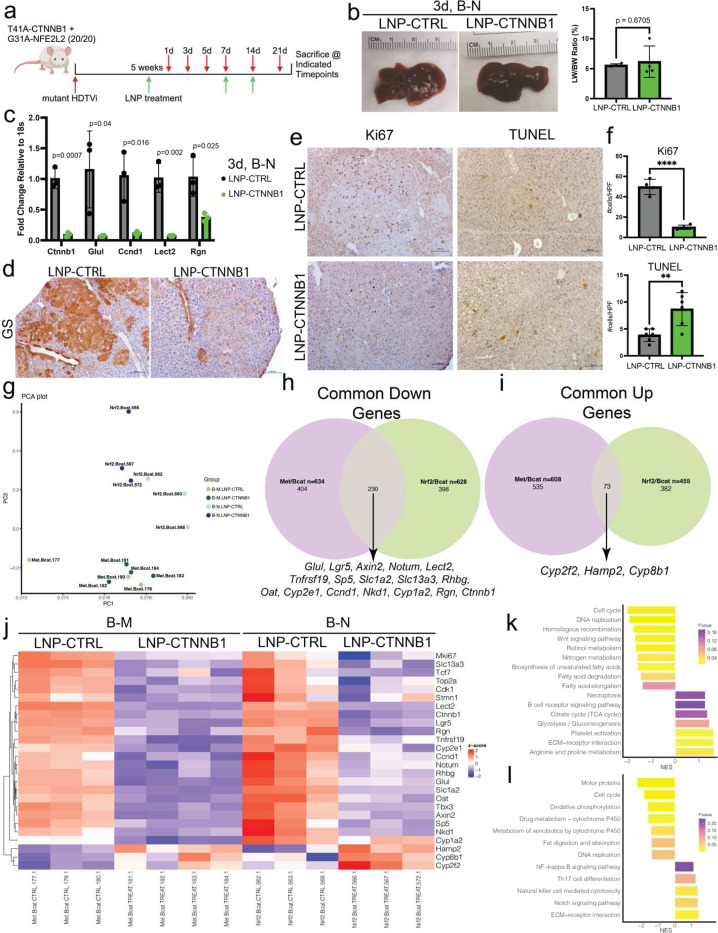
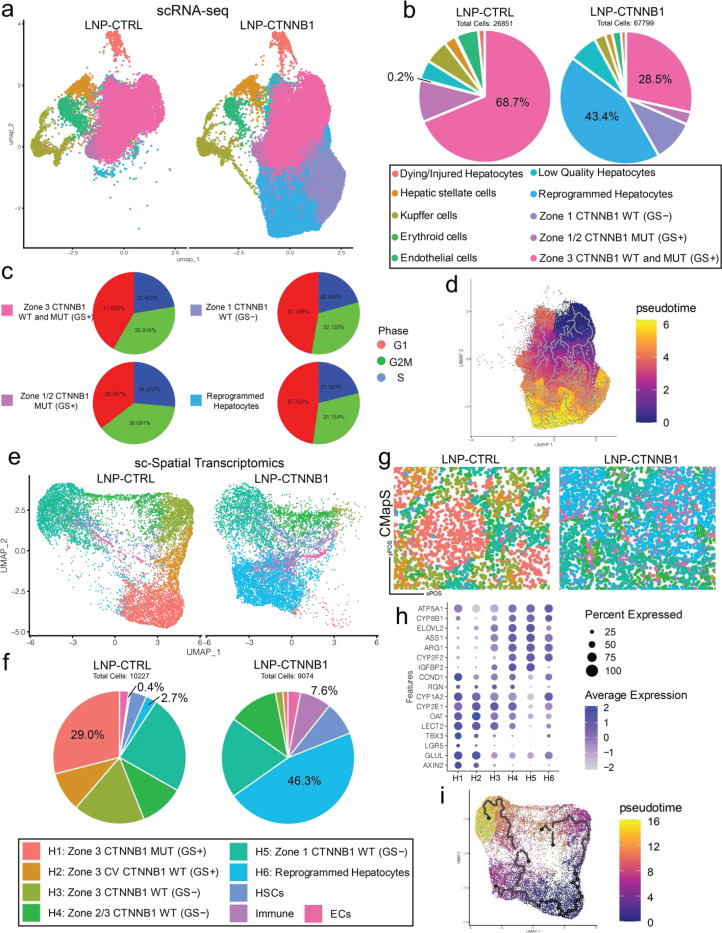
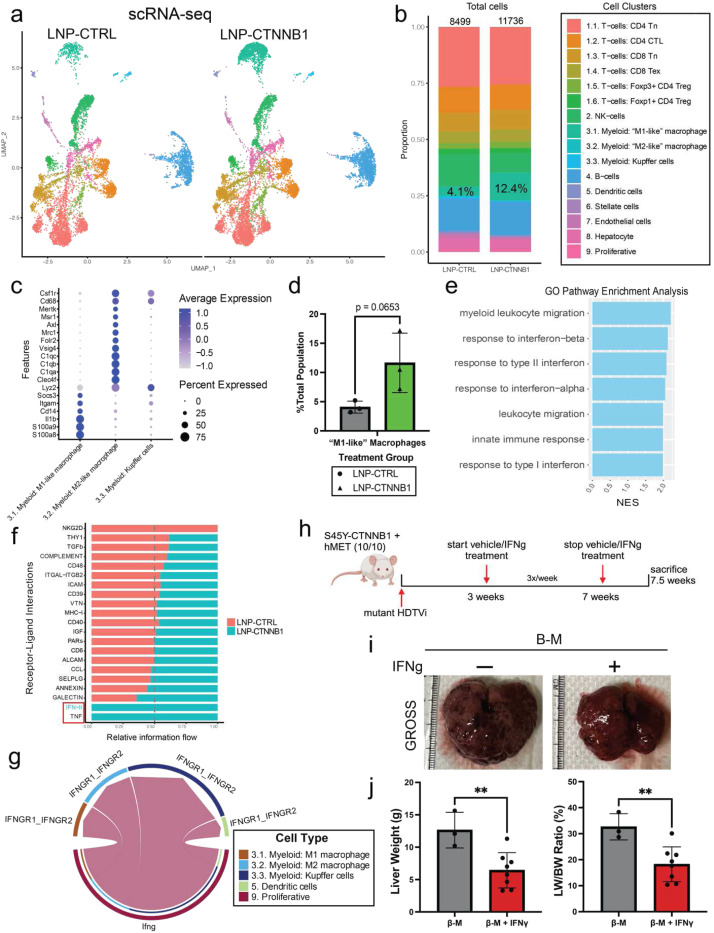
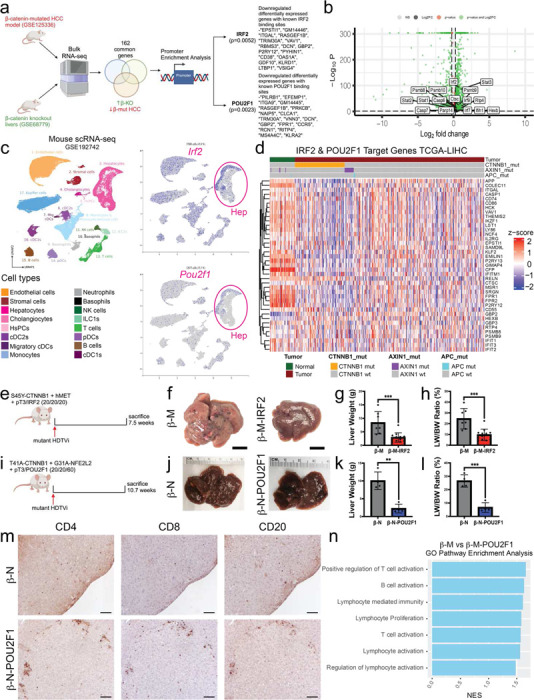
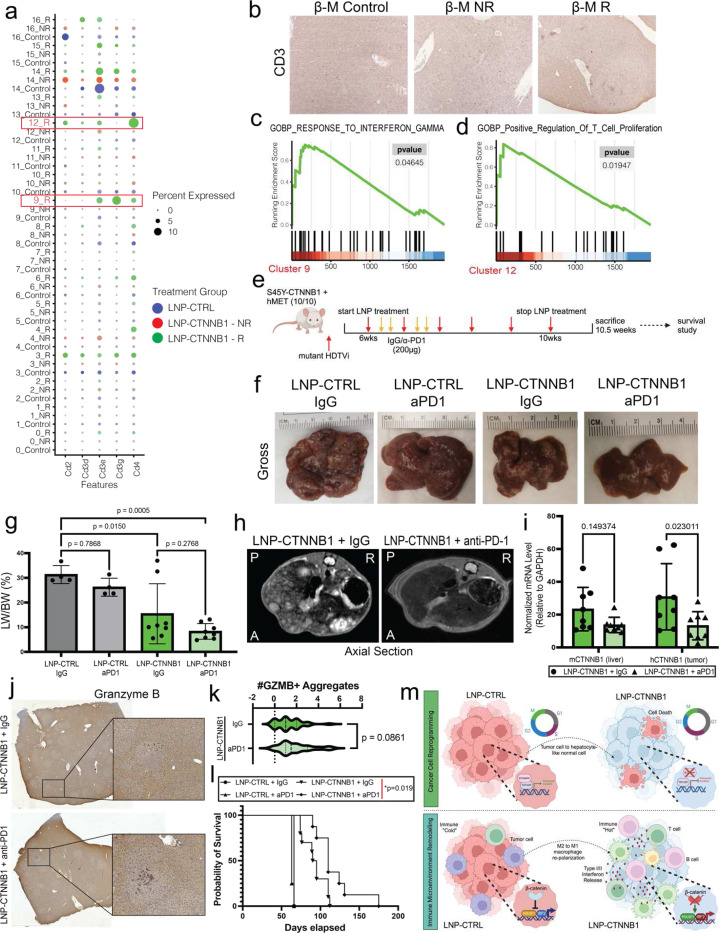
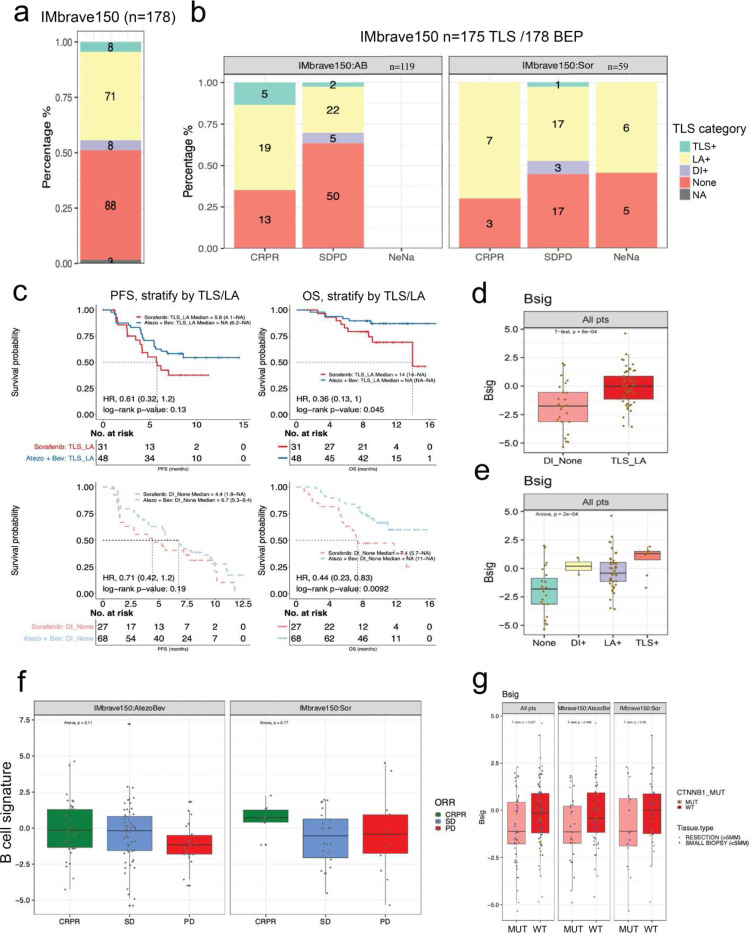
First-line immune checkpoint inhibitor (ICI) combinations show responses in subsets of hepatocellular carcinoma (HCC) patients. Nearly half of HCCs are Wnt-active with mutations in CTNNB1 (encoding for β-catenin), AXIN1/2, or APC, and demonstrate limited benefit to ICI due to an immune excluded tumor microenvironment. We show significant tumor responses in multiple β-catenin-mutated immunocompetent HCC models to a novel siRNA encapsulated in lipid nanoparticle targeting CTNNB1 (LNP-CTNNB1). Both single-cell and spatial transcriptomics revealed cellular and zonal reprogramming of CTNNB1-mutated tumors, along with activation of immune regulatory transcription factors IRF2 and POU2F1, re-engaged type I/II interferon signaling, and alterations in both innate and adaptive immune responses upon β-catenin suppression with LNP-CTNNB1. Moreover, LNP-CTNNB1 synergized with ICI in advanced-stage disease through orchestrating enhanced recruitment of cytotoxic T cell aggregates. Lastly, CTNNB1-mutated patients treated with atezolizumab plus bevacizumab combination had decreased presence of lymphoid aggregates, which were prognostic for response and survival. In conclusion, LNP-CTNNB1 is efficacious as monotherapy and in combination with ICI in CTNNB1-mutated HCCs through impacting tumor cell intrinsic signaling and remodeling global immune surveillance, providing rationale for clinical investigations.

Keywords: Wnt; hepatocellular carcinoma; immunotherapy; molecular therapy; precision medicine; single cell; spatial transcriptomics; β-catenin.


Conflict of interest statement

Dr. Satdarshan P. Monga has received research grants from Alnylam Pharmaceuticals. He also received funding from Fog Pharmaceuticals and is a consultant on Advisory Boards for Surrozen, AntlerA, Alnylam, Mermaid Bio, Vicero Inc, and UbiquiTx, and there is no pertinent conflict of interest of these entities as relevant to the current manuscript. Drs. Tulin Dadali, Martin Maier, and Wendy Broom are employed by Alnylam Pharmaceuticals, Cambridge, MA. Drs. Xiangnan Guan, Hartmut Koeppen, and Yulei Wang are employed by Genentech Inc., San Francisco, CA. No other authors have any relevant conflicts of interests to declare regarding the current study.

Figures

Figure 1.
Figure 1.. RNAi-mediated β-catenin inhibition is efficacious in multiple immunocompetent CTNNB1-mutated HCC mouse models in early-stage disease setting.
(a)Schematic diagram demonstrating CTNNB1-mutated patient-derived HCC organoid treatment with LNP-CTRL or LNP-CTNNB1. (b)Brightfield microscopy images of CTNNB1-mutated patient-derived HCC organoids treated with LNP-CTRL or LNP-CTNNB1 at baseline, 48-hours, and 72-hours. Scale bar indicates magnification. (c) LNP treatment scheme in β-catenin-Nrf2 (β-N) model. Mice received once weekly intravenous (I.V.) injections at 1mg/kg dosage starting at 5-weeks post-hydrodynamic tail vein injection (HDTVi). (d)Representative gross liver images of LNP-CTRL and LNP-CTNNB1 treated β-N animals at 10.5-week timepoint. (e) Liver weight/body weight (LW/BW) ratio comparing LNP-CTRL (n=6) and LNP-CTNNB1 (n=4) treated β-N animals at 10.5-week timepoint. ***p<0.001 calculated by two-tailed Student’s t-test. (f) Liver weights comparing LNP-CTRL (n=6) and LNP-CTNNB1 (n=4) treated β-N animals at 10.5-week timepoint. ***p<0.001 calculated by two-tailed Student’s t-test. (g)Representative tiled images of immunohistochemistry (IHC) for glutamine synthetase (GS)/Ki67 co-stain comparing LNP-CTRL and LNP-CTNNB1 treated β-N animals at 10.5-week timepoint. Red stain is GS and nuclear brown stain is Ki67. Scale bar indicates magnification. (h)LNP treatment scheme in β-catenin-hMet (β-M) model. Mice received once weekly I.V. injections at 1mg/kg dosage starting at 3-weeks post-HDTVi. (i) Representative gross liver images of LNP-CTRL and LNP-CTNNB1 treated β-M animals at 8.5-week timepoint. (j) LW/BW ratio comparing LNP-CTRL (n=3) and LNP-CTNNB1 (n=7) treated β-M animals at 8.5-week timepoint. ****p<0.0001 calculated by two-tailed Student’s t-test. (k)Liver weights comparing LNP-CTRL (n=3) and LNP-CTNNB1 (n=7) treated β-M animals at 8.5-week timepoint. ****p<0.0001 calculated by two-tailed Student’s t-test. (l) Representative tiled images of IHC for GS/Ki67 co-stain comparing LNP-CTRL and LNP-CTNNB1 treated β-M animals at 8.5-week timepoint. Scale bar indicates magnification. (m) LNP treatment scheme in β-catenin-Nrf2-hMet (β-N-M) model. Mice received once weekly I.V. injections at 1mg/kg dosage starting at 3-weeks post-HDTVi. (n)Representative gross liver images of LNP-CTRL and LNP-CTNNB1 treated β-N-M animals at 7.5-week timepoint. (o)LW/BW ratio comparing LNP-CTRL (n=4) and LNP-CTNNB1 (n=3) treated β-N-M animals at 7.5-week timepoint. **p<0.01 calculated by two-tailed Student’s t-test. (p)Liver weights comparing LNP-CTRL (n=4) and LNP-CTNNB1 (n=3) treated β-N-M animals at 7.5-week timepoint. *p<0.05 calculated by two-tailed Student’s t-test. (q)Representative tiled images of IHC for GS/Ki67 co-stain comparing LNP-CTRL and LNP-CTNNB1 treated β-N-M animals at 7.5-week timepoint. Scale bar indicates magnification.
Figure 2.
Figure 2.. Earliest biological response to RNAi-mediated β-catenin inhibition observed 3-days after LNP treatment.
(a)LNP treatment scheme in β-catenin-Nrf2 (β-N) model. Mice received 1st LNP treatment at 1mg/kg dosage at 5-weeks post-hydrodynamic tail vein injection (HDTVi) via intravenous (I.V.) injection and sacrificed at 1-day, 3-days, 5-days, and 7-days post-LNP treatment. Then, 2nd LNP treatment and sacrificed at 7-days later (14-days post 1st LNP treatment). Then, 3rd LNP treatment and sacrificed at 7-days later (21-days post 1st LNP treatment). (b)(Left) Representative gross liver images of LNP-CTRL and LNP-CTNNB1 treated β-N animals at 3-days post 1st LNP treatment. (Right) Liver weight/body weight (LW/BW) ratio comparing LNP-CTRL (n=4) and LNP-CTNNB1 (n=4) β-N treated animals 3-days post 1st LNP treatment. p=0.6705 calculated by two-tailed Student’s t-test. (c)RNA expression levels of Ctnnb1 and β-catenin target genes (Glul, Ccnd1, Lect2, Rgn) between LNP-CTRL (n=3) and LNP-CTNNB1 (n=3) β-N treated animals assessed by qPCR. *p<0.05 calculated by two-tailed Student’s t-test. Each data point is a biological replicate average of two technical replicates. (d)Representative immunohistochemistry (IHC) images for glutamine synthetase (GS) comparing LNP-CTRL and LNP-CTNNB1 treated β-N animals 3-days post 1st LNP treatment. Scale bar is 100 m. (e)(Left) Representative IHC images for Ki67 and TUNEL comparing LNP-CTRL and LNP-CTNNB1 treated animals 3-days post 1st LNP treatment. Scale bar indictaes 100 m. (f) Quantification of number of positive cells across multiple high-power fields (HPF) for Ki67 and TUNEL staining between LNP-CTRL and LNP-CTNNB1 treated β-N animals 3-days post 1st LNP treatment. **p<0.01 calculated by two-tailed Student’s t-test. ****p<0.0001 calculated by two-tailed Student’s t-test. (g)Principal component analysis of bulk RNA-sequencing transcriptomic profiles of β-N and β-catenin-hMet (β-M) model each treated with LNP-CTRL or LNP-CTNNB1 and harvested 3-days post LNP treatment, using all genes (n=3–4 per condition and model). (h)Venn diagram highlighting number of common downregulated differentially expressed genes (DEGs) (n=230) between β-N and β-M models treated with LNP-CTRL or LNP-CTNNB1 3-days post LNP treatment. DEGs defined by FDR=0.05 and fold change > 1.5. (i) Venn diagram highlighting number of common upregulated DEGs (n=73) between β-N and β-M models treated with LNP-CTRL or LNP-CTNNB1 3-days post LNP treatment. DEGs defined by FDR=0.05 and fold change > 1.5. (j) Heatmap of selected common downregulated and upregulated genes demonstrating normalized z-score expression value in each model with each LNP treatment condition from (h) and (i). (k)Gene set enrichment analysis (GSEA) of Kyoto Encyclopedia of Genes and Genomes (KEGG) pathways based on differentially expressed genes (DEGs) in β-N model comparing LNP-CTRL and LNP-CTNNB1 treated animals. Pathways results demonstrate downregulating of cell cycle and Wnt signaling pathways and upregulation of immune and metabolic pathways. NES, normalized enrichment score. (l) GSEA of KEGG pathways based on DEGs in β-M model comparing LNP-CTRL and LNP-CTNNB1 treated animals. Pathways results demonstrate downregulating of cell cycle and drug metabolism pathways and upregulation of immune pathways. NES, normalized enrichment score.
Figure 3.
Figure 3.. Integrated single-cell analyses reveal de novo formation of reprogrammed hepatocytes within remnant tumor nodules 3-days post LNP-CTNNB1 treatment.
(a)Uniform manifold approximation and projection (UMAP) visualization of single-cell RNA-sequencing data following liver perfusion and enrichment of hepatocyte cell populations from LNP-CTRL and LNP-CTNNB1 treated β-catenin-Nrf2 (β-N) animals 3-days post LNP treatment. UMAP split by treatment condition with 94,650 cells total across both treatment conditions, n=2–3 pooled replicates each condition; LNP-CTRL (n=2) has 26,851 cells in the library; LNP-CTNNB1 (n=3) has 67,799 cells in the library after data integration. Labeled cell populations indicated by color. (b)Pie-chart of cell type proportions between LNP-CTRL and LNP-CTNNB1 treatment conditions from (a). Percentages of certain cell populations are indicated. Labeled cell populations indicated by color. (c) Cell cycle regression scoring for all cell population visualized via pie charts depicting cell cycle phase proportions in each of the hepatocyte cell clusters. Each pie piece represents a group of cells colored by whether the RNA expression fits cells belonging to G1 (red), G2/M (green), or S (blue) phases of the cell cycle. (d)Pseudotime trajectory analysis on UMAP plot subset to only hepatocyte specific cell populations using the Zone 3 CTNNB1 WT and MUT (GS+) cluster as the root. (e)UMAP visualization of single-cell spatial transcriptomic data via Molecular Cartogrpahy platform taken from frozen liver tissue sections of LNP-CTRL (n=1) and LNP-CTNNB1 (n=1) treated β-N animals 3-days post treatment. UMAP generated based on expression of 100 genes. UMAP split by treatment condition with 19,301 cells total across both treatment conditions (LNP-CTRL library has n=6 regions of interest (ROIs) with 10,227 cells total; LNP-CTNNB1 library has n=5 ROIs with 9,074 cells total). Labeled cell populations indicated by color. (f) Pie-chart of cell type proportions between LNP-CTRL and LNP-CTNNB1 treatment conditions from (f). Percentages of certain cell populations are indicated. Labeled cell populations indicated by color. (g)Cluster mapping to tissue section (CMapS) for LNP-CTRL and LNP-CTNNB1 virtual slides demonstrating visualization of certain cell populations by color from (f-g) on the actual tissue slide. (h)Dot plot visualization of various zonated marker gene expression (for all zones 1–3) for each hepatocyte cluster from (f-g). (i) Pseudotime trajectory analysis on Uniform manifold approximation and projection (UMAP) plot using the H1: Zone 3 CTNNB1 MUT (GS+) cluster as the root.
Figure 4.
Figure 4.. RNAi-mediated β-catenin inhibition induces pro-inflammatory myeloid cell intra-tumoral infiltration.
(a)UMAP visualization of single-cell RNA-sequencing data following liver perfusion and enrichment of immune cell populations from LNP-CTRL and LNP-CTNNB1 treated β-N animals 3-days post LNP treatment. UMAP split by treatment condition with 20,235 cells total across both treatment conditions, n=3 biological replicates integrated for each condition; LNP-CTRL has 8,499 cells across n=3 replicates in the library; LNP-CTNNB1 has 11,736 cells across n=3 replicates in the library after data integration. Labeled cell populations indicated by color. (b)Stacked bar plot of cell type proportions between LNP-CTRL and LNP-CTNNB1 treatment conditions from (c). Labeled cell populations indicated by color. (c) Dot plot visualization of expression of canonical M1- and M2-macrophage phenotype markers in each of the different annotated cell populations. (d)Bar plot comparing average value of percent of total population of the M1-macrophage cell population between LNP-CTRL and LNP-CTNNB1 treatment. p=0.0653 calculated by two-tailed Student’s t-test. (e)Gene set enrichment analysis (GSEA) of Gene Ontology pathways based on genes differentially expressed in M1-macrophage population comparing LNP-CTRL and LNP-CTNNB1 treated animals. Pathways results demonstrate enrichment of pathways involved in interferon signaling response and innate immunity. NES, normalized enrichment score. (f) Stacked horizontal bar plot comparing relative information flow from CellChat between LNP-CTRL and LNP-CTNNB1 treated animals. Boxed pathways showing 100% information flow in LNP-CTNNB1 animals. IFN-II signaling highlighted in blue showing 100% enriched in LNP-CTNNB1 animals. (g)Cord diagram for IFN-II pathway in LNP-CTNNB1 treated animals demonstrating information flow from proliferative T cells to macrophage populations. No information flow in LNP-CTRL treated animals. (h)IFNβ treatment scheme in β-catenin-hMet (β-M) model. Mice received multi-weekly intra-peritoneal (I.P.) injections of IFNβ at 1×10⁶ IU/ml dosage or vehicle control starting at 3-weeks post-HDTVi. Mice were sacrificed at 7.5-weeks post-HDTVi. (i) Representative gross liver images of vehicle control and IFNβ treated β-M animals at 7.5-weeks post-HDTVi. (j) (Left) Liver weights comparing β-M animals treated with either vehicle control (n=3) and IFNβ (n=8) at 7.5-week timepoint. **p<0.01 calculated by two-tailed Student’s t-test. (Right) Liver weight/body weight (LW/BW) ratio comparing β-M animals treated with either vehicle control (n=3) and IFNβ (n=8) at 7.5-week timepoint. **p<0.01 calculated by two-tailed Student’s t-test.
Figure 5.
Figure 5.. IRF2 and POU2F1 repression by mutated-β-catenin is a major tumor cell intrinsic mechanism of immune exclusion in CTNNB1-mutated HCC.
(a)Schematic highlighting bioinformatic pipeline to compare whole transcriptome of β-catenin-mutated HCC (GSE125336) to β-catenin knockout livers (GSE68779) and focusing on 162 common genes downregulated in β-catenin-mutated HCC with absolute log fold change >2.0 and FDR=5%. Promoter enrichment analysis using JASPAR was performed on the downregulated genes with multiple transcription factors identified, including Irf2 (p=0.0052) and Pou2f1 (p=0.0023). (b)Volcano plot highlighting selected differentially expressed genes within the Zone 3 CTNNB1 WT and MUT (GS+) cell population comparing LNP-CTRL and LNP-CTNNB1 treatment from Figure 3a. Marker genes include Irf2 and Pou2f1 downstream target genes. (c) (Left) UMAP visualization of single-cell RNA-sequencing (scRNA-seq) data from GSE192742 (https://www.livercellatlas.org/index.php) of all mouse liver cells annotated by cell type. (Right) Irf2 and Pou2f1 expression by cell type on UMAP from (b) demonstrating hepatocytes express Irf2 and Pou2f1 in mouse liver. (d)Heatmap visualization of normalized expression of IRF2 and POU2F1 target genes in TCGA-LIHC patients (n=374; red) and adjacent normal (n=50; green). Data is stratified by CTNNB1-mutated patients (n=98; yellow), AXN1-mutated patients (n=18; purple), and APC-mutated patients (n=3; light blue). (e) β-catenin-hMet (β-M) animals were co-injected with either pT3 (empty vector) or IRF2 plasmid at time of hydrodynamic tail vein injection (HDTVi) and sacrificed at 7.5-weeks post-HDTVi. (f) Representative gross liver images of β-M animals co-injected with either pT3 (empty vector) or IRF2. Scale bar indicates 1 centimeter (cm). (g)Liver weights comparing β-M-pT3 (n=7) and β-M-IRF2 (n=12) animals at 7.5-week timepoint. ***p<0.001 calculated by two-tailed Student’s t-test. (h)Liver weight/body weight (LW/BW) ratio comparing β-M-pT3 (n=7) and β-M-IRF2 (n=12) animals at 7.5-week timepoint. ***p<0.001 calculated by two-tailed Student’s t-test. (i) β-catenin-Nrf2 (β-N) animals were co-injected with either pT3 (empty vector) or POU2F1 plasmid at time of hydrodynamic tail vein injection (HDTVi) and sacrificed at 10.7-weeks post-HDTVi. (j) Representative gross liver images of β-N animals co-injected with either pT3 (empty vector) or POU2F1. Scale bar indicates 1 centimeter (cm). (k)Liver weights comparing β-N-pT3 (n=4) and β-N-POU2F1 (n=4) animals at 10.7-week timepoint. **p<0.01 calculated by two-tailed Student’s t-test. (l) Liver weight/body weight (LW/BW) ratio comparing β-N-pT3 (n=4) and β-N-POU2F1 (n=4) animals at 10.7-week timepoint. ***p<0.001 calculated by two-tailed Student’s t-test. (m) Representative IHC images for CD4, CD8, and CD20 immune markers comparing β-N-pT3 and β-N-POU2F1 animals at 10.7-week timepoint. (n)Gene set enrichment analysis (GSEA) of Gene Ontology pathways based on genes differentially expressed in β-N-POU2F1 compared to β-N-pT3 animals. NES, normalized enrichment score.
Figure 6.
Figure 6.. Response to RNAi-mediated β-catenin inhibition in CTNNB1-mutated mouse models in advanced stage disease setting is associated with overall T cell infiltration and activation.
(a)LNP treatment scheme in β-catenin-Nrf2 (β-N) model for advanced-stage disease. Mice received once weekly intravenous (I.V.) injections at 1mg/kg dosage starting at 8-weeks post-hydrodynamic tail vein injection (HDTVi). (b)Representative gross liver images of LNP-CTNNB1 treated β-N animals at 13.5-week timepoint demonstrating non-responders (NR) and responders (R) compared to LNP-CTRL β-N animals when moribund at ~10.5-weeks. (c) Liver weight/body weight (LW/BW) ratio comparing LNP-CTRL (n=6) and LNP-CTNNB1 (n=8) treated β-N animals at 10.5-week and 13.5-week timepoint, respectively. ***p<0.001 calculated by two-tailed Student’s t-test. (d)LNP treatment scheme in β-catenin-hMet (β-M) model for advanced-stage disease. Mice received once weekly intravenous (I.V.) injections at 1mg/kg dosage starting at 6-weeks post-hydrodynamic tail vein injection (HDTVi). (e)Representative gross liver images of LNP-CTNNB1 treated β-M animals at 10.5-week timepoint demonstrating non-responders (NR) and responders (R) compared to LNP-CTRL β-M animals when moribund at ~8.5-weeks. (f) LW/BW ratio comparing LNP-CTRL (n=4) and LNP-CTNNB1 (n=8) treated β-M animals at 8.5-week and 10.5-week timepoint, respectively. *p<0.05 calculated by two-tailed Student’s t-test. (g)Uniform manifold approximation and projection (UMAP) visualization of gene expression profiles from 10X Visium spatial transcriptomics on the β-M model. Data integration was performed on 17,685 spots across 4 slides with 4,461 spots in β-M Control, 4,331 in β-M NR-1, 4,842 in β-M NR-2, and 4,051 in β-M R-1. Each color indicates one of the different 17 clusters. (h)Stacked bar chart of cluster proportions for each of the 4 slides from (g). Cluster number by color is indicated next to the graph. Each color indicates one of the different 17 clusters. (i) H&E slide from which the 10X Visium spatial transcriptomics was performed on for each of the 4 different conditions in the β-M model: β-M Control, β-M NR-1, β-M NR-2, and β-M R-1. (j) Cluster mapping to tissue section (CMapS) for each slide showing the cluster location on the H&E tissue section. (k)Dot plot showing expression by cluster for various T cell marker genes: Cd2, Cd3d, Cd3e, Cd3g, and Cd4 and B cell marker genes: Cd79a, Cd19, Ms4a1, Mzb1, and Iglc2 for the 10X Visium spatial transcriptomics data on the β-M model.
Figure 7.
Figure 7.. RNAi-mediated β-catenin inhibition synergizes with immunotherapy in β-M CTNNB1-mutated mouse model in advanced disease setting.
(a)Dot plot T cell marker genes (Cd2, Cd3d, CD3e, Cd3g, Cd4) to visualize expression by cluster and by response (control [blue]; non-responder [NR; red], responder [R; green]) from the 10X Visium spatial transcriptomics data in figure 6d. (b)(Left) Representative immunohistochemistry (IHC) images from β-catenin-hMet (β-M) treated animals with LNP-CTRL or LNP-CTNNB1 (categorized by NR or R) at 10.5-week timepoint stained for CD3. 5X objective magnification for the images. (Right) Bar plot of quantification across multiple high-power fields (HPF) for CD3 in the tumor microenvironment for each of the different conditions. (c)Gene ontology (GO) gene set enrichment analysis (GSEA) running score plot for response to GOBP_Response_To_Interferon_Gamma in cluster comparing β-M Control (LNP-CTRL) to β-M R (LNP-CTNNB1; responder). (d)GO GSEA running score plot for GOBP_Positive_Regulation_Of_T_Cell_Proliferation in cluster 12 comparing LNP-CTRL to LNP-CTNNB1 R β-M animals. (e)LNP + IgG/β-PD1 treatment scheme in β-M model. Mice received weekly LNP injections at 1mg/kg dosage starting at 6-weeks post-hydrodynamic tail vein injection (HDTVi) with twice weekly injections of IgG/β-PD1 (200 g) for two weeks starting at 6-weeks post-HDTVi (3-days after LNP treatment). LNP-CTNNB1 treated mice were sacrificed at 10.5-weeks post-HDTVi or extended for survival analysis. (f) Representative gross liver images of LNP-CTNNB1 IgG/β-PD1 treated β-M animals at 10.5-week timepoint compared to LNP-CTRL IgG/β-PD1 when moribund. (g)Liver weight/body weight (LW/BW) ratio data comparing LNP-CTNNB1 IgG/β-PD1 (n=8/n=8) β-M treated animals at 10.5-week timepoint to LNP-CTRL IgG/β-PD1 (n=4/n=4) β-M treated animals when moribund. P-values calculated by one-way ANOVA with Tukey-HSD post-hoc comparison. (h)(Left) Magnetic resonance images (MRI) of LNP-CTNNB1 IgG/β-PD1 β-M treated animals at 10.5-week timepoint. (Right) Quantification represents area of 3-dimensional tumor volumes (defined by hyperintense foci) outlined comparing LNP-CTNNB1 IgG/β-PD1 β-M treated animals. (i) RNA expression levels of mCTNB1 and hCTNNB1 in LNP-CTNNB1 IgG/β-PD1 β-M treated animals (n=8 each group) assessed by qPCR. *p<0.05 calculated by two-tailed Student’s t-test. Each data point is a biological replicate average of two technical replicates. (j) Representative tiled immunohistochemistry (IHC) images from LNP-CTNNB1 IgG/β-PD1 β-M treated animals at 10.5-week timepoint stained for granzyme B (GZMB) to identify lymphoid aggregates with cytotoxic activity. Scale bar indicates magnification. (k)Violin plot for quantification of number of GZMB+ lymphoid aggregates in tumoral and peritumoral areas correlated with H&E lymphoid aggregate presence from LNP-CTNNB1 IgG/β-PD1 β-M treated animals at 10.5-week timepoint. P-value calculated by two-tailed Student’s t-test. (l) Kaplan-Meier survival curve of overall survival comparing β-M treated animals receiving LNP-CTRL IgG/β-PD1 (n=3/n=4) and LNP-CTNNB1 IgG/β-PD1 (n=10/n=8). Log-rank test was used to compare differences in mean overall survival time. *p=0.0188 comparing LNP-CTNNB1 + IgG to LNP-CTNNB1 + β-PD1. (m) Schematic diagram proposing two-part (i.e., cancer cell reprogramming and tumor immune microenvironment remodeling) working model for LNP-CTNNB1 treatment response mechanisms in β-catenin-mutated HCC preclinical models.
Figure 8:
Figure 8:. Lymphoid aggregates are prognostic in hepatocellular carcinoma and negatively correlated with CTNNB1 mutation.
(a)Stacked bar graph depicting number of patients in IMbrave150 phase III trial having either TLS, LA, DI, None or NA from the total population of 178 patients. Ultimately, 175 HCC cases were in the biomarker evaluable cohort. (b)Stacked bar graph depicting number of patients in IMbrave150 phase III trial having either TLS, LA, DI, None or NA in each of the two treatment arms: atezolizumab + bevacizumab (n=119) versus sorafenib (n=59). (c) (Top Left) Kaplan-Meier survival curve for progression-free survival (PFS) comparing patients with TLS/LA in atezolizumab + bevacizumab versus sorafenib arms, demonstrating that TLS/LA presence trends towards improved PFS in atezolizumab + bevacizumab arm. (Bottom Left) Kaplan-Meier survival curve for PFS comparing patients with DI/None in atezolizumab + bevacizumab versus sorafenib arms, demonstrating DI/None is not prognostic. (Top Right) Kaplan-Meier survival curve for overall survival (OS) comparing patients with TLS/LA in atezolizumab + bevacizumab versus sorafenib arms, demonstrating that TLS/LA presence results in significantly improved OS in atezolizumab + bevacizumab arm. (Bottom Right) Kaplan-Meier survival curve for OS comparing patients with DI/None in atezolizumab + bevacizumab versus sorafenib arms, demonstrating that any immune cell presence results in significantly improved OS with atezolizumab + bevacizumab compared to sorafenib. Log-rank test was used to compare differences in survival outcomes. (d)Composite average expression of previously reported B cell signature5 stratified by whether patients in IMbrave150 phase III trial had TLS/LA or DI/None. Student t-test demonstrated significant increase of B cell signature in patients with TLS/LA compared to patients with DI/None (p<0.001). (e)Composite average expression of previously reported B cell signature stratified by whether patients in IMbrave150 phase III trial had TLS, LA, DI, or None. One-way ANOVA demonstrated significant increase of B cell signature in patients with TLS/LA compared to patients with DI/None (p<0.001). (f) Bar plot depicting B cell signature stratified by mRECIST response criteria (complete/partial [CR/PR]), stable disease (SD), and progressive disease (PD) in each of the treatment arms from IMbrave150 phase III trial. Increased B cell signature expression score was observed in both treatment arms, but more pronounced in atezolizumab + bevacizumab arm. (g)Bar plot depicting B cell signature stratified by CTNNB1 mutational status in all patients and within each of the two treatment arms from IMbrave150 phase III trial. Student t-test demonstrated significant increase of B cell signature in patients without CTNNB1 mutation compared to those with CTNNB1 mutation (p=0.027).

References

    1. Sung H, Ferlay J, Siegel RL, et al. Global Cancer Statistics 2020: GLOBOCAN Estimates of Incidence and Mortality Worldwide for 36 Cancers in 185 Countries. CA Cancer J Clin. 2021;71(3):209–249. - PubMed
    1. Cheng AL, Qin S, Ikeda M, et al. Updated efficacy and safety data from IMbrave150: Atezolizumab plus bevacizumab vs. sorafenib for unresectable hepatocellular carcinoma. J Hepatol. 2022;76(4):862–873. - PubMed
    1. Sangro B, Chan SL, Kelley RK, et al. Four-year overall survival update from the phase III HIMALAYA study of tremelimumab plus durvalumab in unresectable hepatocellular carcinoma. Ann Oncol. 2024. - PubMed
    1. Rimassa L, Finn RS, Sangro B. Combination immunotherapy for hepatocellular carcinoma. J Hepatol. 2023;79(2):506–515. - PubMed
    1. Sangro B, Sarobe P, Hervas-Stubbs S, Melero I. Advances in immunotherapy for hepatocellular carcinoma. Nat Rev Gastroenterol Hepatol. 2021;18(8):525–543. - PMC - PubMed

Publication types

LinkOut - more resources