[Preprint]. 2024 Dec 9:rs.3.rs-5522559.
doi: 10.21203/rs.3.rs-5522559/v1.

Processed Dietary Fiber Partially Hydrolyzed Guar Gum Increases Susceptibility to Colitis and Colon Tumorigenesis in Mice

Affiliations

Processed Dietary Fiber Partially Hydrolyzed Guar Gum Increases Susceptibility to Colitis and Colon Tumorigenesis in Mice

Sangshan Tian et al. Res Sq. .

Update in

Abstract

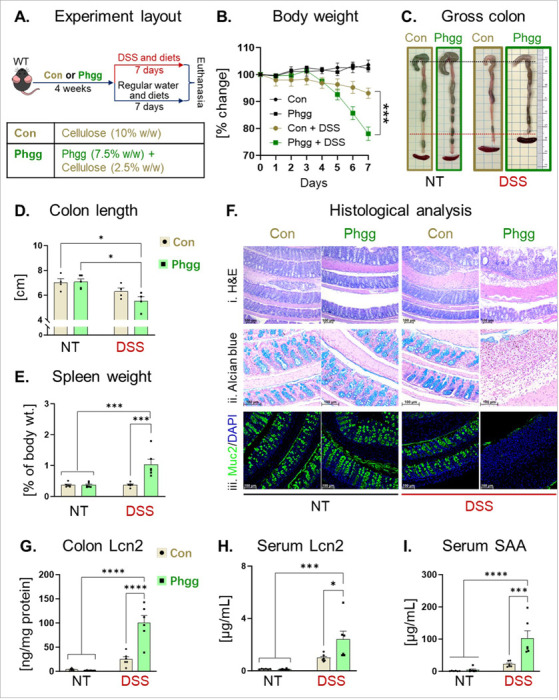
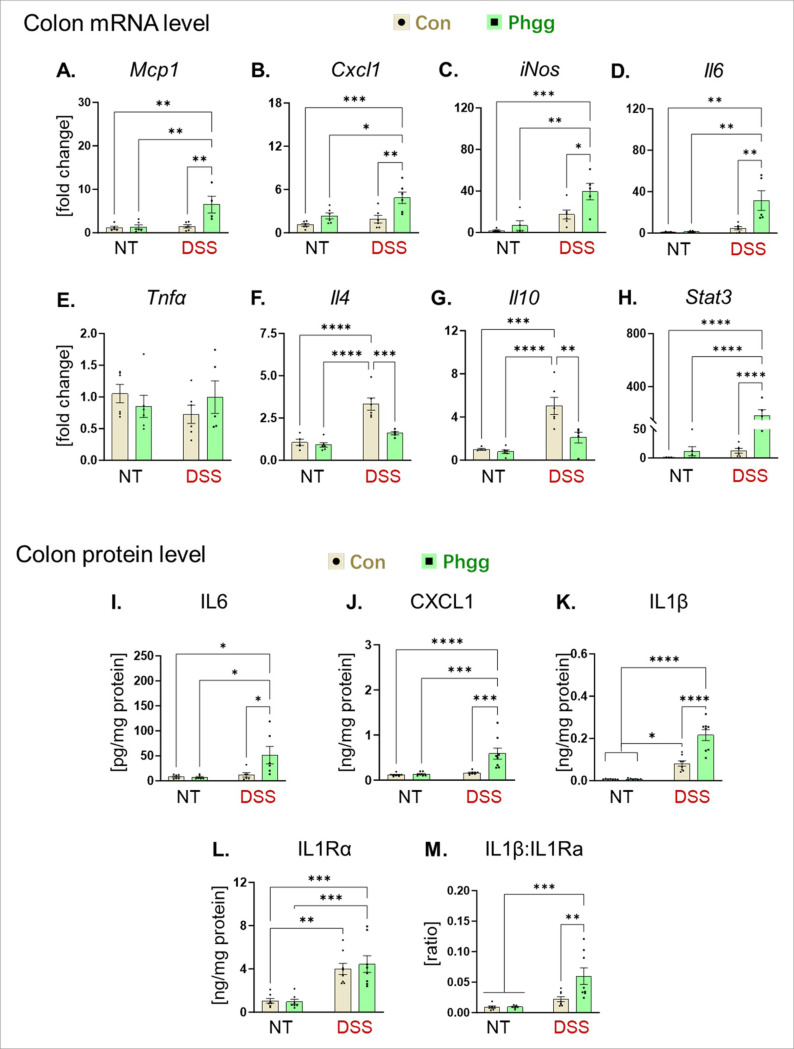
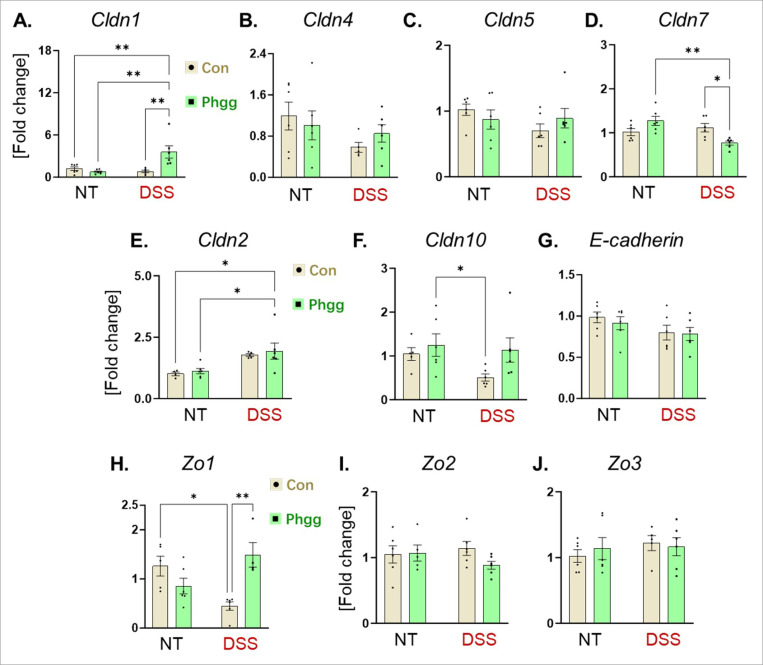
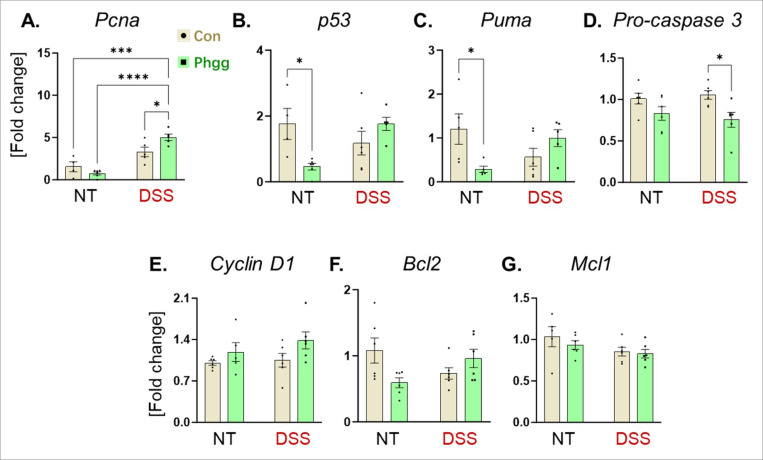
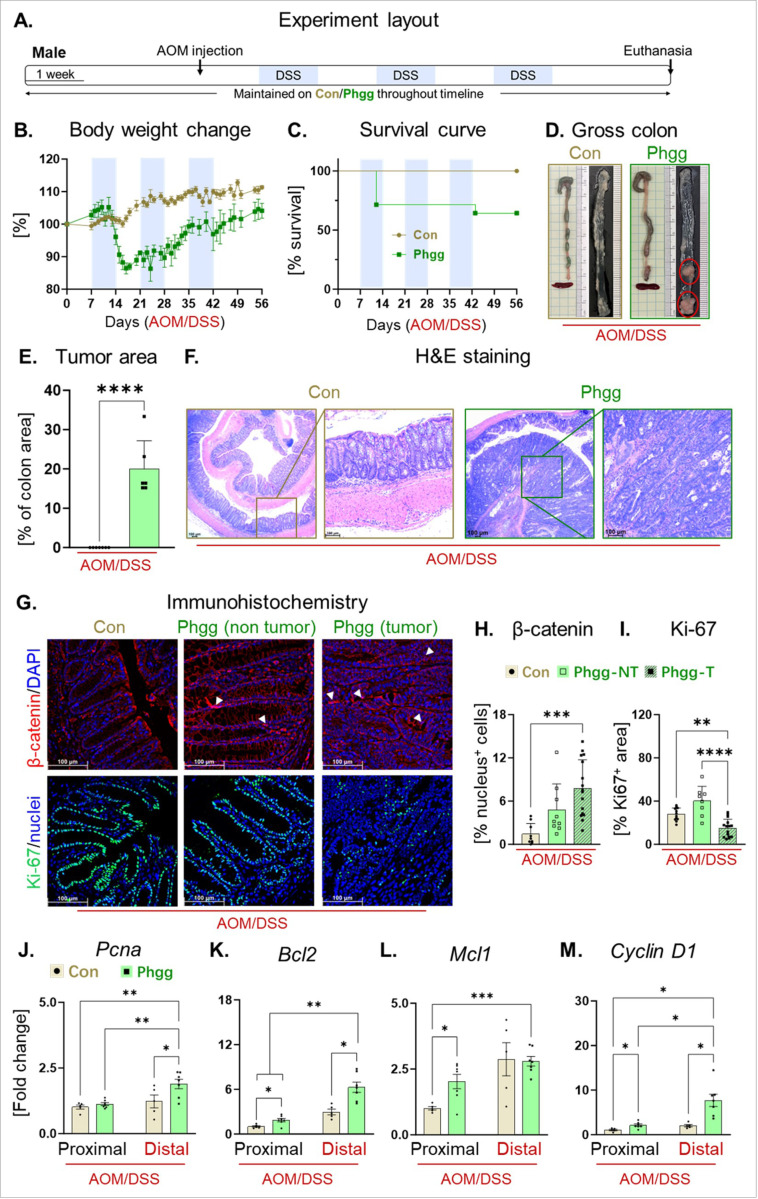
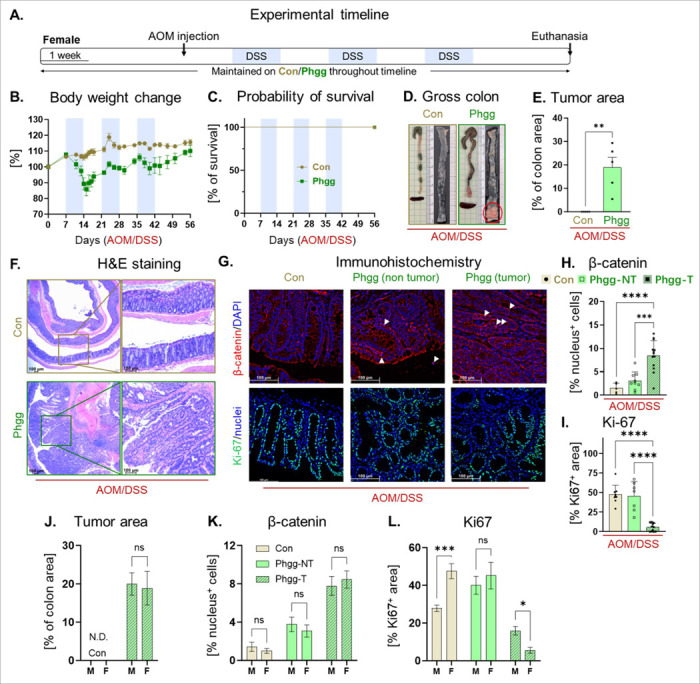
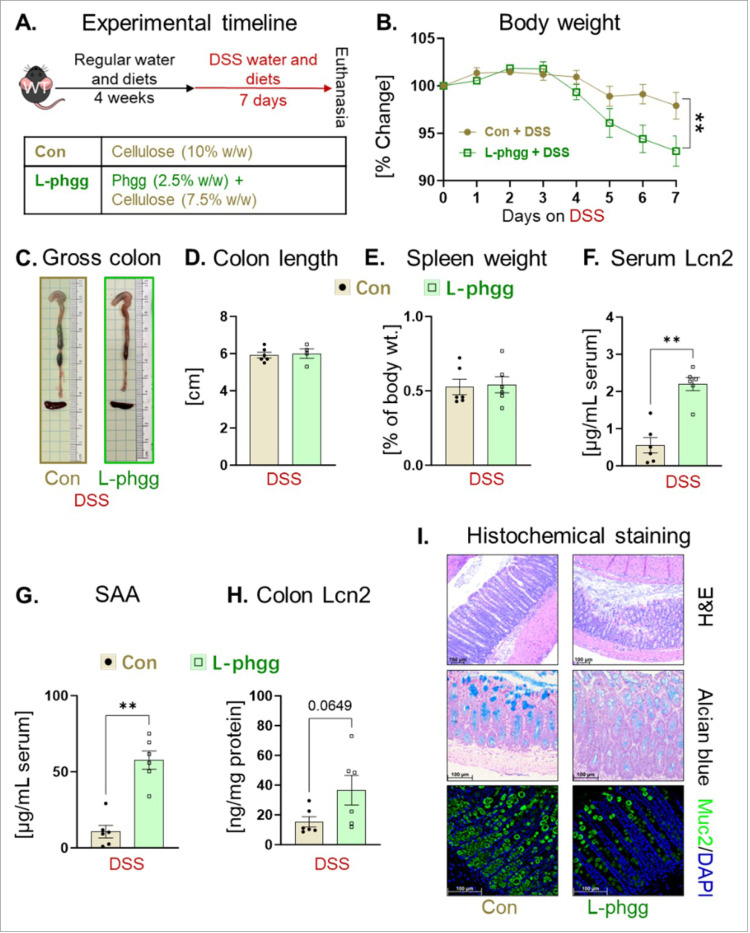
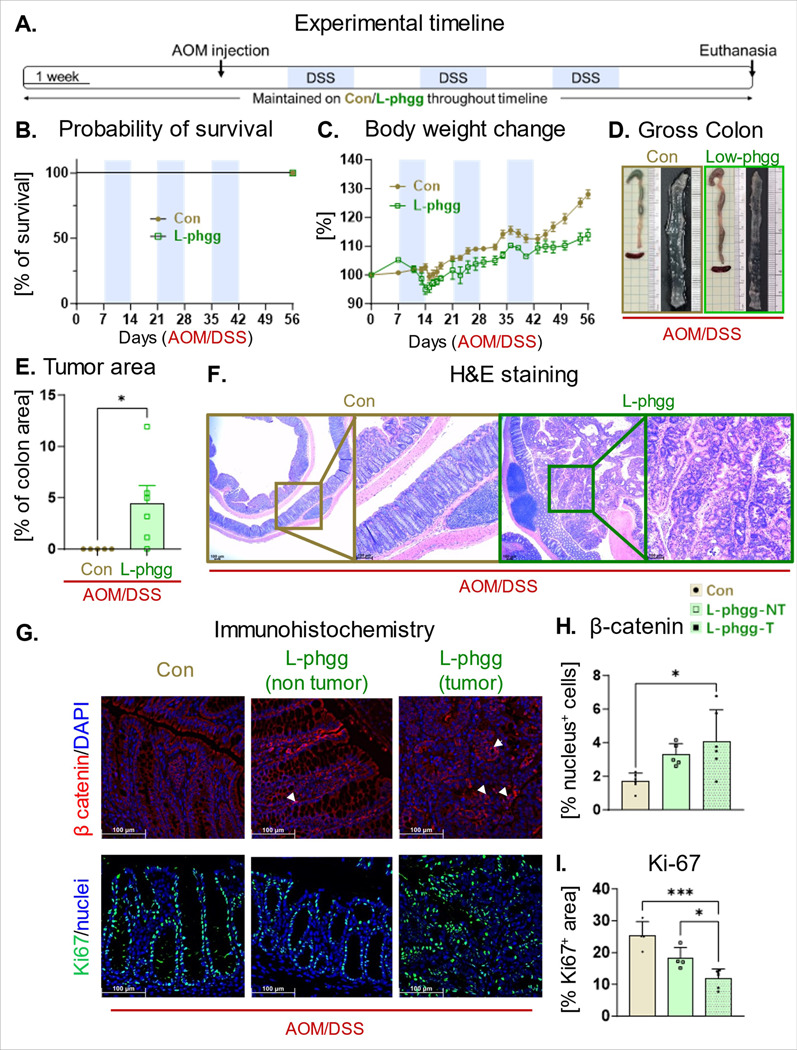
The vital role of naturally occurring dietary fibers (DFs) in maintaining intestinal health has fueled the incorporation of isolated DFs into processed foods. A select group of soluble DFs, such as partially hydrolyzed guar gum (Phgg), are being promoted as dietary supplements to meet recommended DF intake. However, the potential effects of regular consumption of these processed DFs on gastrointestinal health remain largely unknown. The present study assessed the impact of Phgg on the development of intestinal inflammation and colitis-associated colon carcinogenesis (CAC). Wild-type C57BL/6 mice were fed isocaloric diets containing either 7.5% Phgg and 2.5% cellulose (Phgg group) or 10% cellulose (control) for four weeks. To induce colitis, a subgroup of mice from each group was switched to 1.4% dextran sulfate sodium (DSS) in drinking water for seven days. CAC was induced in another subgroup through a single dose of azoxymethane (AOM, 7.5 mg/kg i.p.) followed by three DSS/water cycles. To our surprise, Phgg feeding exacerbated DSS-induced colitis, as evidenced by body weight loss, disrupted colonic crypt architecture, and increased pro-inflammatory markers accompanied by a decrease in anti-inflammatory markers. Additionally, Phgg feeding led to increased colonic expression of genes promoting cell proliferation. Accordingly, extensive colon tumorigenesis was observed in Phgg-fed mice in the AOM/DSS model, whereas the control group exhibited no visible tumors. To investigate whether reducing Phgg has a distinct effect on colitis and CAC development, mice were fed a low-Phgg diet (2.5% Phgg). The low-Phgg group also exhibited increased colitis and tumorigenesis compared to the control, although the severity was markedly lower than in the regular Phgg (7.5%) group, suggesting a dose-dependent effect of Phgg in colitis and CAC development. Our study reveals that Phgg supplementation exacerbates colitis and promotes colon tumorigenesis, warranting further investigation into the potential gastrointestinal health risks associated with processed Phgg consumption.

Keywords: Colorectal cancer; Fermentable dietary fiber; Inflammatory bowel disease; Intestinal inflammation; Oncogenes.


Conflict of interest statement

Declarations Competing interests All authors declare no financial or non-financial competing interests. Additional Declarations: No competing interests reported.

Figures

Figure 1
Figure 1. Phgg exacerbates DSS-induced colitis.
A. Experimental layout. B. Percent change in body weight (b. wt.) during the DSS intervention period. C. Representative gross colon images. D. Colon length. E. Spleen weight (as a percent of the b. wt. on euthanasia day). F. Representative images of (i) H&E-stained, (ii) alcian blue-stained colon sections (original magnification, x100), and (iii) immunohistochemical staining for mucin 2 (Muc2; green), with DAPI (blue) to visualize the nucleus (original magnification, x200). G. Colon Lcn2. Serum levels of H. Lcn2 and I. SAA. Values are presented as mean ±SEM (B, D-E, and G-I). *p < 0.05, **p < 0.01, ***p < 0.001, ****p < 0.0001.
Figure 2
Figure 2. Phgg-fed group displays increased pro- and reduced anti-inflammatory markers upon DSS intervention
The colonic tissue was obtained from no treatment (NT) and DSS intervention (DSS) groups and analyzed for mRNA expression (via qPCR) and protein level (via ELISA). A. Monocyte chemoattractant protein 1(Mcp1), B. CXC motif chemokine ligand 1 (Cxcl1), C. Inducible nitric oxide synthase (iNos), D. Interleukin 6 (Il6), E. Tumor necrosis factor alpha (Tnfα), F. Il4, and G. Il 10. H. Signal transducer and activator of transcription 3 (Stat3). (I-M) Protein level was estimated via ELISA and normalized by total colon protein concentration. I. IL6, J. CXCL1, K. IL1β, L. IL1 receptor antagonist (IL1Ra), and M. IL1β to IL1Ra ratio. Values are presented as mean ±SEM. *p < 0.05, **p < 0.01, ***p < 0.001, ****p < 0.0001.
Figure 3
Figure 3. Phgg-fed mice exhibit differential gene expression of tight junction proteins in colon
The expression of tight junction proteins was estimated at mRNA level via (qPCR) in colon tissues. A. Claudin 1 (Cldn1), B. Cldn4, C. Cldn5, D. Cldn7, E. Cldn2, and F. Cldn10. G. E-cadherin. H. Zonula occludes 1 (Zo1), I. Zo2, and J. Zo3. Values are presented as mean ±SEM. *p < 0.05, and **p < 0.01.
Figure 4
Figure 4. Phgg feeding alters colonic expression of genes related to proliferation and apoptosis
Colonic mRNA levels of A. Proliferating cell nuclear antigen (Pcna), B. Gene encoding protein p53, C. p53 upregulated modulator of apoptosis (Puma), D. Pro-caspase 3, E. Cyclin D1, F. B-cell lymphoma 2 (Bcl2), and G. Myeloid cell leukemia 1 (Mcl1). Values are presented as mean ±SEM. *p < 0.05, ***p < 0.001, and ****p < 0.0001.
Figure 5
Figure 5. Phgg exacerbated colitis-associated colorectal cancer in AOM/DSS male mice.
A. Experimental timeline, mice were maintained on either Phgg-contained or the control diet. Azoxymethane was administrated (AOM, 7.5 mg/kg body weight, i.p.) 1 week before three 7-day cycles of DSS/regular water (1%, 0.75%, 0.75% of DSS in drinking water), then sacrificed after one more week of regular water. B. Changes in body weight referred to the weight on AOM injection day. C. Probability of survival. D. Representative pictures of gross colons. E. Tumor area as percentage of colon area. F. Representative H&E-stained colon sections (original magnification, x100). G. Representative images of β-catenin (red) and Ki67 (green) immunohistochemical staining. DAPI was used to visualize nucleus [blue, (original magnification, x200)]. Quantitative evaluation of H. β-catenin (nuclear localization) and I. Ki-67 positive cells normalized per unit area. (J-M) Colonic mRNA levels of J. Pcna, K. Bcl2, L. Mcl1, and M. Cyclin D1. Values are presented as mean ±SEM. *p< 0.05, **p < 0.01, ***p < 0.001, and ****p < 0.0001.
Figure 6
Figure 6. Phgg-fed female mice exhibited colon tumorigenesis comparable to that of male mice
A. Experimental timeline. B. Change of body weight referred to the weight on AOM injection day. C. Probability of survival. D. Representative images of gross colon. E. Tumor area in percentage of the total colon surface area. F. Representative images on H&E staining (original magnification, x100). G. Representative images of β-catenin (red) and Ki67 (green) immunohistochemical staining counterstained with DAPI (blue; original magnification, x200). Quantitative evaluation of H. β-catenin (nuclear localization) and I. Ki-67 positive cells normalized per unit area. (J-L)Comparative analysis of colon tumor area, β-catenin-positive nuclei, and Ki67 levels between male and female cohort. J. % tumor area. K. β-catenin (nuclear localization). L. Ki-67 positive cells. Values are presented as mean ±SEM. *p< 0.05, **p < 0.01, ***p < 0.001, and ****p < 0.0001.
Figure 7
Figure 7. Diet with lower Phgg (L-Phgg) also exhibited augmented colitis.
A. Experimental timeline: Four-week-old WT mice were maintained on either a control (Con) or Low-Phgg diet for 4 weeks. Afterwards, both groups received 1.4% (w/v) DSS in their drinking water for 7 days. B. Percent change in body weight. C. Gross colon appearance. D. Colon length. E. Spleen weight as percent of body weight. Serum levels of F. SAA and G. Lcn2. H. Colonic level Lcn2. I. Representative images of H&E, Alcian blue (original magnification, x100), and Muc2 (green, original magnification, x200) staining. Values are presented as mean ±SEM. *p< 0.05, **p < 0.01, ***p < 0.001, and ****p < 0.0001.
Figure 8
Figure 8. Diet containing low amount of Phgg also promoted colon tumorigenesis.
A. Experimental timeline. B. Probability of survival. C. Percent change in body weight. D. Representative gross colon images. E. Tumor occupied area as a percentage of total colon area. F. Representative images of H&E-stained colon sections (original magnification, x100). G. Representative images displaying immunohistochemical staining for β-catenin (red, upper panel) and Ki67 (green) DAPI was used to visualize nucleus [blue, (original magnification, x200)]. Quantitative evaluation of H. β-catenin (nuclear localization) and I. Ki-67 positive cells normalized per unit area Values are presented as mean ±SEM. *p< 0.05, and ***p < 0.001.

Similar articles

References

    1. Sung H. et al. Global cancer statistics 2020: GLOBOCAN estimates of incidence and mortality worldwide for 36 cancers in 185 countries. CA: a cancer journal for clinicians 71, 209–249 (2021). - PubMed
    1. Bray F. et al. Global cancer statistics 2022: GLOBOCAN estimates of incidence and mortality worldwide for 36 cancers in 185 countries. CA: a cancer journal for clinicians 74, 229–263 (2024). - PubMed
    1. Bujanda L., Cosme A., Gil I. & Arenas-Mirave J.I. Malignant colorectal polyps. World J Gastroenterol 16, 3103–3111 (2010). - PMC - PubMed
    1. Amersi F., Agustin M. & Ko C.Y. Colorectal cancer: epidemiology, risk factors, and health services. Clin Colon Rectal Surg 18, 133–140 (2005). - PMC - PubMed
    1. Johnson C.M. et al. Meta-analyses of colorectal cancer risk factors. Cancer Causes Control 24, 1207–1222 (2013). - PMC - PubMed

Publication types

LinkOut - more resources