[Preprint]. 2024 Dec 11:rs.3.rs-5390645.
doi: 10.21203/rs.3.rs-5390645/v1.

CYP1B1-AS1 regulates CYP1B1 to promote Coxiella burnetii pathogenesis by inhibiting ROS and host cell death

Affiliations

CYP1B1-AS1 regulates CYP1B1 to promote Coxiella burnetii pathogenesis by inhibiting ROS and host cell death

Aryashree Arunima et al. Res Sq. .

Abstract

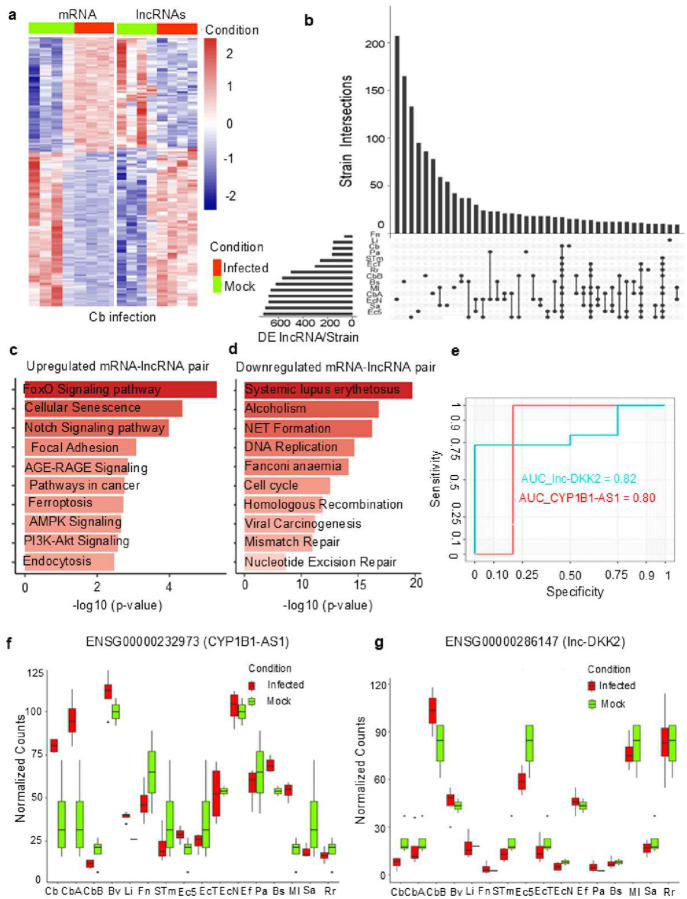
Coxiella burnetii (Cb), the causative agent of Q fever, replicates within host macrophages by modulating immune responses through poorly understood mechanisms. Long non-coding RNAs (lncRNAs) are emerging as critical regulators of inflammation, yet their role in Cb pathogenesis remains largely unexplored. Here, we employed a global transcriptomic approach to identify lncRNAs specific to Cb infection in THP-1 derived macrophages, compared to 15 other microbial infections. CYP1B1-AS1 was uniquely regulated in a spatio-temporal manner during Cb infection. Promoter assays revealed that CYP1B1-AS1 is transcribed by AHR from a bidirectional promoter, enhancing CYP1B1 expression in cis. Inhibition of CYP1B1-AS1 and CYP1B1 increased reactive oxygen species (ROS), mitochondrial membrane depolarization, and apoptosis, suggesting their role in dampening host cell death. Additionally, immunoprecipitation followed by mass spectrometry identified the mitochondrially localized Cb effector CBU_0937 as an interactor of the CYP1B1 enzyme. These events facilitate Cb intracellular survival. Our findings identify CYP1B1-AS1 as a potential molecular target for combating Cb infection.

Keywords: CBU_0937; CYP1B1; CYP1B1-AS1; Coxiella burnetii; apoptosis; bacterial pathogenesis; inflammation; lncRNA marker; mitochondrial effector; reactive oxygen species (ROS).


Conflict of interest statement

Competing interests The authors declare no other competing interests.

Figures

Fig 1.
Fig 1.. CYP1B1-AS1 and lnc-DKK2 are uniquely regulated in Coxiella burnetii (Cb) infection.
(a) Hierarchical clustering heatmap of differentially expressed (DE) mRNAs and DE lncRNAs. Each row represents a gene, and columns represent sample replicates. Relative expression levels are shown on a color scale, with red indicating upregulation and blue indicating downregulation. Fold changes are presented as normalized RPKM (Reads Per Kilobase of transcript per Million mapped reads) and log2-transformed. (b) Upset plot showing overlaps in DE lncRNAs among various strains: C. burnetii Nine Mile Phase II (Cb), C. burnetii Nine Mile Phase II dotA::Tn (CbA), C. burnetii Nine Mile Phase II dotB::Tn (CbB), Escherichia coli DH5α (Ec5), Enterohemorrhagic E. coli O157 (EcT), Enterohemorrhagic E. coli O157Δstx (EcN), Bacillus subtilis P31K6 (Bs), Francisella novicida U112 (Fn), Pseudomonas aeruginosa PAO1 (Pa), Staphylococcus aureus JE2 (Sa), Salmonella enterica subsp. Typhimurium SL1344 (STm), Rhizobium radiobacter (Rr), Micrococcus luteus (Ml), Listeria innocua (Li), Enterococcus faecalis (Ef), and Brucella melitensis ΔvjbR (Bmv). Bars with single dots represent the number of unique DE lncRNAs for each strain. The bar plot on the lower left shows the total number of DE lncRNAs for each strain. KEGG pathway analysis of (c) upregulated mRNAs associated with DE lncRNAs and (d) downregulated mRNAs associated with DE lncRNAs, with color gradient indicating the proportion of transcripts for each annotation. The top 10 significantly enriched terms are shown, filtered at P < 0.05. (e) Receiver Operating Characteristic (ROC) curve analysis displaying the diagnostic value of lnc-DKK2 and CYP1B1-AS1 in different infection models, with Area Under the Curve (AUC) values at P < 0.01 and 95% confidence intervals (CI). (f) Boxplot validating the expression of CYP1B1-AS1 and (g) lnc-DKK2 across infection models, with fold changes represented as normalized RPKM counts.
Fig 2.
Fig 2.. CYP1B1-AS1 and lnc-DKK2 are spatio-temporally regulated during Cb infection.
Cells without siRNA treatment and infected with Cb were labelled as NMII. RNA was harvested at indicated time points for quantitative real-time PCR (qPCR) analysis. Gene expression was normalized against the endogenous control ACTB and compared to uninfected control (Mock). (a-b) Expression levels of CYP1B1-AS1 and CYP1B1 in: (a) THP-1 macrophages, and (b) HeLa cells. (c-d) Expression of lnc-DKK2 and DKK2 in (c) THP-1 macrophages, and (d) HeLa cells. Partial map of coding-noncoding (CNC) co-expression network analysis of (e) CYP1B1 and CYP1B1-AS1. The solid line between nodes represents a positive correlation, and dotted lines represents a negative correlation. Pearson correlation coefficient threshold: −0.9 to 0.9. (f-h) Lungs, spleen and blood harvested from mice groups, intra-tracheally infected with PBS (sham) or Cb Nine Mile I (NMI) at a dosage of 1×10⁷ genome equivalents (GE)/ml. RNA was isolated from homogenized tissues at the indicated days post-infection (p.i.) for qPCR analysis. Gene expression in NMI groups was normalized to ACTB and compared to the sham groups. Expression of CYP1B1-AS1 and CYP1B1 in (f) Lungs, (g) Spleen, and (h) Blood. For panels, (a-d), n=3; and for panels (f-h), n=5; error bars indicate mean ± SD. Statistical significance: *, P < 0.05; **, P < 0.01; ***, P < 0.0001; ****, P < 0.0001; ns, not significant, P ≥ 0.05; one-way ANOVA.
Fig 3.
Fig 3.. CYP1B1-AS1 is transcribed from a shared bidirectional promoter and regulates CYP1B1 in cis.
(a) Coding potential was assessed by transfecting pCDNA-CYP1B1-AS1 into HEK293T cells and immunoblotting for FLAG antibody (b) The Coding Potential Assessment Tool (CPAT) predicts a very low coding potential for CYP1B1-AS1. TUG1, NEAT1, ANCR, and MALAT1 serve as control lncRNAs, while GAPDH is the positive control for mRNA. (c) qPCR analysis of RNA from nuclear and cytoplasmic fractions to analyze the localization of CYP1B1-AS1 in THP-1 cells. Expression was normalized to ACTB and compared to the cytoplasmic fraction. NEAT1 and TUG1 are used as nuclear- and cytoplasmic-enriched controls, respectively. (d) A schematic of the transcription factor binding sites (TFBS) of AHR is predicted upstream of CYP1B1-AS1 transcription start site (TSS; +1) by JASPAR and Expasy Eukaryotic promoter database (EPD) (P-value < 0.001). (e) Motif binding sequence logo of AHR. (f) Schematic of the reporter assay to study bidirectional promoter activity. (g) Luciferase reporter assay demonstrating bidirectional promoter activity of CYP1B1-AS1 (PCYP1B1-AS1). F-Luc/FL represents firefly luciferase activity and R-Luc/RL represents renilla luciferase activity. pF-Luc and pR-Luc are positive controls for PACTB. (h-i) qPCR analysis showing CYP1B1 expression in CYP1B1-AS1 knockdown in: (h) HeLa and (i) THP-1 macrophages. (j-k) qPCR analysis showing CYP1B1-AS1 expression in CYP1B1 knockdown in: (j) HeLa cells, and (k) THP-1 macrophages. Gene expression was normalized to HPRT and compared to cells treated with negative control siRNA (NC). KD1 and KD2 represent different siRNA mediated knockdowns and their combination used for target silencing, designated as lncCYPB or CYPB. (l-m) Immunoblot analysis of CYP1B1 levels in lncCYPB cells: (l) HeLa cells, and (m) THP-1 macrophages. β-Actin serves as the loading control. (n-o) mRNA decay assay of: (n) CYP1B1, and (o) HPRT in NC and lncCYPB cells after actinomycin D treatment upto 5 h. The half-lives (t1/2) of mRNA were calculated using one-phase decay analysis from 2(-ΔCT) values of transcripts. For all data, n=3 and, error bars indicate mean ± SD. Statistical significance: *, P < 0.05; **, P < 0.01; ***, P < 0.0001; ****, P < 0.0001; ns, not significant, P ≥ 0.05; (g) two-way ANOVA; (h-k) one-way ANOVA.
Fig 4.
Fig 4.. CYP1B1-AS1 and CYP1B1 are transcriptionally activated by AHR, and their knockdown reduces cell permissiveness to Cb replication.
(a-b) Bacterial growth was assessed by quantifying genomic equivalents (GE) over a 7-day time course. Cells without knockdown, infected with Cb and CbA, are designated as NMII and ΔdotA, respectively. Knockdown of CYP1B1 (CYPB), CYP1B1-AS1 (lncCYPB), both genes (dCYPB), and NC cells infected with Cb are designated as CYPB: NMII, lncCYPB: NMII, dCYPB: NMII, and NC: NMII, respectively. GE counts in (a) THP-1 macrophages at MOI of 50, and (b) in HEK293T cells at an MOI of 100. Results are expressed as means from three technical replicates of three independent experiments. (c) Immunofluorescence staining and representative images of Cb-infected THP-1 macrophages at 5 days p.i. Nuclei (blue), LAMP1 (green), Cb and CbA (magenta); scale bar: 10 μM. (d) Quantitative measurements of CCV (Coxiella containing vacuoles) using ImageJ, QuPath, and Labkit algorithms, with each LAMP1+ bacterial compartment representing an individual CCV. Data are shown as mean ± SD of at least 100 CCVs per cell type. (e) qPCR analysis of CYP1B1-AS1 expression in cells treated with FICZ at concentrations of 200 nM and 400 nM, and infected with Cb. Expression was normalized to HPRT and compared to Mock and Mock treated with FICZ as controls. (f) Densitometry plot analysis of CYP1B1 levels using ImageJ. (g) Representative immunoblot of CYP1B1 expression in Mock and NMII cells treated with FICZ, with β-Actin as the loading control. ELISA quantification of: (h) TNF-α, (i) IL-6, (j) IL-8, and (k) IL-1β. For all data, n=3, and error bars indicate mean ± SD. Statistical significance: *, P < 0.05; **, P < 0.01; ***, P < 0.0001; ****, P < 0.0001; ns, not significant, P ≥ 0.05. Statistical tests used: (d, h-k) one-way ANOVA; (e, g) two-way ANOVA.
Fig 5.
Fig 5.. CYP1B1-AS1 and CYP1B1 knockdown generates mitochondrial reactive oxygen species (ROS) and promotes mitochondrial dysfunction.
(a) Representative flow cytometry analysis of control and infected cells stained with DCFDA. (b-c) Mean fluorescence intensity of intracellular ROS produced in DCFDA-stained cells at: (b) 24 h p.i. and (c) 48 h p.i. (d) Mitochondrial ROS production was assessed by flow cytometry staining using MitoSOX red staining. (e-f) Mean fluorescence intensity of mitochondrial ROS in MitoSOX red-stained cells at: (e) 24 h p.i. and (f) 48 h p.i. (g) Mitochondrial mass of cells were assessed by flow cytometry analysis of MitoTracker Green-stained cells. (k-l) Mean fluorescence intensity of MitoTracker Green-stained cells at: (h) 24 h p.i. and (i) 48 h p.i. (j) Mitochondrial membrane potential was measured by flow cytometry analysis of MitoProbe TMRM-stained cells. (k-l) Mean fluorescence intensity of mitochondrial membrane potential of MitoProbe TMRM-stained cells at: (k) 24 h p.i. and (l) 48 h p.i. For all data, n=3, and error bars indicate mean ± SD. Statistical significance: **, P < 0.01; ***, P < 0.0001; ****, P < 0.0001; ns, not significant, P ≥ 0.05; one-way ANOVA.
Fig 6.
Fig 6.. CYP1B1-AS1 and CYP1B1 regulate mitochondrial ROS and inhibits apoptosis.
Fluorescence was detected using flow cytometry to analyze the populations of early apoptotic (Annexin-V+ PI; Q1), late apoptotic (Annexin-V+ PI+; Q2), dead (PI+; Q3), and non-apoptotic (Annexin-V PI; Q4) cells. (a-d) Flow cytometry analysis of cells stained with Propidium Iodide (PI) and FITC-Annexin-V at 24 h p.i. (a) Representative flow cytometry of control cells at 24 h p.i. (b) Mean fluorescence intensity of the early apoptotic population at 24 h p.i. (c) Representative flow cytometry of Cb-infected cells at 24 h p.i. (d) Mean fluorescence intensity of late apoptotic population at 24 h p.i. (e-h) Flow cytometry analysis of cells stained with PI and FITC-Annexin-V at 48 h p.i. (e) Representative flow cytometry of control cells at 48 h p.i. (f) Mean fluorescence intensity of the early apoptotic population (g) Representative flow cytometry of Cb-infected cells at 48 h p.i. (h) Mean fluorescence intensity of late apoptotic population at 48 h p.i. (i) Protein-protein interaction (PPI) analysis map of IP-enriched proteins of 3×FLAG-CYP1B1, manually constructed and assigned to functional groups based on biological pathways. (k) Proteins identified by quantitative MS/MS analysis following IP of CBU_0937 tagged with C-terminal 3XFLAG (CBU0937–3XFLAG). Gene names of selected proteins and corresponding Log2(fold-change; FC) and P-value of each protein are listed. (I) Annotated LC-MS/MS spectrum of m/z 499.258 from CBU0937–3XFLAG IP confirming the presence of CYP1B1. Missing annotation on the peptide sequence denotes lack of detection of that particular b/y ion fragment. For panels (a-h), n=3, and error bars indicate mean ± SD. Statistical significance: *, P < 0.05; **, P < 0.01; ***, P < 0.0001; ****, P < 0.0001; ns, not significant, P ≥ 0.05; (b, d, f and h) one-way ANOVA.
Fig 7.
Fig 7.. Proposed mechanism of CYP1B1-AS1 dependent regulation of CYP1B1 during Cb infection.
During Cb infection transcription factor AHR is activated. AHR transcriptionally activates both CYP1B1-AS1 and CYP1B1 from a shared bidirectional promoter. This activation leads to the regulation of CYP1B1 transcripts, which is dependent on CYP1B1-AS1 expression through a cis mechanism within the local genome. The subsequent transcriptional regulation of CYP1B1 results in increased turnover of the CYP1B1 enzyme. CYP1B1, a cytochrome P450 1B1 enzyme that is enriched in the mitochondria of the cell. It plays a critical role in maintaining mitochondrial redox homeostasis by regulating ROS, thereby reducing ROS-mediated inflammation and inhibiting apoptosis. This regulatory mechanism may promote increased cell survival during Cb infection.

Similar articles

References

    1. Baker RE, et al. Infectious disease in an era of global change. Nat Rev Microbiol 20, 193–205 (2022). - PMC - PubMed
    1. Herrick JA, Lederman RJ, Sullivan B, Powers JH, Palmore TN. Brucella arteritis: clinical manifestations, treatment, and prognosis. Lancet Infect Dis 14, 520–526 (2014). - PMC - PubMed
    1. Group IPC. Global burden associated with 85 pathogens in 2019: a systematic analysis for the Global Burden of Disease Study 2019. Lancet Infect Dis 24, 868–895 (2024). - PMC - PubMed
    1. Collaborators GBDAR. Global mortality associated with 33 bacterial pathogens in 2019: a systematic analysis for the Global Burden of Disease Study 2019. Lancet 400, 2221–2248 (2022). - PMC - PubMed
    1. Fleckenstein JM, Matthew Kuhlmann F, Sheikh A. Acute Bacterial Gastroenteritis. Gastroenterol Clin North Am 50, 283–304 (2021). - PMC - PubMed

Publication types

LinkOut - more resources