[Preprint]. 2024 Dec 13:rs.3.rs-5494402.
doi: 10.21203/rs.3.rs-5494402/v1.

Restoring Mitochondrial Quantity and Quality to Reverse Warburg Effect and Drive Tumor Differentiation

Affiliations

Restoring Mitochondrial Quantity and Quality to Reverse Warburg Effect and Drive Tumor Differentiation

Jiangbin Ye et al. Res Sq. .

Update in

Abstract

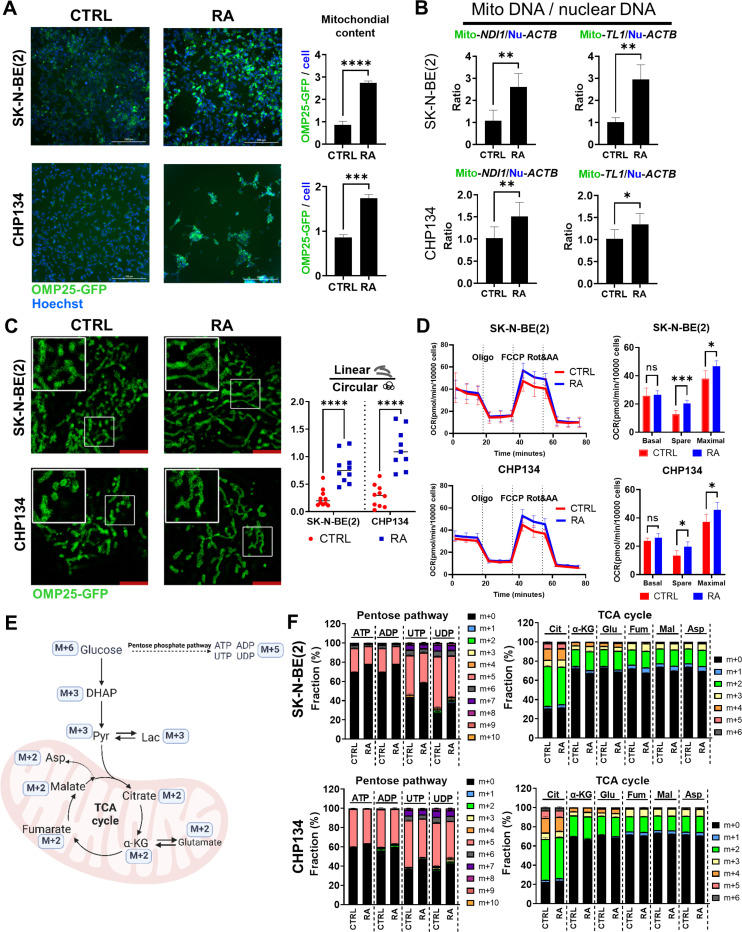
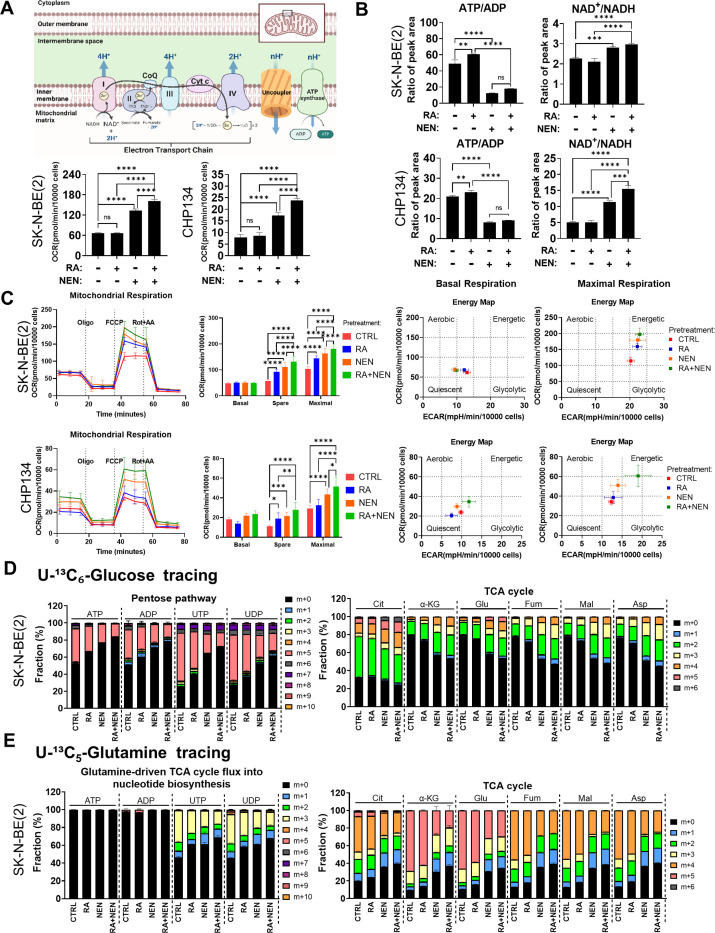
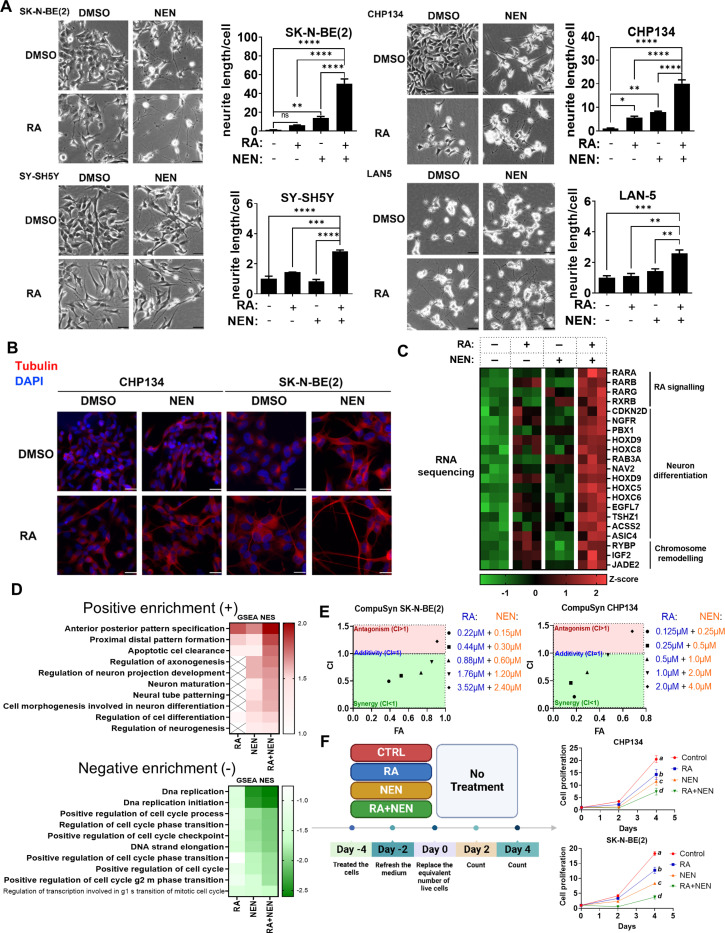
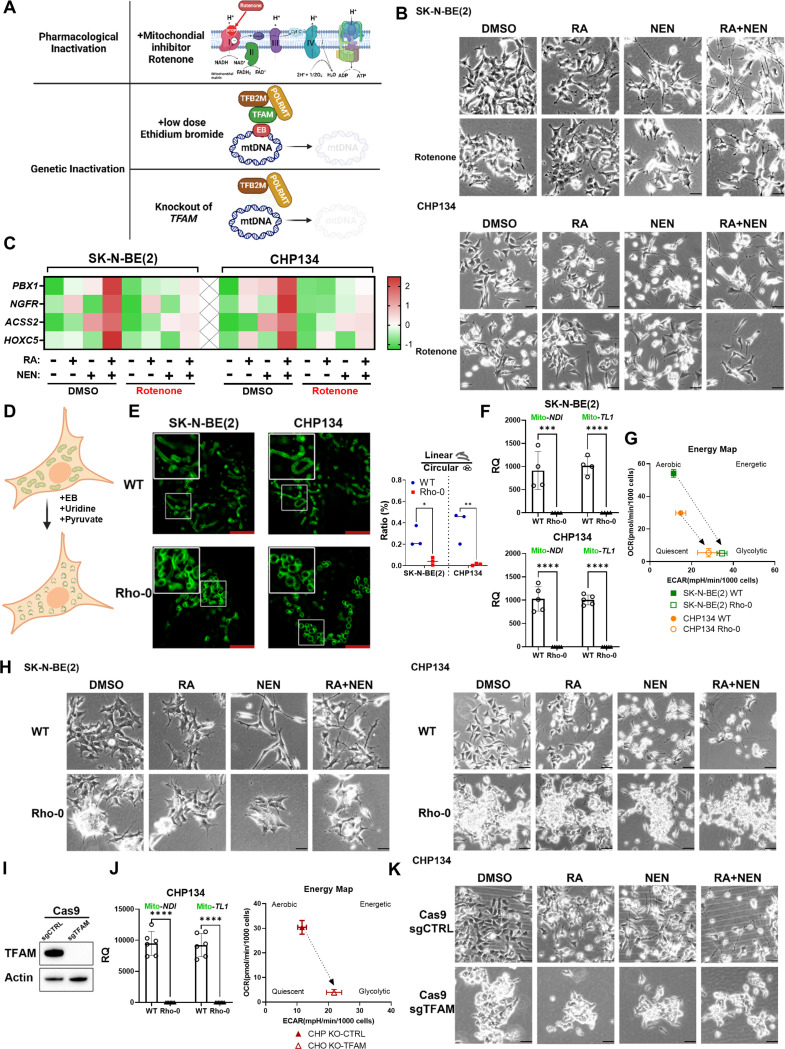
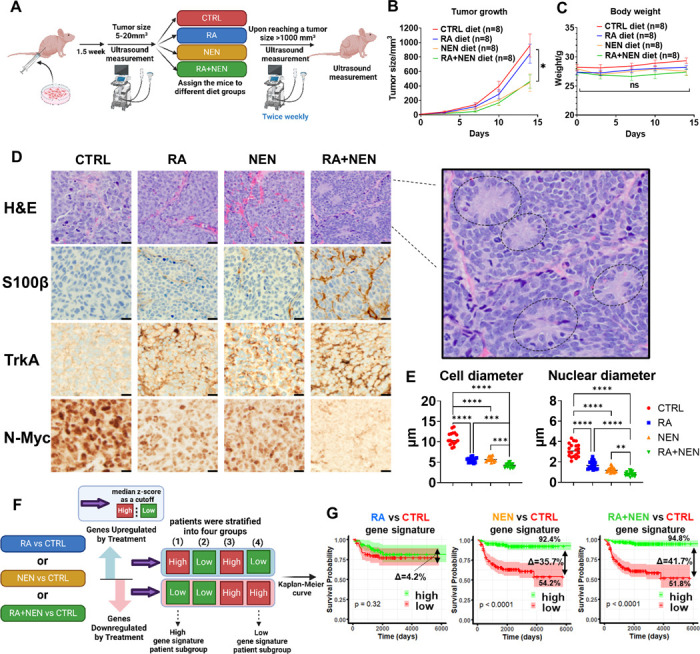
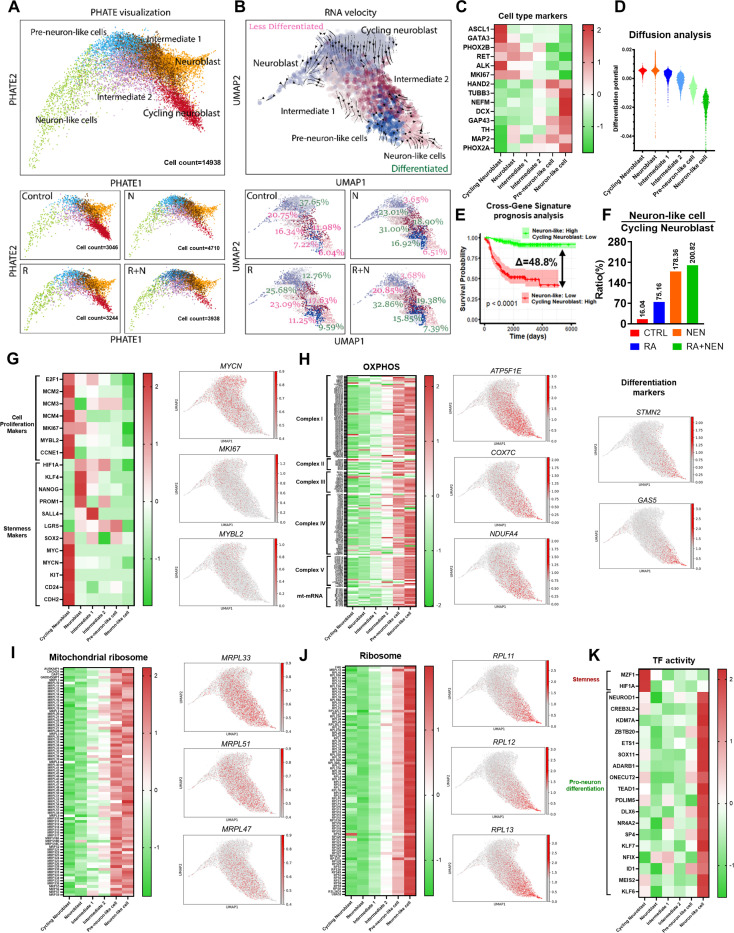
Reduced mitochondrial quality and quantity in tumors is associated with dedifferentiation and increased malignancy. However, it remains unclear how to restore mitochondrial quantity and quality in tumors, and whether mitochondrial restoration can drive tumor differentiation. Our study shows that restoring mitochondrial function using retinoic acid (RA) to boost mitochondrial biogenesis and a mitochondrial uncoupler to enhance respiration synergistically drives neuroblastoma differentiation and inhibits proliferation. U-13C-glucose/glutamine isotope tracing revealed a metabolic shift from the pentose phosphate pathway to oxidative phosphorylation, accelerating the TCA cycle and switching substrate preference from glutamine to glucose. These effects were reversed by ETC inhibitors or in ρ0 cells lacking mtDNA, emphasizing the necessity of mitochondrial function for differentiation. Dietary RA and uncoupler treatment promoted tumor differentiation in an orthotopic neuroblastoma xenograft model, evidenced by neuropil production and Schwann cell recruitment. Single-cell RNA sequencing analysis of the orthotopic xenografts revealed that this strategy effectively eliminated the stem cell population, promoted differentiation, and increased mitochondrial gene signatures along the differentiation trajectory, which could potentially significantly improve patient outcomes. Collectively, our findings establish a mitochondria-centric therapeutic strategy for inducing tumor differentiation, suggesting that maintaining/driving differentiation in tumor requires not only ATP production but also continuous ATP consumption and sustained ETC activity.


Conflict of interest statement

Declaration of interests H.J., Y.L., and J.Y. have been granted a patent related to this manuscript. Additional Declarations: Yes there is potential Competing Interest. H.J., Y.L., and J.Y. have been granted a patent related to this manuscript.

Figures

Figure 1
Figure 1. RA increased mitochondrial quantity without activating mitochondrial respiration
(A) SK-N-BE(2) and CHP134 cells stably expressing 3XHA-OMP25-GFP (green) were treated with DMSO (CTRL) or 1 μM RA for 72 hours. Hoechst dye (blue) was used to stain nuclei, and the GFP signal was normalized to the number of Hoechst-stained nuclei. (B) The mitochondrial DNA (mtDNA) to nuclear DNA ratio was quantified using qPCR by analyzing the mitochondrial genes ND1 and TL1, normalized to the nuclear gene ACTB. (C) Mitochondrial morphology was visualized via confocal microscopy with a 63x oil lens and 2x zoom, with linear and circular mitochondria analyzed using ZEN 3.9 software. (D)Mitochondrial function was assessed through Seahorse assays, measuring basal, spare, and maximal OCR. (E) A schematic of U-13C-glucose tracing. (F) Glucose labeling fractions in the pentose phosphate pathway and TCA cycle metabolites were measured by LC-MS.
Figure 2
Figure 2. Mitochondrial uncoupler synergizes with RA to activate mitochondrial respiration and shift metabolism from anabolism to catabolism.
(A) Top panel: Schematic of the oxidative phosphorylation illustrating how uncouplers reduce proton gradients, thereby stimulating mitochondrial respiration. Bottom panel: Basal oxygen consumption rates (OCR) were measured using the Seahorse analyzer in SK-N-BE(2) and CHP134 cells following a 72-hour treatment with 1 μM RA, 1 μM NEN, RA+NEN, or vehicle. (B) ATP/ADP and NAD+/NADH ratios in SK-N-BE(2) and CHP134 cells treated with RA, NEN, or a combination, measured by LC-MS. (C) Left: Mitochondrial respiration measured via Seahorse assays shows basal, spare, and maximal respiration in SK-N-BE(2) and CHP134 cells pre-treated with CTRL, RA, NEN, or RA+NEN. Right: Energy maps display the shifts in mitochondrial respiration and glycolytic activity under different treatment conditions. (D) U-13C6-glucose and (E) U-13C5-glutamine tracing, measured by LC-MS, illustrate the labeling fraction changes of the pentose phosphate pathway and TCA cycle metabolites upon CTRL, RA, NEN, or RA+NEN treatment conditions.
Figure 3
Figure 3. RA and mitochondrial uncoupler synergize to induce neuronal differentiation in neuroblastoma cells.
(A) Phase-contrast images of SK-N-BE(2), CHP134, SY-SH5Y, and LAN-5 neuroblastoma cells treated with DMSO (CTRL), RA, NEN, or a combination of RA+NEN. Neurite outgrowth was quantified by measuring the average neurite length per cell. Bar graphs depict neurite length for each condition. Scale bar: 25μM. (B) Immunofluorescence staining of neuron marker β-Tubulin-III (red) and DAPI (blue) in CHP134 and SK-N-BE(2) cells treated with DMSO, RA, or NEN, showing enhanced neurite formation upon treatment. (C) Heatmap showing differential expression of genes related to RA signaling, neuron differentiation, and chromosome remodeling in SK-N-BE(2) cells treated with RA, NEN, or a combination. (D) Gene set enrichment analysis (GSEA) illustrating positive and negative enrichment of biological pathways in cells treated with RA, NEN, or RA+NEN. E) Chou-Talalay analysis of SK-N-BE(2) and CHP134 cells treated with varying concentrations of RA and NEN, showing synergistic effects in inhibiting cell proliferation (CI values were calculated using CompuSyn). (F) Left panel: Experimental timeline for cell proliferation assays. Cells were pre-treated with CTRL, RA, NEN, or RA+NEN, and cell counts were measured every two days in the absence of treatment. Right panel: Growth curves illustrate cell proliferation under each conditions for SK-N-BE(2) and CHP134 cells.
Figure 4
Figure 4. Mitochondrial respiration is essential for neuroblastoma differentiation.
(A) Schematic illustrating three methods of mitochondrial inactivation. Pharmacological inactivation is achieved by Rotenone, a complex I inhibitor that disrupts the electron transport chain. Genetic inactivation includes low-dose ethidium bromide (EB), which inhibits mitochondrial DNA (mtDNA) replication by interfering with TFAM, TFB2M, and POLRMT, and TFAM knockout, which leads to complete mtDNA depletion, impairing mitochondrial function. (B) Phase-contrast images of SK-N-BE(2) and CHP134 cells treated with DMSO, RA, NEN, RA+NEN, with or without rotenone. (C) Heatmap displaying gene expression related to RA signaling and differentiation in SK-N-BE(2) and CHP134 cells under different treatments, measured by q-RT-PCR. (D) Schematic of ρ0 cell generation through EtBr treatment. (E) Left: Confocal images showing mitochondrial morphology in WT and ρ0 cells. Right: the ratio of linear/circular mitochondria. (F) mtDNA quantification in SK-N-BE(2) and CHP134 WT and ρ0 cells. (G) Energy map of mitochondrial respiration in WT and ρ0 cells. (H) Phase-contrast images of WT and ρ0 cells treated with DMSO, RA, NEN, or RA+NEN. (I) Western blot of TFAM and β-actin in CHP134 cells with TFAM knockout. (J) mtDNA quantification and energy map for CHP134 sgCTRL and sgTFAM cells. (K) Phase-contrast images of CHP134 sgCTRL and sgTFAM cells treated with DMSO, RA, NEN, or RA+NEN.
Figure 5
Figure 5. Effects of RA and NEN treatment on tumor differentiation in an orthotopic neuroblastoma model and potential beneficial impact on patient survival.
(A) Schematic representation of the experimental design showing ultrasound monitoring, dietary interventions (CTRL, RA, NEN, and RA+NEN), and tumor size measurements until euthanasia. (B) Tumor growth curves displaying the effects of different diets on tumor volume over time. (C) Body weight measurements of mice under various diet conditions to assess treatment tolerance. (D) Representative histological sections with H&E staining and immunohistochemistry (IHC) for S100β, TrkA, N-Myc, and NF across treatment groups. (E) Quantification of cell and nuclear diameters, as well as the mitosis-karyorrhexis index (MKI), under different treatments. (F) Schematic illustrating bioinformatic analysis to stratify patient subgroups based on gene signature upregulation and downregulation. (G) Kaplan-Meier survival curves for patients with low or high RA, NEN, and RA+NEN treatments gene signatures.
Figure 6
Figure 6. Single-cell RNA sequencing reveals differentiation dynamics induced by RA and uncoupler treatments.
(A) PHATE visualization showing the differentiation trajectory from Cycling Neuroblasts to Neuron-like cells, illustrating distinct cell clusters at different stages of differentiation (Cycling Neuroblast, Neuroblast, Intermediate 1, Intermediate 2, Pre-neuron-like, and Neuron-like cells). (B) RNA velocity analysis highlights the directional differentiation process, with cells transitioning from less differentiated (Cycling Neuroblast) to more differentiated (Neuron-like cells). (C) Heatmap of differentiation stage markers indicating the expression patterns of key genes across different cell clusters. Cycling neuroblast markers include ASCL1, GATA3, PHOX2B, RET, ALK, and MKI67, while neuron markers include HAND2, TUBB3, NEFM, DCX, GAP43, TH, MAP2, and PHOX2A.(D) Diffusion analysis shows the transition probabilities across the cell populations, emphasizing the differentiation from Cycling Neuroblasts to Neuron-like cells. (E) Cross-gene signature prognosis analysis shows a significant improvement in survival probability associated with higher Neuron-like/Cycling Neuroblast ratios, highlighting the therapeutic relevance of promoting differentiation. (F) Bar graph comparing the ratio of Neuron-like cells to Cycling Neuroblasts across treatment conditions. (G) Heatmap of cell proliferation markers and stemness markers across cell clusters and treatments. (H-K) Heatmaps depicting the expression patterns of genes related to OXPHOS, mitochondrial ribosome, ribosome, and transcription factor activity, respectively, along the differentiation trajectory.

References

    1. Vander Heiden M. G., Cantley L. C. & Thompson C. B. Understanding the Warburg effect: the metabolic requirements of cell proliferation. science 324, 1029–1033 (2009). - PMC - PubMed
    1. Thompson C. B. et al. A century of the Warburg effect. Nat Metab 5, 1840–1843, doi: 10.1038/s42255-023-00927-3 (2023). - DOI - PubMed
    1. Warburg O. On the origin of cancer cells. Science 123, 309–314 (1956). - PubMed
    1. DeBerardinis R. J. & Chandel N. S. We need to talk about the Warburg effect. Nature Metabolism 2, 127–129, doi: 10.1038/s42255-020-0172-2 (2020). - DOI - PubMed
    1. Reznik E. et al. Mitochondrial DNA copy number variation across human cancers. Elife 5, doi: 10.7554/eLife.10769 (2016). - DOI - PMC - PubMed

Publication types

LinkOut - more resources