[Preprint]. 2024 Dec 13:rs.3.rs-5390824.
doi: 10.21203/rs.3.rs-5390824/v1.

Community dynamics during de novo colonization of the nascent peri-implant sulcus

Affiliations

Community dynamics during de novo colonization of the nascent peri-implant sulcus

Purnima Kumar et al. Res Sq. .

Update in

Abstract

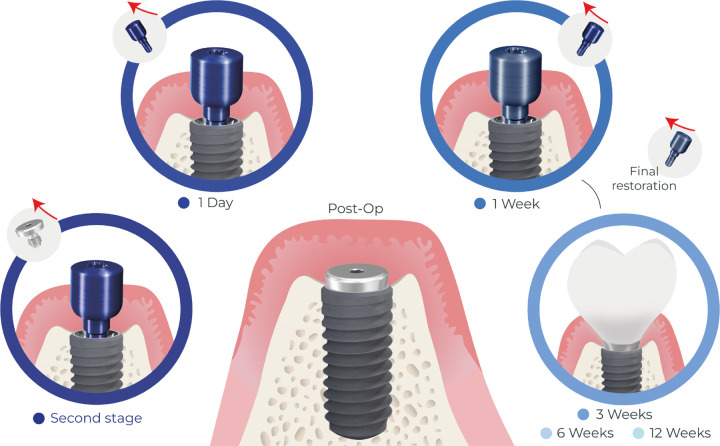
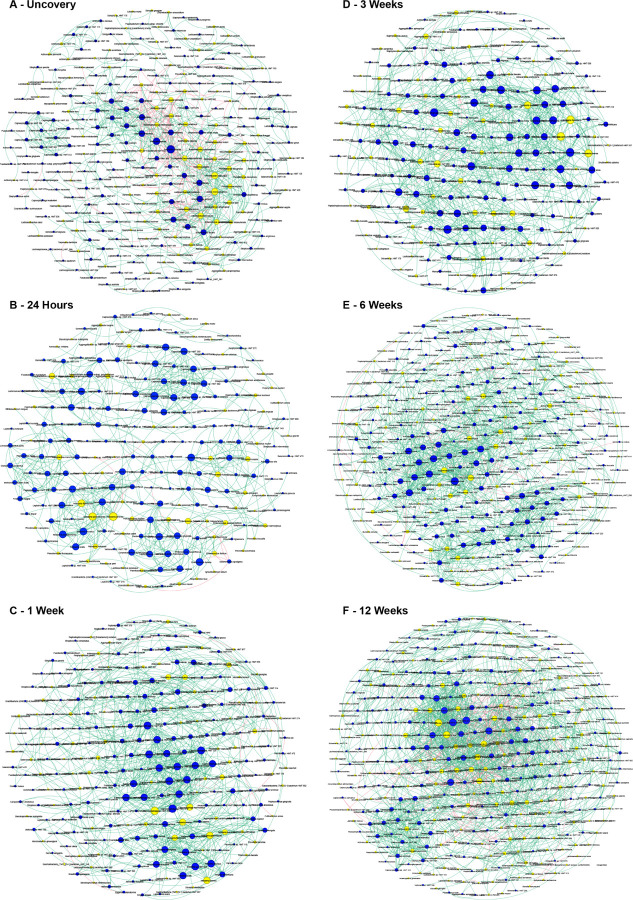
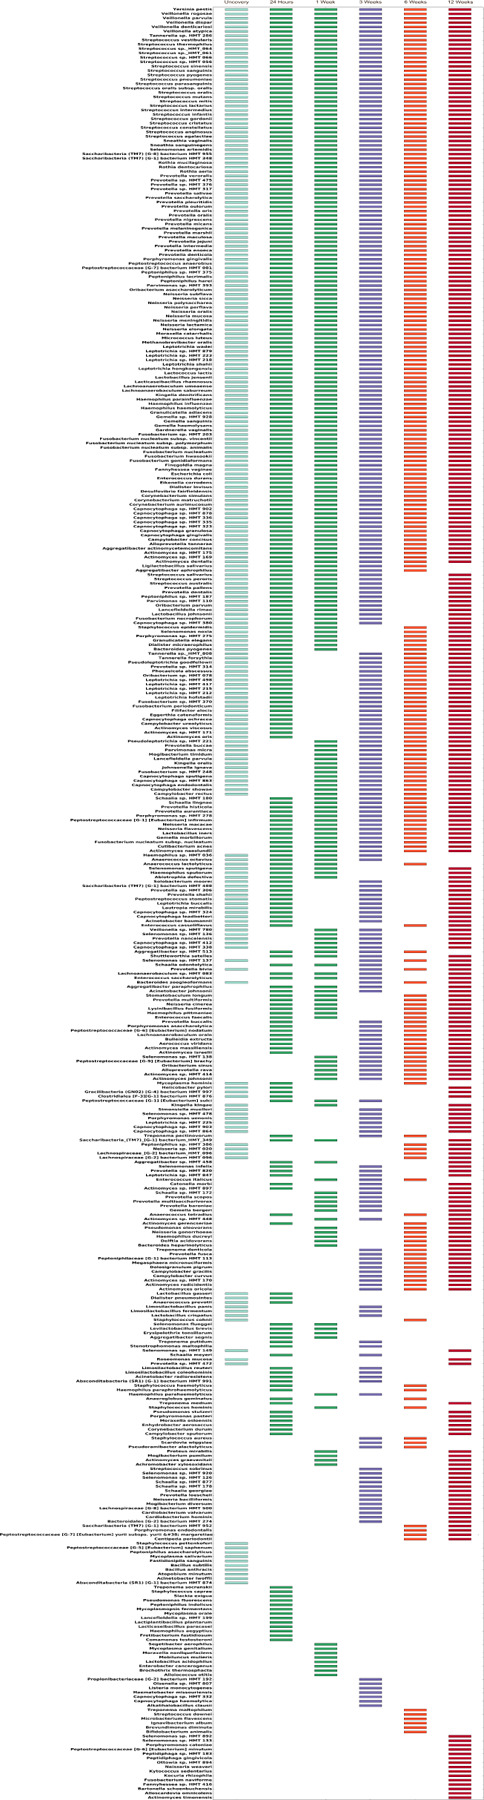
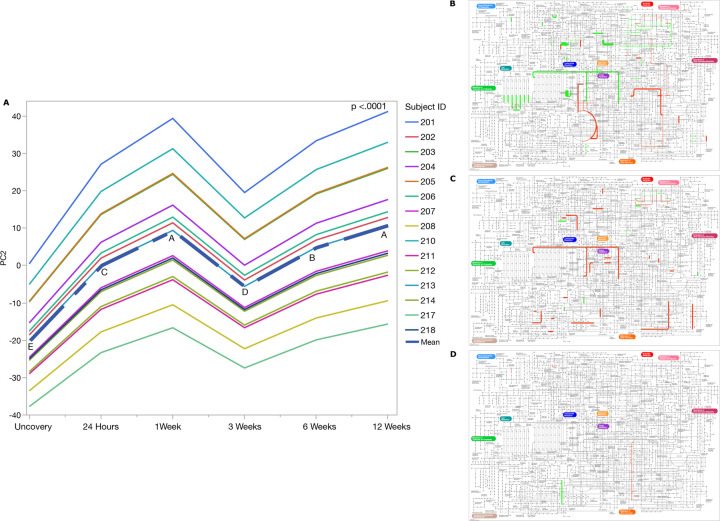
Dental implants have restored chewing function to over 100,000,000 individuals, yet almost 1,000,000 implants fail each year due to peri-implantitis, a disease triggered by peri-implant microbial dysbiosis. Our ability to prevent and treat peri-implantitis is hampered by a paucity of knowledge of how these biomes are acquired and the factors that engender normobiosis. Therefore, we combined a 3-month interventional study of 15 systemically and periodontally healthy adults with whole genome sequencing, fine-scale enumeration and graph theoretics to interrogate colonization dynamics in the pristine periimplant sulcus. We discovered that colonization trajectories of implants differ substantially from adjoining teeth in acquisition of new members and development of functional synergies. Source-tracking algorithms revealed that this niche is initially seeded by bacteria trapped within the coverscrew chamber during implant placement. These pioneer species stably colonize the microbiome and exert a sustained influence on the ecosystem by serving as anchors of influential hubs and by providing functions that enable cell replication and biofilm maturation. Unlike the periodontal microbiome, recruitment of new members to the peri-implant community occurs on nepotistic principles. Maturation is accompanied by a progressive increase in anaerobiosis, however, the predominant functionalities are oxygen-dependent over the 12-weeks. The peri-implant community is easily perturbed following crown placement, but demonstrates remarkable resilience; returning to pre-perturbation states within three weeks. This study highlights important differences in the development of the periodontal and peri-implant ecosystems, and signposts the importance of placing implants in periodontally healthy individuals or following the successful resolution of periodontal disease.


Conflict of interest statement

Competing interests: None of the authors have any competing interests to declare.

Figures

Figure 1
Figure 1
Clinical study design.
Figure 2
Figure 2. The coverscrew chamber as a source of pioneer species of the peri-implant microbiome
Figure 2A represents species-level composition of coverscrew chamber microbiome at uncovery. Species present at a relative abundance of ≥1% are included in the pie chart. Taxa with an average relative abundance <1% are grouped in “Others”. Figure 2B is the sources of the pioneer species in the pristine implant sulcus. The implant and tooth at uncovery were set as the sources and implant at 24 hours as the sink (p<0.05, Kruskal-Wallis test). Boxplots not connected by same letter are significantly different.
Figure 3
Figure 3. Community dynamics during the development of the peri-implant sulcus.
Network graphs of implant at baseline, 24 hours, 1 week, 3 weeks, 6 weeks, and 12 weeks based on Sparse Co-occurrence analysis are shown in panels A-F. Each network graph contains nodes (circles sized by relative abundance per group) and edges (lines). Nodes colored in blue represent the pioneer species, while yellow nodes represent new species. Green edges represent positive correlation, while red edges represent negative correlation (r≥ |0.80|). Data supporting this figure can be found in Supplementary Material Table S2.
Figure 4
Figure 4. Recruitment of species follows principles of nepotism while pioneer species impact recruitment of new species and flow of resources.
Within-module/across modules plot (ZiPi plot) analysis of the nodes following module identification with SCNIC(Pi > 0.62) are shown in Panel A. Panel B demonstrates empirical (dashed) and surrogate phylodiversity accumulation over the 12 week observation period. Surrogate curves are colored according to the dispersion (D) value. New species with a previously detected close relative are shown in blue, while those that do not have a close relative are shown in green. The surrogate curve (teal) is above the empirical curve (dashed), indicating that species recruitment is phylogenetically constrained, and follows nepotism. Panel C represents the dispersion parameter (D) estimates as a violin plot. The dot in the center of a violin is the mean, and bars represent 95% confidence intervals for the D estimate. Panel D represents a Sankey diagram of the Extended local similarity analysis (eLSA) revealing associations between pioneers and non-pioneer species over 12 weeks. Data supporting this figure can be found in Supplementary Material Table S3.
Figure 5
Figure 5
Is a waterfall plot of the core microbiome (species present in ≥100% of individuals) over time. Each bar indicates the presence of a species at the particular time point.
Figure 6
Figure 6. Functional dynamics of the developing peri-implant microbiome demonstrates stability after 3 weeks.
Panel A shows b-diversity across time, as estimated by Compositional Tensor Factorization of functional genes. There was a significant increase in functional diversity between baseline and 3-weeks, followed by functional stabilization (p <0.0001 REML test). Panels B-D represent functional pathways that were diiferentially abundant during the 12-week observation period (P<0.05, FDR-adjusted Wald Test). Line thickness is sized by log⁡(2) fold change. Panel B: Differences between uncovery and 24 hours. Panel C: Differences between 24 hours and 1 week. Panel D: Differences between 1- and 3-weeks. No signifncat differences were detected after 3 weeks.
Figure 7
Figure 7. Implant colonization trajectories differ from those of adjoining teeth in diversity and extent of expansion.
Panel A shows b-diversity across time, as estimated by Compositional Tensor Factorization of functional genes (Location: Implants versus Adjoining Teeth, p <0.016; Visits: p <0.0001; Visit*Location: p <0.0001, REML test). Panel B shows Linear discriminant analysis (LDA) of Jaccard index clustered by site (implant and teeth) and visit, The microbiome demonstrated significant differences based on both, site type and time (p <0.0001 REML test). Panel C shows Linear discriminant analysis (LDA) of Bray-Curtis distances clustered by site (implant and teeth) and visit. The microbiome demonstrated significant differences based on both, site type and time (p <0.0001 REML test).

References

    1. NIDCR. Tooth Loss Among Adults 20–64. 2014. Available from: http://www.nidcr.nih.gov/DataStatistics/FindDataByTopic/ToothLoss/ToothL...
    1. Emami E, De Souza RF, Kabawat M, Feine JS. The impact of edentulism on oral and general health. Vol. 2013, International Journal of Dentistry. 2013. - PMC - PubMed
    1. Jain N, Dutt U, Radenkov I, Jain S. WHO’s global oral health status report 2022: Actions, discussion and implementation. Oral Diseases. John Wiley and Sons Inc; 2023. - PubMed
    1. Brånemark PI. Osseointegration and its experimental background. J Prosthet Dent. 1983. Sep;50(3):399–410. - PubMed
    1. Becker W, Becker BE, Newman MG, Nyman S. Clinical and microbiologic findings that may contribute to dental implant failure. Int J Oral Maxillofac Implants. 1990;5(1):31–8. - PubMed

Publication types

LinkOut - more resources