[Preprint]. 2024 Dec 13:rs.3.rs-5449794.
doi: 10.21203/rs.3.rs-5449794/v1.

The impact of chronic intermittent hypoxia on enzymatic activity in memory-associated brain regions of male and female rats

Affiliations

The impact of chronic intermittent hypoxia on enzymatic activity in memory-associated brain regions of male and female rats

Steve Mabry et al. Res Sq. .

Update in

Abstract

Background: Obstructive sleep apnea (OSA) is an intermittent hypoxia disorder associated with cognitive dysfunction, including learning and memory impairments. There is evidence that alterations in protease activity and neuronal activation as associated with cognitive dysfunction, are dependent on sex, and may be brain region-specific. However, the mechanisms mediating OSA-induced cognitive impairments are unclear. Therefore, we used a rat model of OSA, chronic intermittent hypoxia (CIH), to investigate protease activity (e.g., calpain and caspase-3) and neuronal activation (early growth response protein 1, EGR-1) in brain regions associated with learning and memory. We used a rat model of OSA known as chronic intermittent hypoxia (CIH) to investigate protease activity (calpain and caspase-3) and neuronal activation (early growth response protein 1, EGR-1) in brain regions associated with learning and memory.

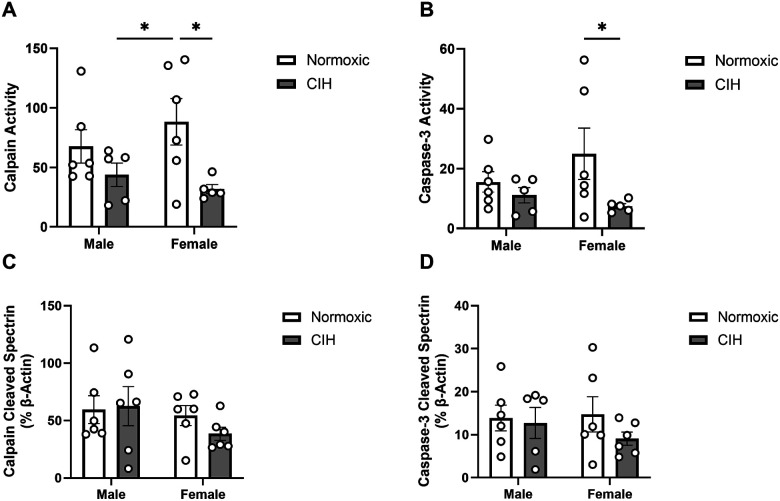
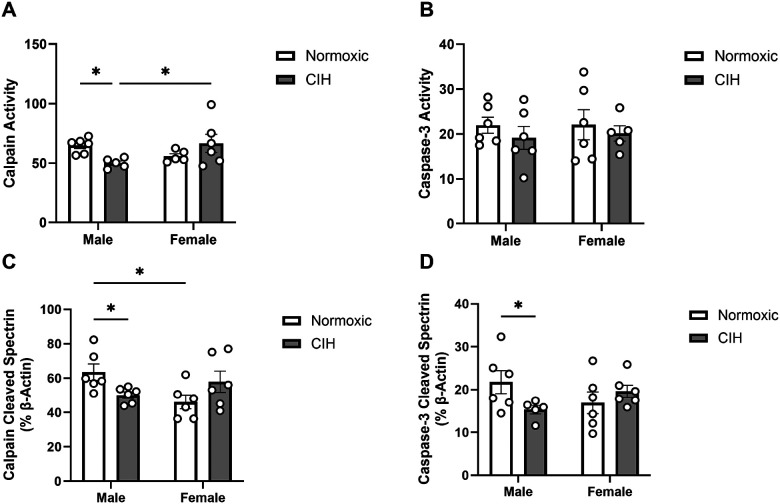
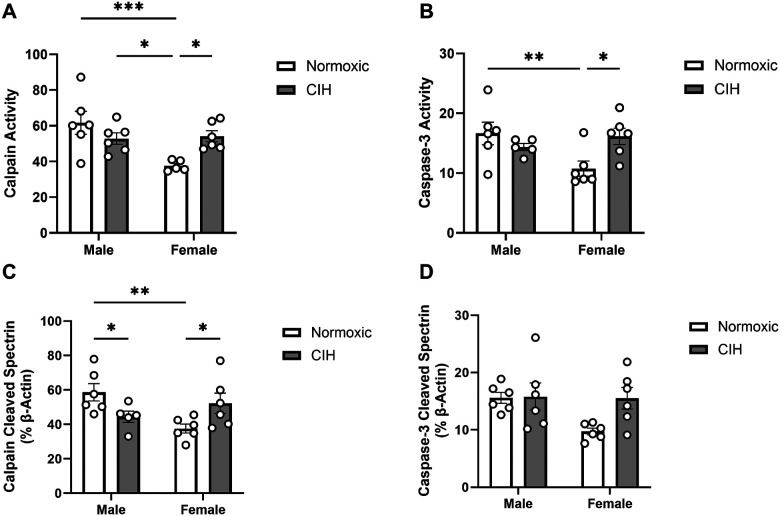
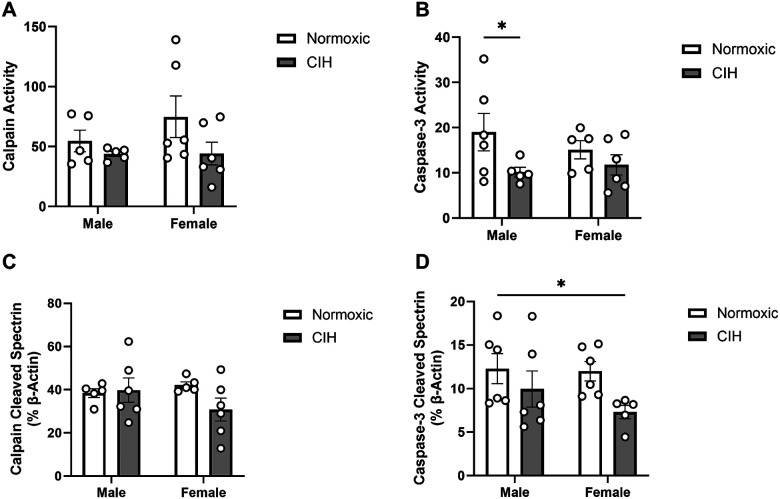
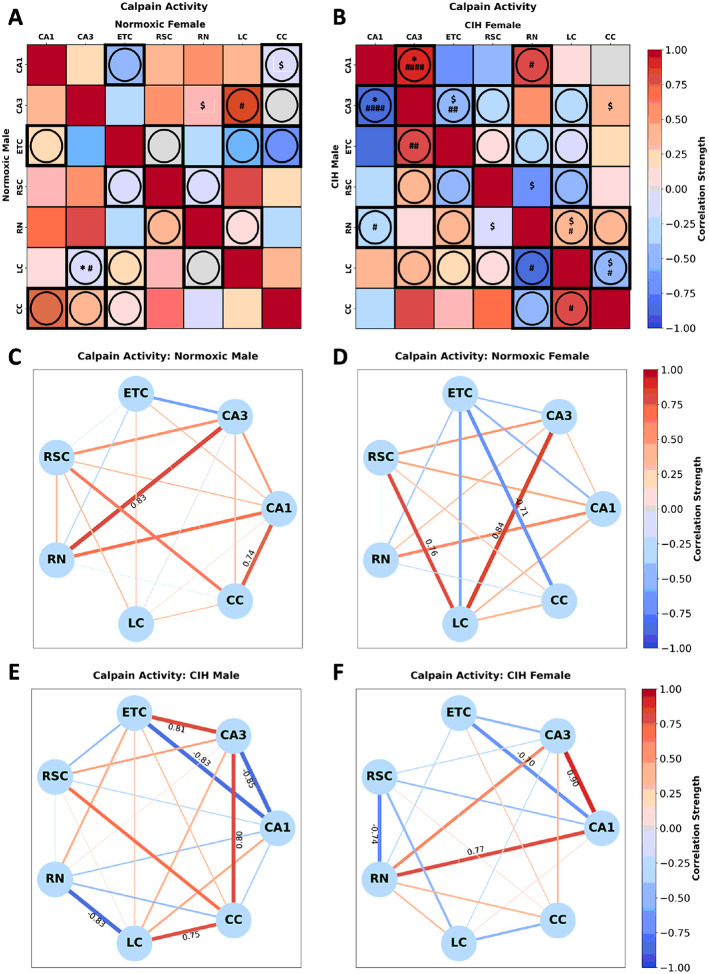
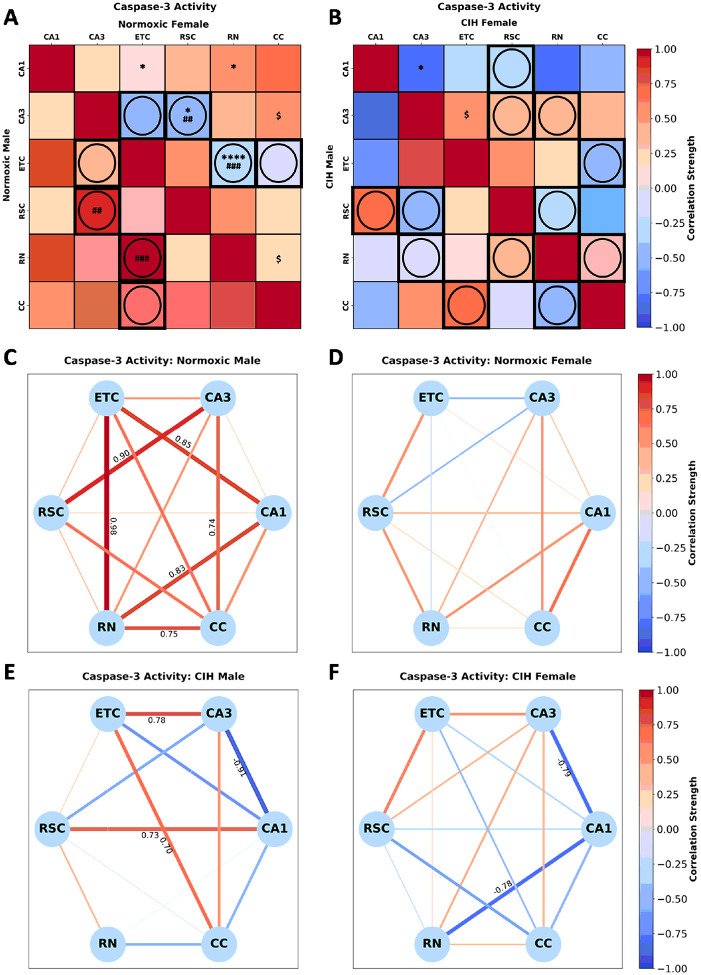
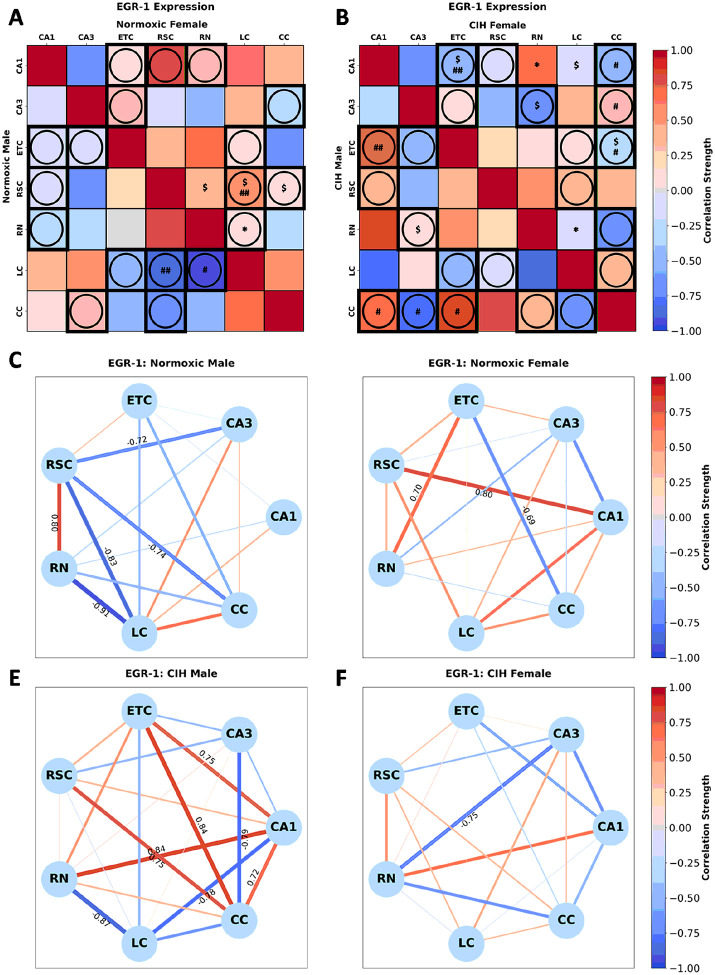
Methods: Male and female Sprague Dawley rats were exposed to CIH or room air (normoxic) for 14 days. We quantified protease activity and cleaved spectrin products, along with EGR-1 protein expression in hippocampal subregions (CA1, CA3), cortical regions [entorhinal cortex (ETC), retrosplenial cortex (RSC), cerebellar cortex (CC)], and subcortical regions [raphe nucleus (RN), locus coeruleus (LC)] associated with learning and memory. Within each group, Pearson correlations of calpain activity, caspase-3 activity, and EGR-1 expression were performed between brain regions. Sex differences within normoxic and CIH correlations were examined.

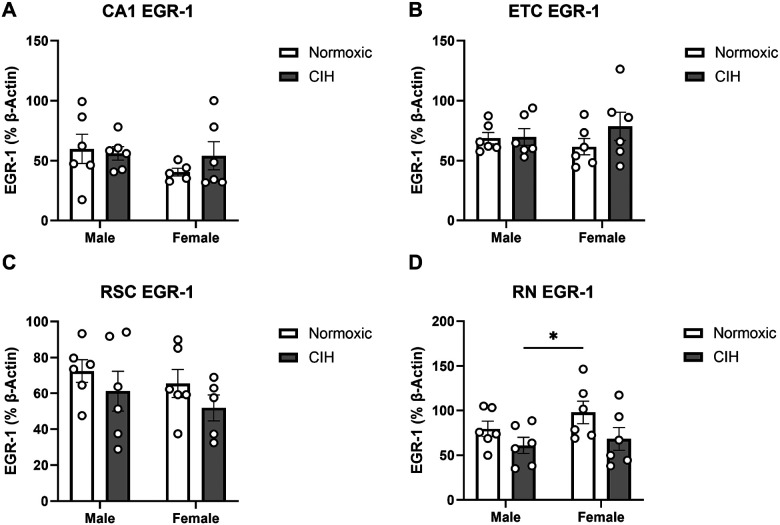
Results: CIH dysregulated calpain activity in male ETC and female CA1 and RSC. CIH dysregulated caspase-3 activity in male RN and female CA1 and RSC. CIH decreased calpain and caspase-3 cleavage products in male ETC. CIH decreased calpain-cleaved spectrin in male RSC but increased these products in female RSC. EGR-1 expression was decreased in male and female RN. Correlational analysis revealed CIH increased excitatory connections in males and increased inhibitory connections in females. EGR-1 expression in males shifted from negative to positive correlations.

Conclusions: Overall, these data show that CIH dysregulates protease activity and impairs neuronal function in a brain region- and sex-dependent manner. This indicates that males and females exhibit sex-specific vulnerabilities to mild OSA. These findings concur with our previous behavioral studies that demonstrated memory impairment in CIH-exposed rats.

Keywords: calpain; caspase-3; chronic intermittent hypoxia; early growth response protein 1; sex differences.


Conflict of interest statement

Competing Interests: Rebecca L. Cunningham is the associate editor of Biology of Sex Differences. No conflicts of interest, financial or otherwise, are disclosed by the remaining authors.

Figures

Figure 1
Figure 1. Protease activity and cleavage products in the CA1
(A) Quantified calpain activity, (B) quantified caspase-3 activity, (C) expression of calpain cleaved spectrin, and (D) expression of caspase-3 cleaved spectrin in the CA1. Calpain and caspase-3 activity represent % of protease cleaved spectrin to uncleaved spectrin (250 kD). Calpain cleaved spectrin (150 kD) and caspase-3 cleaved spectrin (120 kD) expression normalized to β-actin. Raw values are shown and error bars denote mean ± S.E.M. Analyzed by 2-way ANOVA with Fisher’s LSD multiple comparisons tests. Post-hoc significance indicated by: * = p≤0.05. Significant effects observed: (A): CIH (F1, 18=8.100; p=0.011; η2=0.294); (B): CIH (F1, 18=4.407; p=0.050; η2=0.182). CIH: Chronic intermittent hypoxia.
Figure 2
Figure 2. Protease activity and cleavage products in the entorhinal cortex
(A) Quantified calpain activity, (B) quantified caspase-3 activity, (C) expression of calpain cleaved spectrin, and (D) expression of caspase-3 cleaved spectrin in the ETC. Calpain and caspase-3 activity represent % of protease cleaved spectrin to uncleaved spectrin (250 kD). Calpain cleaved spectrin (150 kD) and caspase-3 cleaved spectrin (120 kD) expression normalized to β-actin. Raw values are shown and error bars denote mean ± S.E.M. Analyzed by 2-way ANOVA with Fisher’s LSD multiple comparisons tests. Post-hoc significance indicated by: * = p≤0.05. Significant effects observed: (A): CIH X Sex (F1,18=7.565; p=0.013; η2=0.286); (C): CIH X Sex (F1, 20=7.891; p=0.010; η2=0.274); (D): CIH X Sex (F1, 19=4.635; p=0.044; η2=0.190). CIH: Chronic intermittent hypoxia; ETC: Entorhinal cortex.
Figure 3
Figure 3. Protease activity and cleavage products in the retrosplenial cortex
(A) Quantified calpain activity, (B) quantified caspase-3 activity, (C) expression of calpain cleaved spectrin, and (D) expression of caspase-3 cleaved spectrin in the RSC. Calpain and caspase-3 activity represent % of protease cleaved spectrin to uncleaved spectrin (250 kD). Calpain cleaved spectrin (150 kD) and caspase-3 cleaved spectrin (120 kD) expression normalized to β-actin. Raw values are shown and error bars denote mean ± S.E.M. Analyzed by 2-way ANOVA with Fisher’s LSD multiple comparisons tests. Post-hoc significance indicated by: * = p≤0.05; ** = p≤0.01; *** = p≤0.001. Significant effects observed: (A): Sex (F1, 19=7.443; p=0.013; η2=0.204), CIH X Sex (F1, 19=9.216; p=0.007; η2=0.253); (B): CIH X Sex (F1, 19=7.367; p=0.014; η2=0.248); (C): CIH X Sex (F1, 19=10.110; p=0.005; η2=0.324). CIH: Chronic intermittent hypoxia; RSC: Retrosplenial cortex.
Figure 4
Figure 4. Protease activity and cleavage products in the raphe nucleus
(A) Quantified calpain activity, (B) quantified caspase-3 activity, (C) expression of calpain cleaved spectrin, and (D) expression of caspase-3 cleaved spectrin in the RN. Calpain and caspase-3 activity represent % of protease cleaved spectrin to uncleaved spectrin (250 kD). Calpain cleaved spectrin (150 kD) and caspase-3 cleaved spectrin (120 kD) expression normalized to β-actin. Raw values are shown and error bars denote mean ± S.E.M. Analyzed by 2-way ANOVA with Fisher’s LSD multiple comparisons tests. Post-hoc significance indicated by: * = p≤0.05; ** = p≤0.01. Significant effects observed: (B): CIH (F1, 18=4.758; p=0.043; η2=0.199); (D): CIH (F1, 19=5.036; p=0.037; η2=0.198). CIH: Chronic intermittent hypoxia; RN: Raphe nucleus.
Figure 5
Figure 5. EGR-1 expression in the hippocampus and associated brain regions
(A) Quantified EGR-1 expression in the CA1; (B) ETC; (C) RSC; and (D) RN. EGR-1 expression normalized to β-actin. Raw values are shown and error bars denote mean ± S.E.M. Analyzed by 2-way ANOVA with Fisher’s LSD multiple comparisons tests. Post-hoc significance indicated by: * = p≤0.05. Significant effect observed (D): CIH: (F1, 20=4.857; p=0.039; η2=0.183). CIH: Chronic intermittent hypoxia; ETC: Entorhinal cortex; RN: Raphe nucleus; RSC: Retrosplenial cortex.
Figure 6
Figure 6. Sex and CIH differences in the inter-regional correlations of calpain activity
(A) Heatmaps of calpain activity in normoxic and (B) and CIH males and females. (C) Correlation connectomes for normoxic males, (D)normoxic females, (E) CIH males, and (F) CIH females. Darkness of color (A-F) and thickness of network edges (C-F) represent the strength of the correlation, with correlations larger than ± 0.67 labeled. Correlations between brain regions were analyzed by Pearson correlations. Significance indicated by: $ = p≤0.10; * = p≤0.05. Correlations that are in opposite directions are indicated with a circle and green outline. Significance between sexes was determine using z-test statistics. Significance indicated by # = p≤0.10; ## = p≤0.05; #### = p≤0.001.
Figure 7
Figure 7. Sex and CIH differences in the inter-regional correlations of caspase-3 activity
(A) Heatmaps of caspase-3 activity in normoxic and (B) and CIH males and females. (C) Correlation connectomes for normoxic males, (D)normoxic females, (E) CIH males, and (F) CIH females. Darkness of color (A-F) and thickness of network edges (C-F) represent the strength of the correlation, with correlations larger than ± 0.67 labeled. Correlations between brain regions were analyzed by Pearson correlations. Significance indicated by: $ = p≤0.10; * = p≤0.05; **** = p≤0.001. Correlations that are in opposite directions are indicated with a circle and green outline. Significance between sexes was determine using z-test statistics. Significance indicated by ## = p≤0.05; ### = p≤0.01.
Figure 8
Figure 8. Sex and CIH differences in the inter-regional correlations of EGR-1 expression
(A) Heatmaps of EGR-1 expression in normoxic and (B) and CIH males and females. (C) Correlation connectomes for normoxic males, (D)normoxic females, (E) CIH males, and (F) CIH females. Darkness of color (A-F) and thickness of network edges (C-F) represent the strength of the correlation, with correlations larger than ± 0.67 labeled. Correlations between brain regions were analyzed by Pearson correlations. Significance indicated by: $ = p≤0.10; * = p≤0.05. Correlations that are in opposite directions are indicated with a circle and green outline. Significance between sexes was determine using z-test statistics. Significance indicated by # = p≤0.10; ## = p≤0.05.

Similar articles

References

    1. Marchi NA, Pizzarotti B, Solelhac G, Berger M, Haba-Rubio J, Preisig M, et al. Abnormal brain iron accumulation in obstructive sleep apnea: A quantitative MRI study in the HypnoLaus cohort. J Sleep Res. 2022;31:6:e13698. 10.1111/jsr.13698. - DOI - PMC - PubMed
    1. Duan W, Liu X, Ping L, Jin S, Yu H, Dong M, et al. Distinct functional brain abnormalities in insomnia disorder and obstructive sleep apnea. Eur Arch Psychiatry Clin Neurosci. 2023;273:2:493–509. 10.1007/s00406-022-01485-7. - DOI - PubMed
    1. Zacharias HU, Weihs A, Habes M, Wittfeld K, Frenzel S, Rashid T, et al. Association Between Obstructive Sleep Apnea and Brain White Matter Hyperintensities in a Population-Based Cohort in Germany. JAMA Netw Open. 2021;4:10e2128225. 10.1001/jamanetworkopen.2021.28225. - DOI - PMC - PubMed
    1. Macey PM, Haris N, Kumar R, Thomas MA, Woo MA, Harper RM. Obstructive sleep apnea and cortical thickness in females and males. PLoS ONE. 2018;13:3e0193854. 10.1371/journal.pone.0193854. - DOI - PMC - PubMed
    1. Kerner NA, Roose SP, Pelton GH, Ciarleglio A, Scodes J, Lentz C, et al. Association of Obstructive Sleep Apnea with Episodic Memory and Cerebral Microvascular Pathology: A Preliminary Study. Am J Geriatr Psychiatry. 2017;25:3316–25. 10.1016/j.jagp.2016.11.009. - DOI - PMC - PubMed

Publication types

LinkOut - more resources