[Preprint]. 2024 Dec 10:rs.3.rs-5285011.
doi: 10.21203/rs.3.rs-5285011/v1.

Uncovering causal gene-tissue pairs and variants: A multivariable TWAS method controlling for infinitesimal effects

Affiliations

Uncovering causal gene-tissue pairs and variants: A multivariable TWAS method controlling for infinitesimal effects

Yihe Yang et al. Res Sq. .

Update in

Abstract

Transcriptome-wide association studies (TWAS) are commonly used to prioritize causal genes underlying associations found in genome-wide association studies (GWAS) and have been extended to identify causal genes through multivariable TWAS methods. However, recent studies have shown that widespread infinitesimal effects due to polygenicity can impair the performance of these methods. In this report, we introduce a multivariable TWAS method named Tissue-Gene pairs, direct causal Variants, and Infinitesimal effects selector (TGVIS) to identify tissue-specific causal genes and direct causal variants while accounting for infinitesimal effects. In simulations, TGVIS maintains an accurate prioritization of causal gene-tissue pairs and variants and demonstrates comparable or superior power to existing approaches, regardless of the presence of infinitesimal effects. In the real data analysis of GWAS summary data of 45 cardiometabolic traits and expression/splicing quantitative trait loci (eQTL/sQTL) from 31 tissues, TGVIS improves causal gene prioritization and enhances the biological interpretability over existing methods.


Conflict of interest statement

Declarations of interests The authors declare no competing interests.

Figures

Figure 1:
Figure 1:
Overview of TGVIS. A: A hypothetical causal diagram illustrating the relationships between variants (including xQTLs, direct causal variants, and non-causal variants), tissue-specific gene expressions, and an outcome in a cis-region, where the arrows indicate the flow of causal effects in the causal diagram. Variants may be in LD, with only a subset having cis-regulatory effects. Gene expressions or splicing events are tissue-specific and form a complex co-regulation network. Only molecular phenotypes directly connected to the outcome are considered causal. B: Locus-zoom plot of the LDL-C GWAS in the PCSK9 locus. The bottom panel displays the coding regions of genes located within this locus, including PCSK9, UPS24, BSND, etc. C: Workflow of TGVIS, consisting of three main steps. (I) Input, including GWAS summary data, eQTL summary data from multiple tissues, and LD matrix. (II) Preprocessing, including eQTL selection and pre-screening. We applied S-Predixcan to pre-screen some noise pairs, aiming to reduce the dimension of the multivariable TWAS model to a reasonable scale. (III) Estimation, where TGVIS first selects the causal gene-tissue pairs and direct causal variants via SuSiE and then estimates the infinitesimal effect via REML. (IV) Output, including the causal effect estimate, direct causal effect estimate, and infinitesimal effect estimates. We output plots demonstrating the causal gene-tissue pairs, direct causal variants and predicted infinitesimal effects: (1) the Pratt indices and other statistics such as PIPs, estimates, SEs of causal gene-tissue pairs in the 95% credible sets, (2) the Pratt indices of the direct causal variants in the 95% credible sets, and (3) the best linear unbiased predictors of infinitesimal effects. The non-zero variance in output III in this figure suggests the non-zero contribution of infinitesimal effects.
Figure 2:
Figure 2:
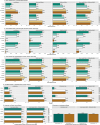
Simulation results comparing the performances of TGVIS, TGFM, cTWAS, Grant2022, and cisIVW with xQTL sample size = 200. A: The MSE of causal effect estimates under no pleiotropy, in the presence of direct causal variants, infinitesimal effects, and both. B: The true negative rate of identifying all 98 non-causal gene-tissue pairs under different scenarios i.e., no pleiotropy, in the presence of direct causal variants, infinitesimal effects, and both. This is equivalent to that if a method incorrectly identifies any non-causal pairs as causal, it will not be counted as a true negative event. C: Bar plots display the true positive rates of identifying all 2 causal gene-tissue pairs under different scenarios. D: The averaged number of identified direct causal variants by the different methods. The number of true causal variants were set to 0, 2, 0, and 2 for no-pleiotropy, direct-causal-variant, infinitesimal-effects, and direct-causal-variant and infinitesimal-effects, respectively. E: The averaged correlation of the true and estimated direct causal effects across simulations. F: The averaged correlation of the true and predicted infinitesimal effects across simulations.
Figure 4:
Figure 4:
Genetic architecture inferred from the identification of causal gene-tissue pairs and direct causal variants. A: The ratio of identified causal gene-tissue pairs per credible set by TVGIS. Different gene-tissue pairs may share the same set of xQTLs, and end in the same credible set. B: The ratio of the number of causal eQTLs over the number of sQTLs per causal gene-tissue pair, indicating the distribution of eQTLs and sQTLs contributing to the gene-tissue pairs. C: The distribution of eGene and sGene in credible sets identified by TGVIS and TGFM. When a credible set contains multiple gene-tissue pairs, we calculate the proportion of eGenes and sGenes. D: The distribution of Pratt Index estimates for different traits, with a comparison between TGVIS and TGFM. In the boxplot, each point represents the Pratt Index of various molecular phenotypes within a single locus.
Figure 5:
Figure 5:
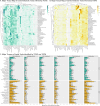
Distribution of major tissues for cardiometabolic traits. A: Heatmaps display the major tissues associated with each trait, identified by TGVIS. B: Heatmaps display the major tissues associated with each trait, identified by TGFM. The major gene-tissue pairs are cataloged based on stringent criteria (CS-Pratt > 0.15 for TGVIS and PIP > 0.5 for TGFM) and the proportions of major tissues derived from significant gene-tissue pairs for each trait are quantified. Hierarchical clustering is applied to arrange the heatmaps, utilizing the Ward2 method and Euclidean distance. C: Major tissues of lipid traits identified by TGVIS and TGFM. This panel shows bar plots detailing the number of causal gene-tissue pairs for various lipid traits, including HDL-C, LDL-C, TC, triglycerides, APOA1, and APOB, as identified by both TGVIS (top) and TGFM (bottom).
Figure 6:
Figure 6:
Evaluation of identified gene-tissue pairs. A: The colocalized proportions of causal credible sets (under two criteria) yielded by TGVIS and TGFM, respectively. B: The numbers and proportions of causal cis-genes in the list of FDA-approved drug-target genes provided by Trajanoska et al., identified by TGVIS (left) and TGFM (right), respectively. C: The number of significant pGenes in univariable MR analysis and the ratio of significant pGene in univariable MR analysis divided by significant eGenes/sGenes in eQTL/sQTL analysis.
Figure 7:
Figure 7:
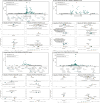
Locuszoom plots comparing the results of TGVIS and TGFM. A-C: LDL-C (PCSK9 locus). D-F: LDL-C (HMGCR locus). G-I: CAD (PHACTR1 locus), K-L: BMI (FTO locus). For each locus, we included three plots: (1) the GWAS of the trait, (2) the PIP of gene-tissue pairs and direct causal variants identified by the TGVIS and TGFM, and (3) the Pratt index of corresponding gene-tissue pairs and variants. For TGVIS, causality is determined by (1) the variables are in a 95% credible set and (2) the Pratt index of this credible set is larger 0.15. For TGFM, the causality is determined by (1) the individual PIP is larger than 0.5.

Similar articles

References

    1. Graham S. E. et al. The power of genetic diversity in genome-wide association studies of lipids. Nature 600, 675–679 (2021). - PMC - PubMed
    1. Yengo L. et al. A saturated map of common genetic variants associated with human height. Nature 610, 704–712 (2022). - PMC - PubMed
    1. Suzuki K. et al. Genetic drivers of heterogeneity in type 2 diabetes pathophysiology. Nature 627, 347–357 (2024). - PMC - PubMed
    1. Mostafavi H., Spence J. P., Naqvi S. & Pritchard J. K. Systematic differences in discovery of genetic effects on gene expression and complex traits. Nat. Genet. 55, 1866–1875 (2023). - PubMed
    1. Wallace C. A more accurate method for colocalisation analysis allowing for multiple causal variants. PLOS Genet. 17, e1009440 (2021). - PMC - PubMed

Publication types

LinkOut - more resources