. 2024 Dec 6:15:1466363.
doi: 10.3389/fpls.2024.1466363. eCollection 2024.

Evaluation of drought and salinity tolerance potentials of different soybean genotypes based upon physiological, biochemical, and genetic indicators

Affiliations

Evaluation of drought and salinity tolerance potentials of different soybean genotypes based upon physiological, biochemical, and genetic indicators

Yahya Alzahrani. Front Plant Sci. .

Abstract

The present study has evaluated different soybean genotypes to understand the salt and drought tolerance mechanisms based on physiological traits (photosynthesis, stomatal conductance, chlorophyll, and cell membrane stability), antioxidant enzymes (superoxide dismutase, catalase, and peroxidase), reactive oxygen species (H2O2 and O2 •-), osmolytes (glycine betaine, proline, and Na+/K+), plant water relations (relative water content, water potential, and solute potential) and expression of related genes (GmCAT1, GmPOD1, GmSOD, GmP5CS, GmNHX1, GmAKT1, GmDREB1, and GmARF1). The experiment was conducted in a two-factorial arrangement using randomized complete block design (RCBD) with genotypes as one factor and salt, drought, and control treatments as the other factor. All physiological traits, relative water content, and water potential decreased significantly in all soybean genotypes due to individual and combined treatments of drought and salt stress, with significantly less decrease in soybean genotypes G4620RX, DM45X61, and NARC-21. Besides that, the activity of antioxidant enzymes, production of ROS, accumulation of osmolytes, solute potential, and Na+/K+ ratio were increased significantly in all soybean genotypes under salt and water deficit conditions. As a whole, the soybean genotypes G4620RX, DM45X61, and NARC-21 showed the maximum enzymatic activity with less increase in ROS and Na+/K+ in addition to a high accumulation of osmolytes and an increase in solute potential. Correspondingly, the genotypes exhibiting high physiological and biochemical tolerance to drought and salt stresses showed the high expression of genes imparting the stress tolerance. Moreover, correlation, heatmap, and principal component analysis further confirmed the varying physiological and biochemical responses of all soybean genotypes under individual and combined applications of drought and salinity stresses. Overall, the present study confirmed that plants opt for the integrated physiological, biochemical, and genetic approaches to counteract the harmful effects of environmental stresses.

Keywords: antioxidants; gene expression; integrated response; oxidative stress; water relations.


Conflict of interest statement

The author declares that the research was conducted in the absence of any commercial or financial relationships that could be construed as a potential conflict of interest.

Figures

Figure 1
Figure 1
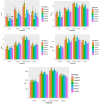
Effect of individual and combined applications of drought and salt stress on the physiological traits (photosynthesis, Pn; stomatal conductance, Gs; chlorophyll, Chl; cell membrane stability, CMS) of soybean genotypes. The values indicated in the figure indicate mean estimates analyzed during a tri-replicate two-factorial experiment at p ≤ 0.05. Units: Pn (µmol m-2 s-1), Gs (mmol m-2 s-1), Chl (g kg-1), CMS (%). The asterisk indicates that the bar values following different letters are significantly different at p ≤ 0.05.
Figure 2
Figure 2
Effect of individual and combined treatments of drought and salinity stress on osmolytes (glycine betaine, GB; proline) and Na+/K+ in soybean genotypes. The values indicated in the figure are means analyzed during a tri-replicate two-factorial experiment at p ≤ 0.05. Units: GB (µg g-1FW), proline (mg g–1 FW). The asterisk indicates that the bar values following different letters are significantly different at p ≤ 0.05.
Figure 3
Figure 3
Effect of individual and combined applications of drought and salt stress on antioxidant enzymes (catalase, CAT; peroxidase, POD; superoxide dismutase, SOD) and ROS (H2O2 and O2 •−) in soybean genotypes. The values indicated in the figure are means analyzed during a tri-replicate two-factorial experiment at p ≤ 0.05. Units: Enzymatic activity (U mg-1 protein), ROS (nmol µg-1FW). The asterisk indicates that the bar values following different letters are significantly different at p ≤ 0.05.
Figure 4
Figure 4
Effect of individual and combined applications of drought and salt stress on water traits (relative water content, RWC; water potential, WP (ψw); osmotic potential, SP (ψs)) of soybean genotypes. The values indicated in the figure indicate mean estimates analyzed during a tri-replicate two-factorial experiment at p ≤ 0.05. Units: RWC (%), ψw (-MPa), ψs (MPa). The asterisk indicates that the bar values following different letters are significantly different at p ≤ 0.05.
Figure 5
Figure 5
Correlation chart indicating the pairwise association among physiological traits, antioxidant enzymes, reactive oxygen species, osmolytes, and plant water relations in soybean genotypes. The significance of association is proportional to the size of the font in the table. The large font size represents high significance, and the small font size represents no significance. Photosynthesis, Pn; stomatal conductance, Gs; chlorophyll, Chl; cell membrane stability, CMS; catalase, CAT; peroxidase, POD; superoxide dismutase, SOD; glycine betaine, GB; relative water content, RWC; water potential (ψw), WP; osmotic potential (ψs), SP. ***, significant at p ≤ 0.001; **, significant at p ≤ 0.01; *, significant at p ≤ 0.05.
Figure 6
Figure 6
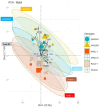
PCA biplot indicating varying degrees of association of physiological traits, antioxidant enzymes, reactive oxygen species, osmolytes, and plant water relation in soybean genotypes. The soybean genotypes (inscribed by eclipses) positioned closer to the traits’ vectors have a stronger association of respective traits compared to genotypes positioned away from the traits’ vectors. Besides that, closer vectors represent the strong association of respective traits and vice versa. Photosynthesis, Pn; stomatal conductance, Gs; chlorophyll, Chl; cell membrane stability, CMS; catalase, CAT; peroxidase, POD; superoxide dismutase, SOD; glycine betaine, GB; relative water content, RWC; water potential (ψw), WP; osmotic potential (ψs), SP.
Figure 7
Figure 7
PCA biplot indicating varying degrees of association of physiological traits, antioxidant enzymes, reactive oxygen species, osmolytes, and plant water relation due to the individual and combined effects of drought and salt stress. The changing stresses (inscribed by eclipses) affect the paired association of traits in a different way as indicated by the positioning of stress eclipses with respect to the traits’ vectors. Besides that, closer vectors represent the strong association of respective traits and vice versa. Photosynthesis, Pn; stomatal conductance, Gs; chlorophyll, Chl; cell membrane stability, CMS; catalase, CAT; peroxidase, POD; superoxide dismutase, SOD; glycine betaine, GB; relative water content, RWC; water potential (ψw), WP; osmotic potential (ψs), SP.
Figure 8
Figure 8
Heatmap categorizing the wheat genotypes in terms of the varied expression of traits in soybean genotypes under individual and combined applications of drought and salt stresses. The varying color pattern of bands (light to dark) illustrates the extent of variation of trait expression in each soybean genotype. Photosynthesis, Pn; stomatal conductance, Gs; chlorophyll, Chl; cell membrane stability, CMS; catalase, CAT; peroxidase, POD; superoxide dismutase, SOD; glycine betaine, GB; relative water content, RWC; water potential (ψw), WP; osmotic potential (ψs), SP. The asterisk indicates that the white color represents no effect, the color change from light to dark green represents minimum to maximum decline in trait expression, and the color change from light to dark red represents minimum to maximum increase in trait expression.
Figure 9
Figure 9
Relative expression of genes related to drought and salt stress tolerance in different soybean genotypes under individual and combined applications of drought and salt stress. **, significant at p ≤ 0.01; *, significant at p ≤ 0.05.

Similar articles

References

    1. Ahmed K., Shabbir G., Ahmed M., Noor S., Din A. M. U., Qamar M., et al. . (2022). Expression profiling of TaARGOS homoeologous drought responsive genes in bread wheat. Sci. Rep. 12, 3595. doi: 10.1038/s41598-022-07637-y - DOI - PMC - PubMed
    1. Akitha, Devi M. K., Giridhar P. (2015). Variations in physiological response, lipid peroxidation, antioxidant enzyme activities, proline and isoflavones content in soybean varieties subjected to drought stress. PNAS India Sect. B: Biol. Sci. 85, 35–44. doi: 10.1007/s40011-013-0244-0 - DOI
    1. Ali S. G., Rab A. (2017). The influence of salinity and drought stress on sodium, potassium and proline content of Solanum lycopersicum L. cv. Rio grande. Pak. J. Bot. 49, 1–9.
    1. Alici E. H., Arabaci G. (2016). Determination of SOD, POD, PPO and cat enzyme activities in Rumex obtusifolius L. Annu. Res. Rev. Biol. 11, 1–7. doi: 10.9734/ARRB/2016/29809 - DOI
    1. Angon P. B., Tahjib-Ul-Arif M., Samin S. I., Habiba U., Hossain M. A., Brestic M. (2022). How do plants respond to combined drought and salinity stress?—A systematic review. Plants 11, 2884. doi: 10.3390/plants11212884 - DOI - PMC - PubMed

LinkOut - more resources