[Preprint]. 2024 Dec 11:2024.12.09.24318621.
doi: 10.1101/2024.12.09.24318621.

Connectome-based symptom mapping and in silico related gene expression in children with autism and/or attention-deficit/hyperactivity disorder

Affiliations

Connectome-based symptom mapping and in silico related gene expression in children with autism and/or attention-deficit/hyperactivity disorder

Patricia Segura et al. medRxiv. .

Abstract

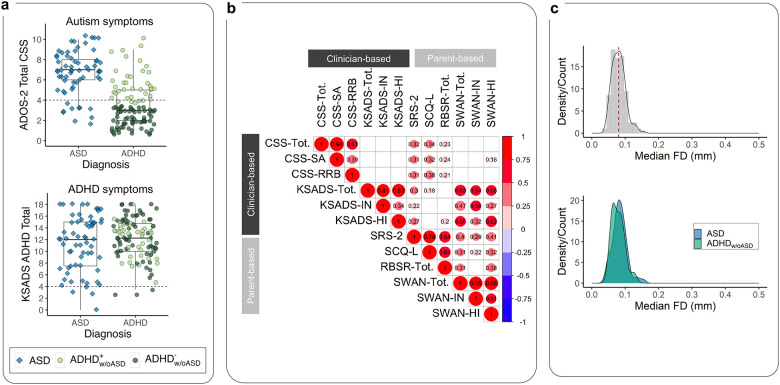
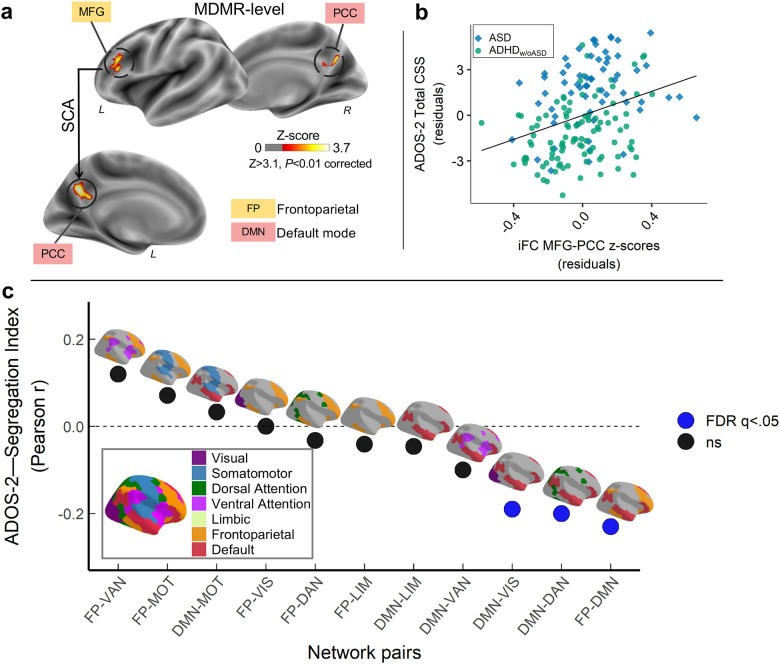
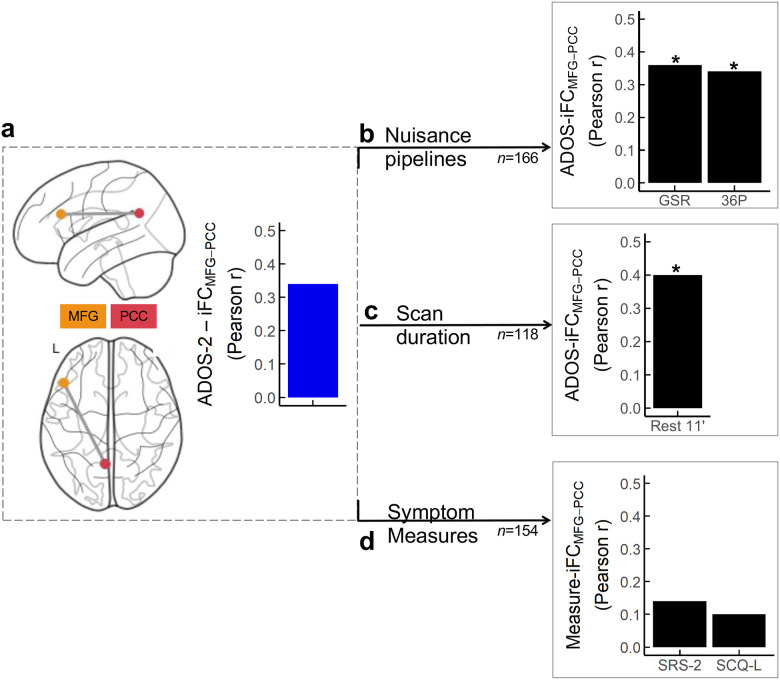
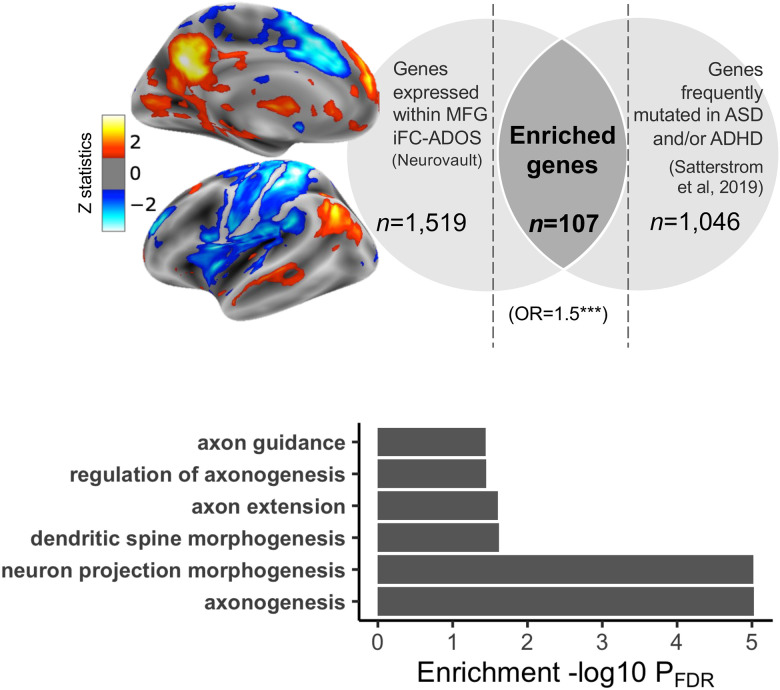
Clinical, neuroimaging and genomics evidence have increasingly underscored a degree of overlap between autism and attention-deficit/hyperactivity disorder (ADHD). This study explores the specific contribution of their core symptoms to shared biology in a sample of N=166 verbal children (6-12 years) with rigorously-established primary diagnoses of either autism or ADHD (without autism). We investigated the associations between inter-individual differences in clinician-based dimensional measures of autism and ADHD symptoms and whole-brain low motion intrinsic functional connectivity (iFC). Additionally, we explored their linked gene expression patterns in silico. Whole-brain multivariate distance matrix regression revealed a transdiagnostic association between autism severity and iFC of two nodes: the middle frontal gyrus of the frontoparietal network and posterior cingulate cortex of the default mode network. Across children, the greater the iFC between these nodes, the more severe the autism symptoms, even after controlling for ADHD symptoms. Results from segregation analyses were consistent with primary findings, underscoring the significance of internetwork iFC interactions for autism symptom severity across diagnoses. No statistically significant brain-behavior relationships were observed for ADHD symptoms. Genetic enrichment analyses of the iFC maps associated with autism symptoms implicated genes known to: (i) have greater rate of variance in autism and ADHD, and (ii) be involved in neuron projection, suggesting shared genetic mechanisms for this specific brain-clinical phenotype. Overall, these findings underscore the relevance of transdiagnostic dimensional approaches in linking clinically-defined phenomena to shared presentations at the macroscale circuit- and genomic-levels among children with diagnoses of autism and ADHD.


Conflict of interest statement

CONFLICT OF INTEREST Drs. Lord and Bishop receive royalties for the sale of diagnostic instruments they have co-authored (ADOS-2 and/or SCQ); profits generated from any of their own research or clinical activities are donated to charity. Dr. Di Martino is coauthor of the Italian version of the Social Responsiveness Scale — child version distributed in Italy by Organizzazioni Speciali, Italy. All other co authors report no financial interests or potential conflicts of interest.

Figures

Fig. 1:
Fig. 1:. Key characteristics of the sample.
a) We included N=166 children comprising n=63 classified with autism and n=103 classified as ADHDw/oASD (blue diamonds and green circles, respectively). The box plots show the distribution of clinician-based ratings of autism and ADHD symptoms, indexed by the ADOS-2 CSS-Total (top) and KSADS total scores (bottom), respectively for the children divided by their primary diagnostic group. As expected, on average, the children in the autism group had significantly elevated CSS-Total scores. While on average, children in the ADHDw/oASD group had lower CSS-Total scores than the autism group; 38 (37%) of these children were at or above the ADOS-2 CSS-Total cutoff for autism spectrum (i.e., CSS-Total=4). This subset of children, labeled ADHDw/oASDAS+, is shown as dark green circles, the remaining (ADHDw/oASDAS−) are marked as light green circles. b) Correlation matrix across autism and ADHD symptom severity measures based on clinician’s ratings (ADOS-2 observation and KSADS parent interview) and parent questionnaire scores (SRS-2, SCQ, and SWAN, respectively). Only correlations surviving FDR-correction q<0.05 are shown in the matrix, with circle size indicating the correlation magnitude. Notably, unlike autism severity based on parent responses (i.e., SCQ and SRS-2), ratings based on clinicians’ observation (i.e., ADOS-2) were not significantly related to any ADHD ratings (i.e., SWAN and KSADS). c) Head micromovement distribution indexed by median framewise displacement (FD) across all 166 children included in analyses (top gray density plot), and by diagnostic group (bottom plots; blue autism and green ADHDw/oASD). Overall head motion was low with no significant differences between diagnostic groups. Abbreviations: ADOS-2 CSS-Total, Autism Diagnostic Observation Scale-2nd Edition Total Calibrated Severity scores; KSADS, Kiddie-Schedule for Affective Disorders and Schizophrenia for School-Age Children–Present and Lifetime Version; SRS-2, Social Responsiveness Scale-Second edition; SCQ-L, Social Communication Questionnairelifetime; SWAN, Strengths and Weaknesses of ADHD Symptoms and Normal Behavior.
Fig. 2:
Fig. 2:. Internetwork connectivity between frontoparietal and default networks is transdiagnostically associated with autistic symptoms.
a) Overlaid on inflated brain surface maps are the clusters with intrinsic functional connectivity (iFC) significantly associated with Autism Diagnostic Observation Scale-2nd Edition Total Calibrated Severity scores (ADOS-2 CSS-Total) based on multivariate distance matrix regression (MDMR) and follow-up seed-based correlation analyses (SCA): left middle frontal gyrus (MFG: MNI152 x=−45, y=29, z=18) within the frontoparietal network (FP; mustard), and posterior cingulate cortex/precuneus (PCC: MNI152 x=−5, y=−59, z=30) within the default mode network (DMN; red). All analyses were Gaussian Random Field corrected at Z>3.1 and p<0.01. b) Scatter plot showing the relationship between CSS-Total and MFG iFC with PCC across children with autism spectrum disorder (ASD; blue diamonds) and Attention-Deficit/Hyperactivity Disorder without autism (ADHDw/oASD; green circles). Both iFC and CSS-Total are shown after regressing the same covariates used in discovery brain-behavior analyses (i.e., median FD, age, sex and KSADS ADHD total score). c) Correlation values (Pearson r) between ADOS-2 CSS-Total and segregation index (SI) between FP and DMN, as well as the SI for DMN and FP with each of the other networks defined by the 7-network Yeo-Krienen atlas (i.e., visual [VIS; purple], somatomotor [MOT; blue], dorsal attention [DAN; green], ventral attention [VAN; pink], limbic [LIM; khaki]). The SI-CSS correlations surviving FDR correction at q<0.05 are indicated as blue circles whereas black circles indicate non-significant associations. As shown, SI between DMN and FP, as well as between DMN and both DAN and VIS were significantly negatively correlated with CSS.
Fig. 3:
Fig. 3:. Robustness of brain-behavior primary findings to alternative MRI nuisance strategies, scan duration, and behavioral measures.
a) Overlaid on Nilearn surface glass brains are the clusters with iFC significantly related to the Autism Diagnostic Observation Scale-second edition (ADOS-2) Total Calibrated Severity Scores (CSS-Total) based on the MDMR/SCA discovery analyses — i.e., the middle frontal gyrus (MFG) of the frontoparietal network (FP; mustard), and the posterior cingulate/precuneus (PCC) of the default mode network (DMN, red). The blue histogram illustrates the magnitude of the correlation between the MFG-PCC iFC and the ADOS-2 CSS-Total (Rest 6 minutes + discovery preprocessing pipeline, aCompCor) from the discovery analyses. The black histograms index the magnitude of the MFG-PCC correlation with ADOS-2 CSS-Total after: b) preprocessing using global signal regression (GSR) or 36 nuisance parameter regression (36P) in the 166 children included in the study; c) concatenating two quality assured resting state fMRI (R-fMRI) scans (6’20”+4’39”=10’59”) in a subset of children completing both R-fMRI scans n=118); d) using parent ratings on the Social Responsiveness Scale-second edition (SRS-2) or the Social Communication Questionnaire-lifetime (SCQ-L) available in n=154 children. Asterisks indicate that correlations were statistically significant following FDR correction.
Fig. 4:
Fig. 4:. Transdiagnostic transcriptomic signature of iFC maps associated with autism symptom severity.
a. We performed gene decoding analyses on the iFC statistical map of the middle frontal gyrus (MFG) seed associated with the Autism Diagnostic Observation Scale-2nd Edition (ADOS-2) Total Calibrated Severity Scores (CSS-Total). The Z statistic MFG iFC map is overlaid on inflated surface maps. Gene decoding identified N=1,519 genes as having a spatial expression pattern significantly similar to the MFG iFC map. They are shown in the left light gray area of the Venn diagram. The right light gray area of the Venn diagram shows the number of genes (N=1,046 reported to be dysregulated in autism and/or ADHD by Satterstrom et al. 2019.[42] The number of genes resulting from gene enrichment analysis is depicted in the dark gray area of the Venn diagram as the overlap between these genes and those decoded. b. Specific biological GO terms included under the neuron morphogenesis term class associated with genes linked to the MFG iFC map, and related statistics (see also Fig S6 and Table S7).

Similar articles

References

    1. Cuthbert BN. The role of RDoC in future classification of mental disorders. Dialogues Clin Neurosci. 2020;22:81–85. - PMC - PubMed
    1. Kern JK, Geier DA, Sykes LK, Geier MR, Deth RC. Are ASD and ADHD a Continuum? A Comparison of Pathophysiological Similarities Between the Disorders. J Atten Disord. 2015;19:805–827. - PubMed
    1. Hollingdale J, Woodhouse E, Young S, Fridman A, Mandy W. Autistic spectrum disorder symptoms in children and adolescents with attention-deficit/hyperactivity disorder: a meta-analytical review. Psychol Med. 2020;50:2240–2253. - PubMed
    1. Martin J, Hamshere ML, O’Donovan MC, Rutter M, Thapar A. Factor structure of autistic traits in children with ADHD. J Autism Dev Disord. 2014;44:204–215. - PMC - PubMed
    1. Grzadzinski R, Di Martino A, Brady E, Mairena MA, O’Neale M, Petkova E, et al. Examining autistic traits in children with ADHD: does the autism spectrum extend to ADHD? J Autism Dev Disord. 2011;41:1178–1191. - PMC - PubMed

Publication types

LinkOut - more resources