. 2024 Dec 3;4(1):ycae151.
doi: 10.1093/ismeco/ycae151. eCollection 2024 Jan.

Temporal dynamics in a red alga dominated geothermal feature in Yellowstone National Park

Affiliations

Temporal dynamics in a red alga dominated geothermal feature in Yellowstone National Park

Timothy G Stephens et al. ISME Commun. .

Abstract

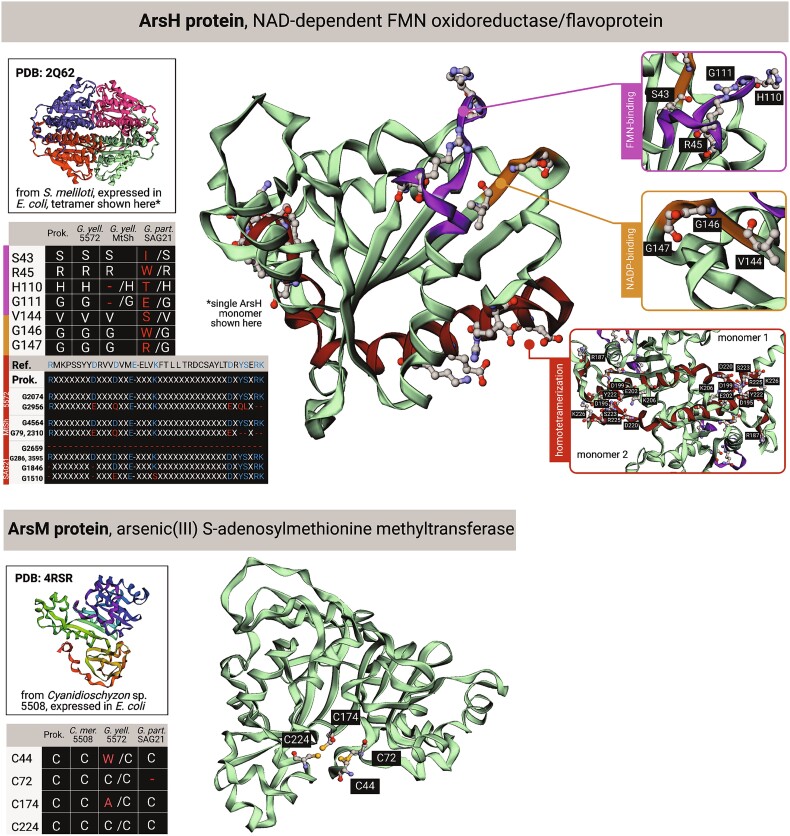
Alga-dominated geothermal spring communities in Yellowstone National Park (YNP), USA, have been the focus of many studies, however, relatively little is known about the composition and community interactions which underpin these ecosystems. Our goal was to determine, in three neighboring yet distinct environments in Lemonade Creek, YNP, how cells cope with abiotic stressors over the diurnal cycle. All three environments are colonized by two photosynthetic lineages, Cyanidioschyzon and Galdieria, both of which are extremophilic Cyanidiophyceae red algae. Cyanidioschyzon, a highly specialized obligate photoautotroph, dominated cell counts at all three Lemonade Creek environments. The cell cycle of Cyanidioschyzon in YNP matched that observed in synchronized cultures, suggesting that light availability plays a strong role in constraining growth of this alga in its natural habitat. Surprisingly, the mixotrophic and physiologically more flexible Galdieria, was a minor component of these algal populations. Arsenic detoxification at Lemonade Creek occurred via complementary gene expression by different eukaryotic and prokaryotic lineages, consistent with this function being shared by the microbial community, rather than individual lineages completing the entire pathway. These results demonstrate the highly structured nature of these extreme habitats, particularly regarding arsenic detoxification.

Keywords: Yellowstone National Park; community interactions; cyanidiophyceae; extremophiles; hot springs; microbiome; multi-omics.


Conflict of interest statement

Authors declare that they have no competing interests.

Figures

Figure 1
Figure 1
The studied YNP habitats and analysis of metagenome data. (A) The submerged creek biofilm, endolithic, and adjacent acidic soil habitats that were sampled in Lemonade Creek, YNP. (B) The relative number of reads (out of the total corrected reads from a given sample) that aligned to each type of MAG (i.e. bacterial, archaeal, eukaryotic, and unassigned) and the C. merolae 10D and G. yellowstonensis 5587.1 reference nuclear and organelle genomes in the combined non-redundant dataset from the three YNP habitats. (C) The relative abundance, in transcripts per million (TPM), of each MAG. (D) Principal component analysis (PCA) of C. merolae and G. yellowstonensis single-nucleotide polymorphism (SNP) data from the three studied habitats at YNP. The first two principal components are shown for each species. These data demonstrate that the algal populations have a high degree of distinctness in PC1. For G. yellowstonensis, the Endolithic populations are dispersed largely due to lack of SNP data from the Creek biofilm population (PC1, 0; PC2, 0).
Figure 2
Figure 2
Analysis of YNP metatranscriptome data. Relative abundance (TPM) of (A) Poly-A and (B) RiboMinus metatranscriptome reads mapped against the predicted genes from the assembled YNP metagenome data and reference algal genomes (see legend). Each bar in the graph represents the average value of the n = 3 replicates per time point that were analyzed. Expression patterns of all C. Merolae 10D (C) and G. Yellowstonensis 5587.1 (D) genes in the Soil Poly-A libraries. The patterns are presented as log2 z-score normalized values. Each point in the line graph represents the average value of the n = 4 replicates per time point that were analyzed. The purple lines in the C. Merolae 10D (C) and G. Yellowstonensis 5587.1 (D) panels represent the average expression value of all transcripts at each time point; the three purple lines in each plot represent the average expression of nuclear, plastid, and mitochondrial genes. (E, F). The same analysis of expression patterns done for the Creek biofilm samples.
Figure 3
Figure 3
Analysis of mer and ars genes. (A) Distribution and copy number of mer and ars genes in a canonical phylogeny [3] of Cyanidiophyceae. The species (or closely related strains) present in the studied YNP habitats are shown in the red text. (B) Schematic prokaryotic cells showing canonical mercury (top) and arsenic (bottom) detoxification pathways. The cells portray the relevant enzymes, however, not all prokaryotes encode all components of these pathways. (C) Contribution of taxonomic groups to the arsenic and mercury detoxification pathways in the Creek biofilm samples. The TPM expression values of all genes from an orthogroup identified as containing genes putatively from a specific step in the detoxification pathway is shown as a stacked bar graph (left). The proportion of TPM values contributed by each taxonomic group is shown as a stacked bar graph (right).
Figure 4
Figure 4
Loss of conserved residues in Cyanidiophyceae ArsH and ArsM. The reference bacterial structures are shown for arsH and arsM, as are alignments and locations of conserved site changes in the structures that are present in the sequences of the proteins in G. yellowstonensis 5572, MtSh, and G. partita SAG21.92. These data suggest that the algal ars gene original functions may be compromised or lost (supplemental material). Made in biorender.

Similar articles

Cited by

References

    1. Rossoni AW, Price DC, Seger Met al. . The genomes of polyextremophilic cyanidiales contain 1% horizontally transferred genes with diverse adaptive functions. elife 2019;8:8. 10.7554/eLife.45017 - DOI - PMC - PubMed
    1. Schönknecht G, Chen W-H, Ternes CMet al. . Gene transfer from bacteria and archaea facilitated evolution of an extremophilic eukaryote. Science 2013;339:1207–10. 10.1126/science.1231707 - DOI - PubMed
    1. Park SI, Cho CH, Ciniglia Cet al. . Revised classification of the Cyanidiophyceae based on plastid genome data with descriptions of the Cavernulicolales Ord. Nov. and Galdieriales Ord. Nov. (Rhodophyta). J Phycol 2023;59:444–66. 10.1111/jpy.13322 - DOI - PubMed
    1. Castenholz RW, McDermott TR. The Cyanidiales: Ecology, biodiversity, and biogeography. In: Seckbach J., Chapman D.J. (eds.), Red Algae in the Genomic Age. Netherlands, Dordrecht: Springer, 2010, 357–71. 10.1007/978-90-481-3795-4_19 - DOI
    1. Reeb V, Bhattacharya D. The Thermo-acidophilic Cyanidiophyceae (Cyanidiales). In: Seckbach J., Chapman D.J. (eds.), Red Algae in the Genomic Age. Netherlands, Dordrecht: Springer, 2010, 409–26. 10.1007/978-90-481-3795-4_22 - DOI

LinkOut - more resources