. 2024 Dec 6:15:1415317.
doi: 10.3389/fimmu.2024.1415317. eCollection 2024.

Remodeling of the chromatin landscape in peripheral blood cells in patients with severe Delta COVID-19

Affiliations

Remodeling of the chromatin landscape in peripheral blood cells in patients with severe Delta COVID-19

Vasiliy E Akimov et al. Front Immunol. .

Abstract

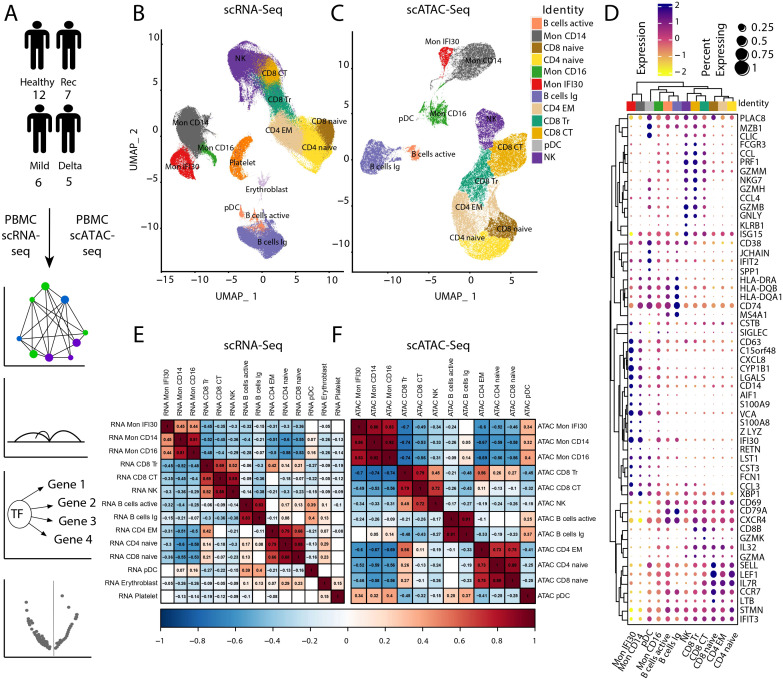
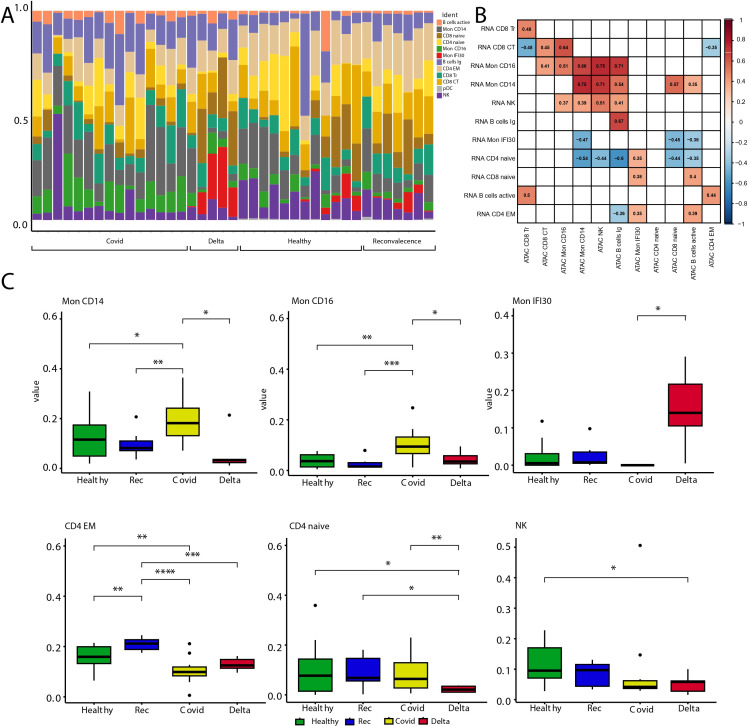
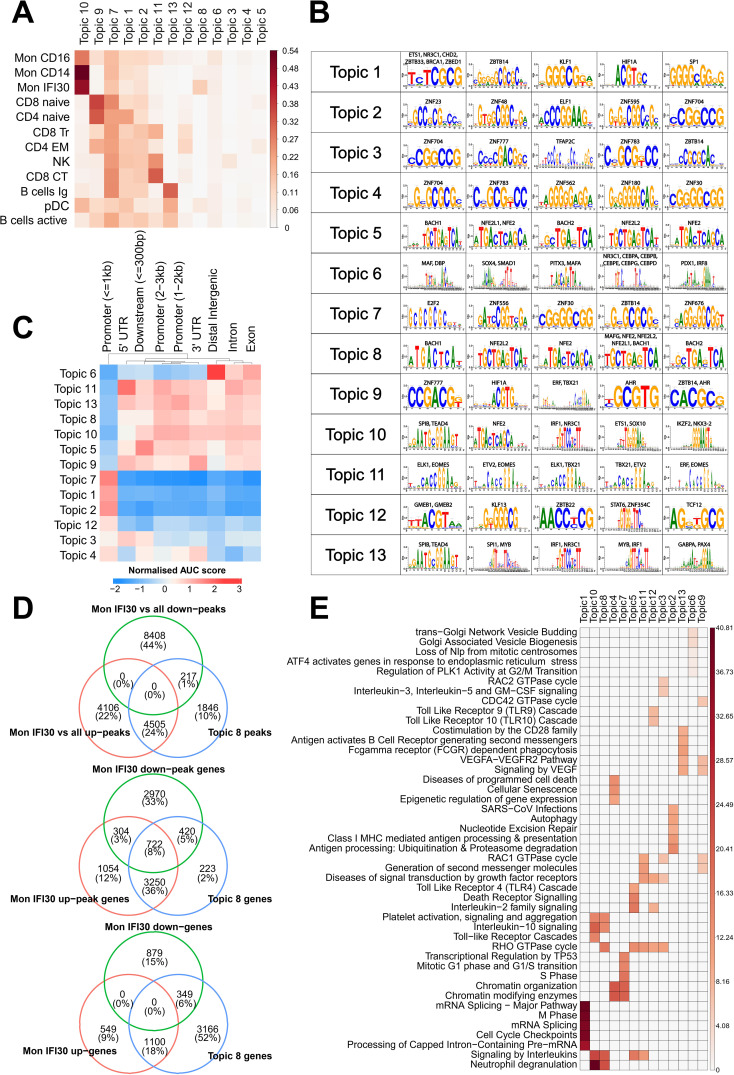
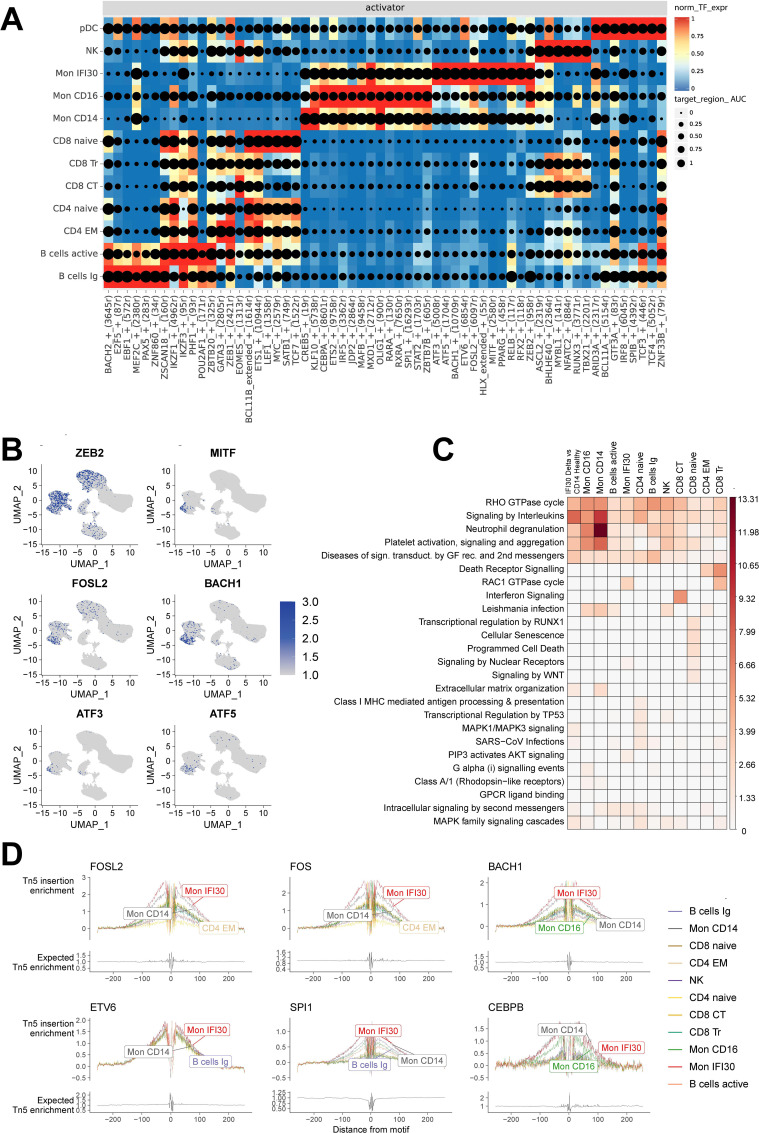
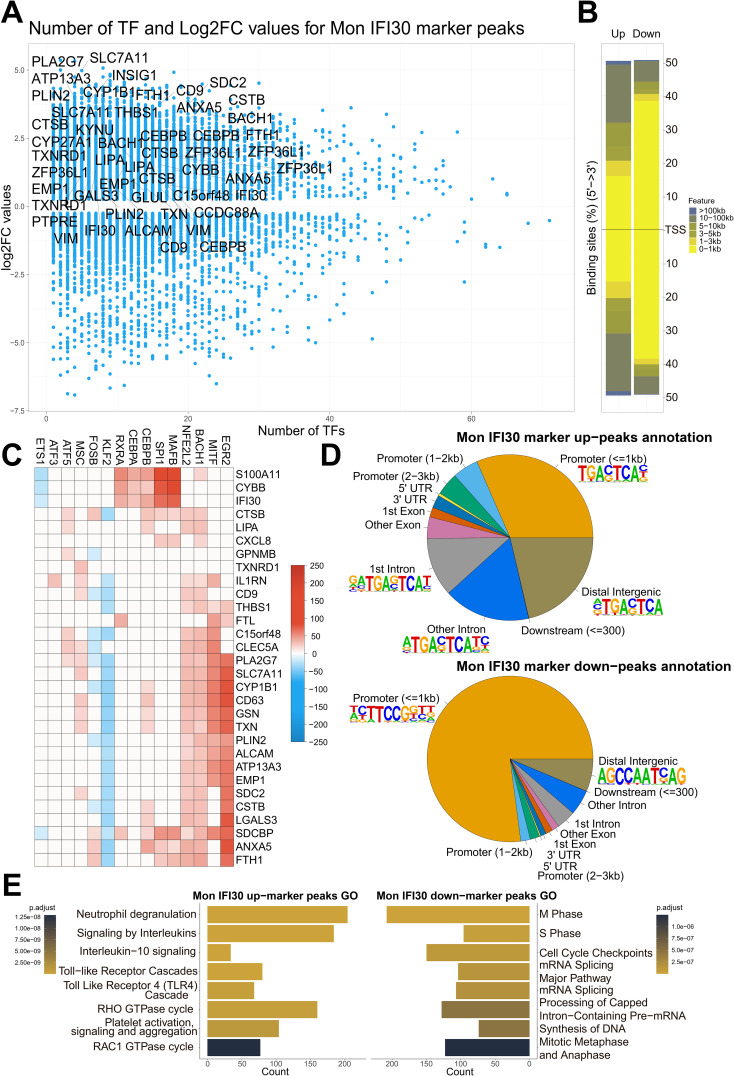
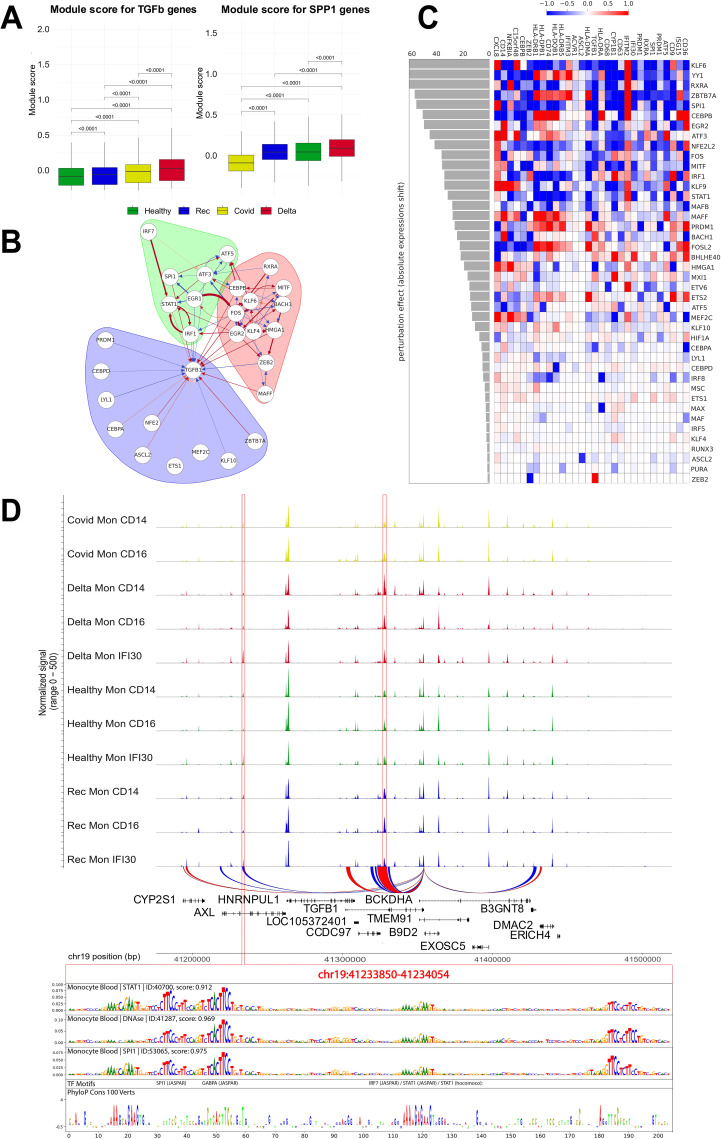
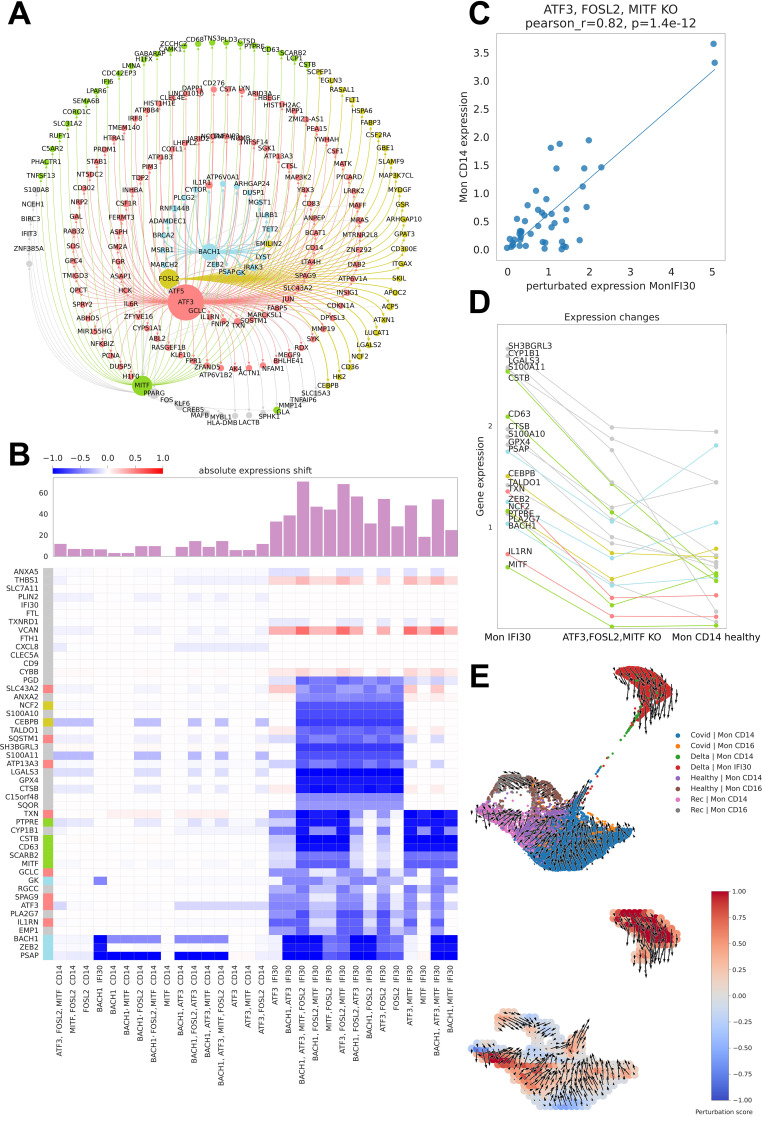
COVID-19 is characterized by systemic pro-inflammatory shifts with the development of serious alterations in the functioning of the immune system. Investigations of the gene expression changes accompanying the infection state provide insight into the molecular and cellular processes depending on the sickness severity and virus variants. Severe Delta COVID-19 has been characterized by the appearance of a monocyte subset enriched for proinflammatory gene expression signatures and a shift in ligand-receptor interactions. We profiled the chromatin accessibility landscape of 140,000 nuclei in PBMC samples from healthy individuals or individuals with COVID-19. We investigated cis-regulatory elements and identified the core transcription factors governing gene expression in immune cells during COVID-19 infection. In severe cases, we discovered that regulome and chromatin co-accessibility modules were significantly altered across many cell types. Moreover, cases with the Delta variant were accompanied by a specific monocyte subtype discovered using scATAC-seq data. Our analysis showed that immune cells of individuals with severe Delta COVID-19 underwent significant remodeling of the chromatin accessibility landscape and development of the proinflammatory expression pattern. Using a gene regulatory network modeling approach, we investigated the core transcription factors governing the cell state and identified the most pronounced chromatin changes in CD14+ monocytes from individuals with severe Delta COVID-19. Together, our results provide novel insights into cis-regulatory module organization and its impact on gene activity in immune cells during SARS-CoV-2 infection.

Keywords: COVID-19; PBMC (peripheral blood mononuclear cells); scATAC-seq; single cell; transcriptional regulatory network.


Conflict of interest statement

The authors declare that the research was conducted in the absence of any commercial or financial relationships that could be construed as a potential conflict of interest.

Figures

Figure 1
Figure 1
Data analysis workflow and scRNA-seq/scATAC-seq integration. (A) We performed scATAC-seq of the PBMC samples from 12 healthy, seven convalescence, six mild COVID-19, and five individuals with severe/critical Delta COVID-19, followed by computational analysis and integration with scRNA-seq, reconstruction of the gene regulatory networks, and analysis of differential chromatin accessibility. (B) UMAP of scRNA-seq and cell-type annotation. (C) UMAP of scATAC-seq data and cell type annotation. (D) Signal of the Chromatin accessibility signal for PBMC marker genes. (E) Pseudobulk gene expression across different cell types using scRNA-seq. The gaps are correlation values with low significance level (p-value >0.05 ). (F) Pseudobulk-approximated gene activity Pearson’s correlation across cell types in scATAC-seq. Gaps are correlation values with low significance level (p-value >0.05 ).
Figure 2
Figure 2
Analysis of cell type abundance across the study cohorts. (A) Barplot with fractions of cell types across cohorts. (B) Heatmap showing Pearson correlation of scRNA-seq pseudobulk gene expression and approximated gene activity from scATAC-seq across cell types. Gaps are correlation values with low significance level (p-value >0.05). (C) Boxplots with cell fractions across the study cohorts. Pairwise comparisons were performed using Wilcoxon rank-sum test. Significant changes (adjusted p-values <0.05 ) are shown with stars. * stands for p-value < 0.05; ** stands for p-value < 0.005; *** stands for p-value < 0.0005; **** stands for p-value < 0.00005.
Figure 3
Figure 3
Analysis of cis-regulatory topics. (A) Jaccard metric for overlap of cis-regulatory topics and cell type-specific marker peaks. (B) Top-enriched de novo discovered motifs in cis-regulatory topics. (C) Normalized enrichment of cis-regulatory topics in genomic segments, as estimated using cisTopic. (D) Intersection of the Mon IFI30 specific up/downregulated marker peaks with topic 8. We found that topic 8 strongly overlapped with upregulated but not downregulated marker peaks. We also assigned scATAC-seq peaks and topic 8 loci to the closest genes and found a high overlap with marker genes of the Mon IFI30 cell state. (E) Enrichment of the Reactome pathways based on the assignment of topic cis-regulatory regions to genes. Colorbars show the −log(p.adjusted).
Figure 4
Figure 4
Joint scRNA-seq/scATAC-seq analysis revealed the core transcriptional regulators in each cell state. (A) Heatmap/dotplot with TF expression of enhancer-driven regulons (color scale) considering the cell-type specificity of the regulons (dot size scale). (B) Pseudoexpression (estimated gene activity) of the core transcriptional regulators (ZEB2, MITF, FOSL2, BACH1, ATF3, and ATF5) in the Mon IFI30 cell state across all cells. (C) Enrichment of the Reactome Pathways for upregulated peaks between Delta COVID-19 and healthy individuals. The peaks were assigned to the closest gene. (D) Footprint profiles for Mon IFI30 regulators (FOSL2, FOS, BACH1, ETV6, SPI1, and CEBPB) across cell types.
Figure 5
Figure 5
Mon IFI30 cis-regulatory elements. (A) Scatterplot of the number of TFs operating in the Mon IFI30 marker peaks (as estimated using SCENIC+). The highlighted genes represent Mon IFI30 expression markers. (B) Barplot showing the distribution of the Mon IFI30 marker peaks around TSS. (C) Heatmap showing the contribution of transcription factors in the regulation of Mon IFI30 marker genes. (D) Distribution of Mon IFI30 marker peaks by UTRs, exons, introns, promoters, and distal intergenic locations. The top enriched motifs within each segment are highlighted with logos. (E) Enrichment of the Reactome Pathways for up/down marker peaks in Mon IFI30.
Figure 6
Figure 6
TGF beta gene regulatory network and in silico perturbation of Mon IFI30 cell state regulators. (A) Boxplot with aggregated scores for TGF beta and SPP1 modules (obtained from the CellChat database). Significant differences are highlighted with p-values. Module score have been calculated for all monocytes (Mon CD14, Mon CD16, and Mon IFI30). (B) Gene regulatory subnetwork centered on TGFB1. Modules of the network were estimated using a community detection algorithm based on random walks. (C) Heatmap barplot with in silico perturbation of transcription factors in Mon IFI30. Barplot shows the absolute perturbation effect on the expression of Mon IFI30 marker genes in a single computational knockdown of a TF. (D) Chromatin accessibility signals across monocyte subtypes and cohorts. We identified two (highlighted with red frame) loci with significantly elevated chromatin openness in Mon IFI30, and distally located regions present exclusively in Mon IFI30 (left red frame). The DeepLift method highlights important regulatory nucleotides that overlap strongly with conserved sequences across mammalian positions.
Figure 7
Figure 7
Master regulators of Mon IFI30 cell state. (A) Graph of the CellOracle gene network containing Mon IFI30 marker genes and core transcriptional regulators. The nodes are colored according to the regulatory TF. The size of a node reflects the number of incoming and outcoming connections for the regulators. (B) Heatmap with the TF perturbation response. The barplot on top of the heatmap shows an absolute expression shift across all genes for every perturbation. In silico perturbations for single or multiple TFs (mentioned at the bottom of the plot). (C) Scatterplot of in CD14 monocyte expression values predicted in Mon IFI30 after joint knockdown of FOSL2, MITF, and ATF3. (D) Lineplot showing changes in the expression of the Mon IFI30 marker genes after joint in silico knockdown of FOSL2, MITF, and ATF3. (E) UMAP plot of monocytes across the study conditions with the direction of the vector fields upon joint perturbation of the FOSL2, MITF, and ATF3 TFs.

Similar articles

Cited by

References

    1. Csardi G, Nepusz T. The igraph software package for complex network research. InterJournal Complex Syst. (2006) 1695:1–9. doi: 10.5281/zenodo.7682609 - DOI
    1. Das H, Kumar A, Lin Z, Patino WD, Hwang PM, Feinberg MW, et al. . Kruppel-like factor 2 (KLF2) regulates proinflammatory activation of monocytes. Proc Natl Acad Sci U. S. A. (2006) 103:6653–8. doi: 10.1073/pnas.0508235103 - DOI - PMC - PubMed
    1. Aibar S, González-Blas CB, Moerman T, Huynh-Thu VA, Imrichova H, Hulselmans G, et al. . SCENIC: single-cell regulatory network inference and clustering. Nat Methods. (2017) 14:1083–6. doi: 10.1038/nmeth.4463 - DOI - PMC - PubMed
    1. Jha P, Das H. KLF2 in regulation of NF-κB-mediated immune cell function and inflammation. In: Int J Mol Sci. (2017) 18(11):2383. doi: 10.3390/ijms18112383 - DOI - PMC - PubMed
    1. Shrikumar A, Greenside P, Kundaje A. Learning important features through propagating activation differences. arXiv: 1704.02685. (2017) 3145–53. doi: 10.48550/arXiv.1704.02685 - DOI